Ask a question from expert
Statistics for Management : PDF
20 Pages4443 Words300 Views
Added on 2020-12-09
Statistics for Management : PDF
Added on 2020-12-09
BookmarkShareRelated Documents
STATISTICS FORMANAGEMENT
TABLE OF CONTENTSINTRODUCTION...........................................................................................................................1ACTIVITY 1....................................................................................................................................1A. Using Office of national statistics for data relate to prices index.........................................1Consumer price index (CPI and CPIH).......................................................................................1B. Producing appropriate tables and charts to reflect changes over 2007 to 2017.....................3C. Differences between above stated indices..............................................................................4D. Application of CPI for calculating annual inflation...............................................................5E. Importance of information related to rate of inflation............................................................6ACTIVITY 2....................................................................................................................................6Hourly pay rates in UK region....................................................................................................6A.1 Ogive chart for identifying median hourly earnings with quartiles.....................................6A.2 Finding standard deviation and mean for hourly earnings...................................................8B. Drafting comparison in earnings of London and Manchester region.....................................9ACTIVITY 3..................................................................................................................................102.a Carrying paired t test at 5% significance level for identifying mean length.......................102.b Present usual conditions with context of paired t test.........................................................132.c Presenting 99% confidence interval....................................................................................13ACTIVITY 4..................................................................................................................................16A. Reflecting charts of CPI, RPI and CPIH over year 2007 to 2017........................................16B. Draft Ogive chart for cumulative % staff vs hourly earnings..............................................16CONCLUSION..............................................................................................................................17REFERENCES..............................................................................................................................18
INTRODUCTIONStatistics is considered as form of mathematical analysis which is implied throughmultiple qualified model, representations along with synopses of particular set of experimentaldata and statistics of real life. Generally, this would provide brief process of using features ofdata base. If data set is entirely dependent on sample of huge population then this would developvarious interpretations on basis of population which is on basis of statistical outcome to designany sample. This statistical analysis consists of process to evaluate and collect data and thensummarized in mathematical form. It leads to raise global competition and it is mandatory formanagers with aim of describing uncertainties with application of methods and for purpose ofbusiness decision making.The present report is based on activities as it will represent Consumer and retail priceindex with use of graph over year 2007 to 2017. It will also articulate about variations andcalculation of annual inflation with context to Consumer price index. In the same series, it willanalyse and evaluate hourly pay rates in various regions of UK such as London and Manchesterwith use of descriptive statistics. Simultaneously, this will be carrying paired t test for purpose ofinvestigating that mean length time of using new and old system at 95% and 99% level ofsignificance. Lastly, data from office of national statistics would be articulated in graphicalformat and ogive chart for cumulative % of staff vs hourly earnings.1
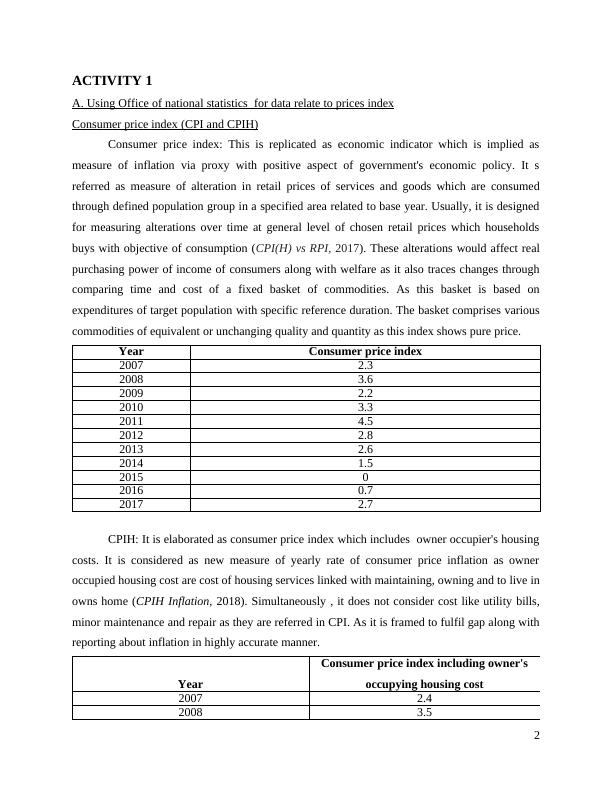
ACTIVITY 1A. Using Office of national statistics for data relate to prices indexConsumer price index (CPI and CPIH)Consumer price index: This is replicated as economic indicator which is implied asmeasure of inflation via proxy with positive aspect of government's economic policy. It sreferred as measure of alteration in retail prices of services and goods which are consumedthrough defined population group in a specified area related to base year. Usually, it is designedfor measuring alterations over time at general level of chosen retail prices which householdsbuys with objective of consumption (CPI(H) vs RPI, 2017). These alterations would affect realpurchasing power of income of consumers along with welfare as it also traces changes throughcomparing time and cost of a fixed basket of commodities. As this basket is based onexpenditures of target population with specific reference duration. The basket comprises variouscommodities of equivalent or unchanging quality and quantity as this index shows pure price.YearConsumer price index20072.320083.620092.220103.320114.520122.820132.620141.52015020160.720172.7CPIH: It is elaborated as consumer price index which includes owner occupier's housingcosts. It is considered as new measure of yearly rate of consumer price inflation as owneroccupied housing cost are cost of housing services linked with maintaining, owning and to live inowns home (CPIH Inflation, 2018). Simultaneously , it does not consider cost like utility bills,minor maintenance and repair as they are referred in CPI. As it is framed to fulfil gap along withreporting about inflation in highly accurate manner.YearConsumer price index including owner'soccupying housing cost20072.420083.52
End of preview
Want to access all the pages? Upload your documents or become a member.
Related Documents
Statistics for Management : Assignment Samplelg...
|16
|4020
|369
(PDF) Statistics for management | Assignment Samplelg...
|15
|2703
|98
Statistics For Management (pdf)lg...
|15
|3242
|330
Statistics for Management Assignment Solutionlg...
|16
|3449
|157
Statistics Management Assignment - Solutionlg...
|15
|3194
|285
Inflationary Analysis Using Consumer Price Index and Retail Price Indexlg...
|17
|3322
|335