Ask a question from expert
Statistics for Management Solved Assignment - Doc
17 Pages3255 Words243 Views
Added on 2021-01-03
Statistics for Management Solved Assignment - Doc
Added on 2021-01-03
BookmarkShareRelated Documents
STATISTICS FORMANAGEMENT
Table of ContentsINTRODUCTION...........................................................................................................................1ACTIVITY 1....................................................................................................................................1A) Locating data by collecting data from ONS of last ten years for CPI and RPI.....................1B) Preparation of graph and table for the data displayed............................................................2C) Highlighting Retail Price Index (RPI) vs Consumer price Index (CPI).................................4D) Calculating annual inflation by applying CPI........................................................................5E) Significance of inflation rate..................................................................................................5ACTIVITY 2....................................................................................................................................6A) Calculating hourly pay rates of staff......................................................................................61. Using an ogive for estimating median hourly earnings and quartiles.....................................62. Computing mean and standard deviation for extracting hourly earnings...............................8B) Making comparison of two different regions in terms of earnings........................................9ACTIVITY 3..................................................................................................................................10A) Finding economic order quantity.........................................................................................10B) Deciding how often tee-shirts need to be ordered................................................................10C) Calculating inventory policy cost.........................................................................................10D) Finding current service level to customers..........................................................................10E) Working out re-order level for the business.........................................................................10ACTIVITY 4..................................................................................................................................10A) Producing bar or line charts with reference to RPI and CPI for 2007 to 2017....................10B) Preparation of ogive chart of cumulative percentage of staff versus hourly earnings.........11CONCLUSION..............................................................................................................................11REFERENCES..............................................................................................................................13
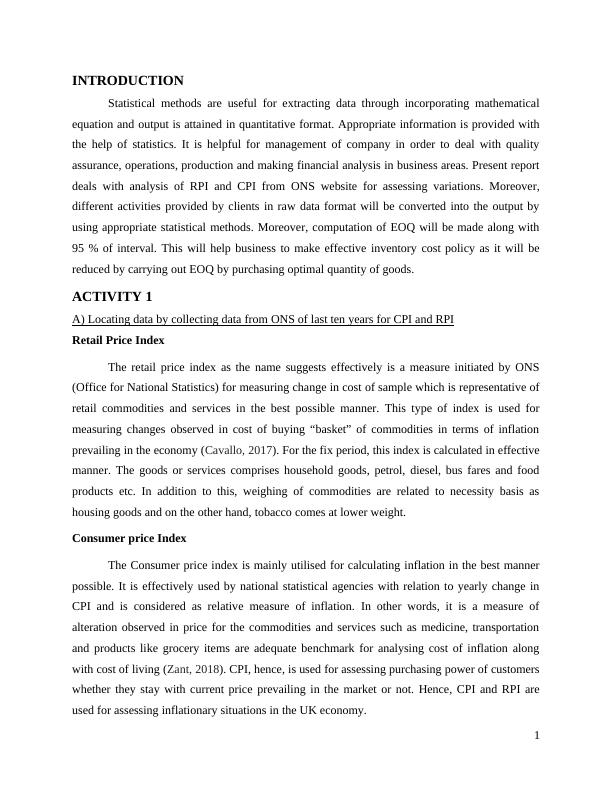
INTRODUCTIONStatistical methods are useful for extracting data through incorporating mathematicalequation and output is attained in quantitative format. Appropriate information is provided withthe help of statistics. It is helpful for management of company in order to deal with qualityassurance, operations, production and making financial analysis in business areas. Present reportdeals with analysis of RPI and CPI from ONS website for assessing variations. Moreover,different activities provided by clients in raw data format will be converted into the output byusing appropriate statistical methods. Moreover, computation of EOQ will be made along with95 % of interval. This will help business to make effective inventory cost policy as it will bereduced by carrying out EOQ by purchasing optimal quantity of goods.ACTIVITY 1A) Locating data by collecting data from ONS of last ten years for CPI and RPIRetail Price IndexThe retail price index as the name suggests effectively is a measure initiated by ONS(Office for National Statistics) for measuring change in cost of sample which is representative ofretail commodities and services in the best possible manner. This type of index is used formeasuring changes observed in cost of buying “basket” of commodities in terms of inflationprevailing in the economy (Cavallo, 2017). For the fix period, this index is calculated in effectivemanner. The goods or services comprises household goods, petrol, diesel, bus fares and foodproducts etc. In addition to this, weighing of commodities are related to necessity basis ashousing goods and on the other hand, tobacco comes at lower weight.Consumer price IndexThe Consumer price index is mainly utilised for calculating inflation in the best mannerpossible. It is effectively used by national statistical agencies with relation to yearly change inCPI and is considered as relative measure of inflation. In other words, it is a measure ofalteration observed in price for the commodities and services such as medicine, transportationand products like grocery items are adequate benchmark for analysing cost of inflation alongwith cost of living (Zant, 2018). CPI, hence, is used for assessing purchasing power of customerswhether they stay with current price prevailing in the market or not. Hence, CPI and RPI areused for assessing inflationary situations in the UK economy.1
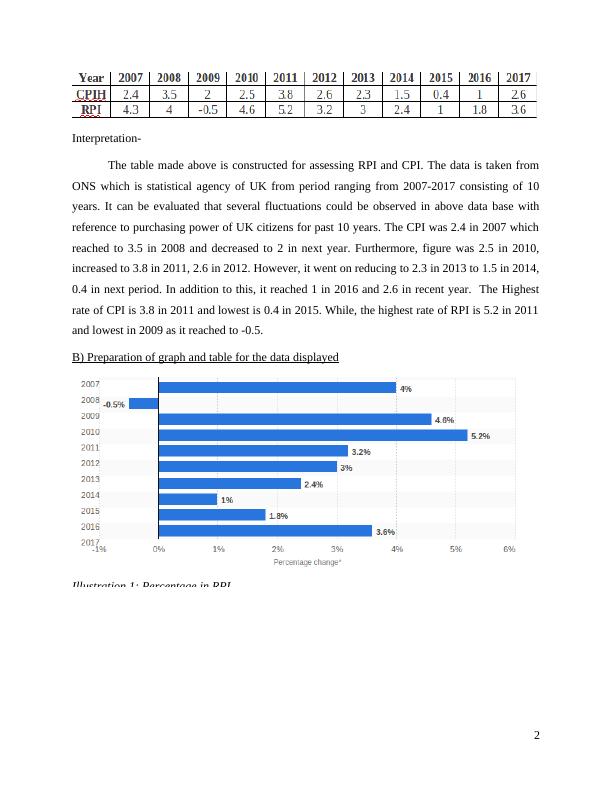
Interpretation-The table made above is constructed for assessing RPI and CPI. The data is taken fromONS which is statistical agency of UK from period ranging from 2007-2017 consisting of 10years. It can be evaluated that several fluctuations could be observed in above data base withreference to purchasing power of UK citizens for past 10 years. The CPI was 2.4 in 2007 whichreached to 3.5 in 2008 and decreased to 2 in next year. Furthermore, figure was 2.5 in 2010,increased to 3.8 in 2011, 2.6 in 2012. However, it went on reducing to 2.3 in 2013 to 1.5 in 2014,0.4 in next period. In addition to this, it reached 1 in 2016 and 2.6 in recent year. The Highestrate of CPI is 3.8 in 2011 and lowest is 0.4 in 2015. While, the highest rate of RPI is 5.2 in 2011and lowest in 2009 as it reached to -0.5.B) Preparation of graph and table for the data displayedIllustration 1: Percentage in RPI2
End of preview
Want to access all the pages? Upload your documents or become a member.
Related Documents
Statistical Statistics for Management Inflationlg...
|24
|3596
|221
Statics for MANAGEMENT INTRODUCTIONlg...
|20
|4724
|57
Statistics for Management : Assignment Samplelg...
|16
|4020
|369
Statistics For Management (pdf)lg...
|15
|3242
|330
(Doc) Statistics for Management Assignmentlg...
|23
|4220
|39
Statistics for Management Assignment Solutionlg...
|16
|3449
|157