Statistical Methods for Management InTRODUCTION 1 TASK 11
VerifiedAdded on 2021/02/20
|14
|3373
|291
AI Summary
Tesco use the statistical data to implement their strategy and simplify the large set of data in systematical manner to get the required information from the data. Qualitative data and the quantitative data are also used in the research and evaluation of the data in the form of graphs, charts etc help in the evaluation of the organization's performance (Amrhein, Trafimow, and Greenland, 2018). Tesco use the statistical data to implement their strategy and simplify the large set of data in systematical manner
Contribute Materials
Your contribution can guide someone’s learning journey. Share your
documents today.
Statistics for Management
Secure Best Marks with AI Grader
Need help grading? Try our AI Grader for instant feedback on your assignments.
Table of Contents
INTRODUCTION...........................................................................................................................1
TASK 1............................................................................................................................................1
1. Meaning, characteristic and benefit of statistical data in business objective...........................1
2. The different source and types of data.....................................................................................2
3. Value of employing statistical methods in meeting business objective..................................3
4. Analysis of deductive and inductive approach and their implication......................................4
5. Providing example of analysis of the sample set of data that can be used by the
organization.................................................................................................................................4
6. Evaluating suitability of one type of data analysis with another.............................................8
TASK 2............................................................................................................................................9
(Covered in PPT).........................................................................................................................9
CONCLUSION................................................................................................................................9
REFERENCES..............................................................................................................................10
INTRODUCTION
Statistics are the set of data which provides the useful information to the users. The data
are collected in large quantity and statistics help in converting the data in small no. through the
different method, so they can be easily understood. The report is divide in 2 parts. In 1 part it
highlights the characteristic of statistical data and the benefits to the organization. It explains the
source and types of data to collect the information. It also helps in understood the deductive and
inductive approach and their implication in business intelligence. In second part the report
highlights the difference in the descriptive and inferential data and the presentation of the data in
different forms like histogram, correlation, trend forecasting etc. It helps to understand the
statistical data in business and the ways to achieve the objective of the organization through the
statistical data.
TASK 1
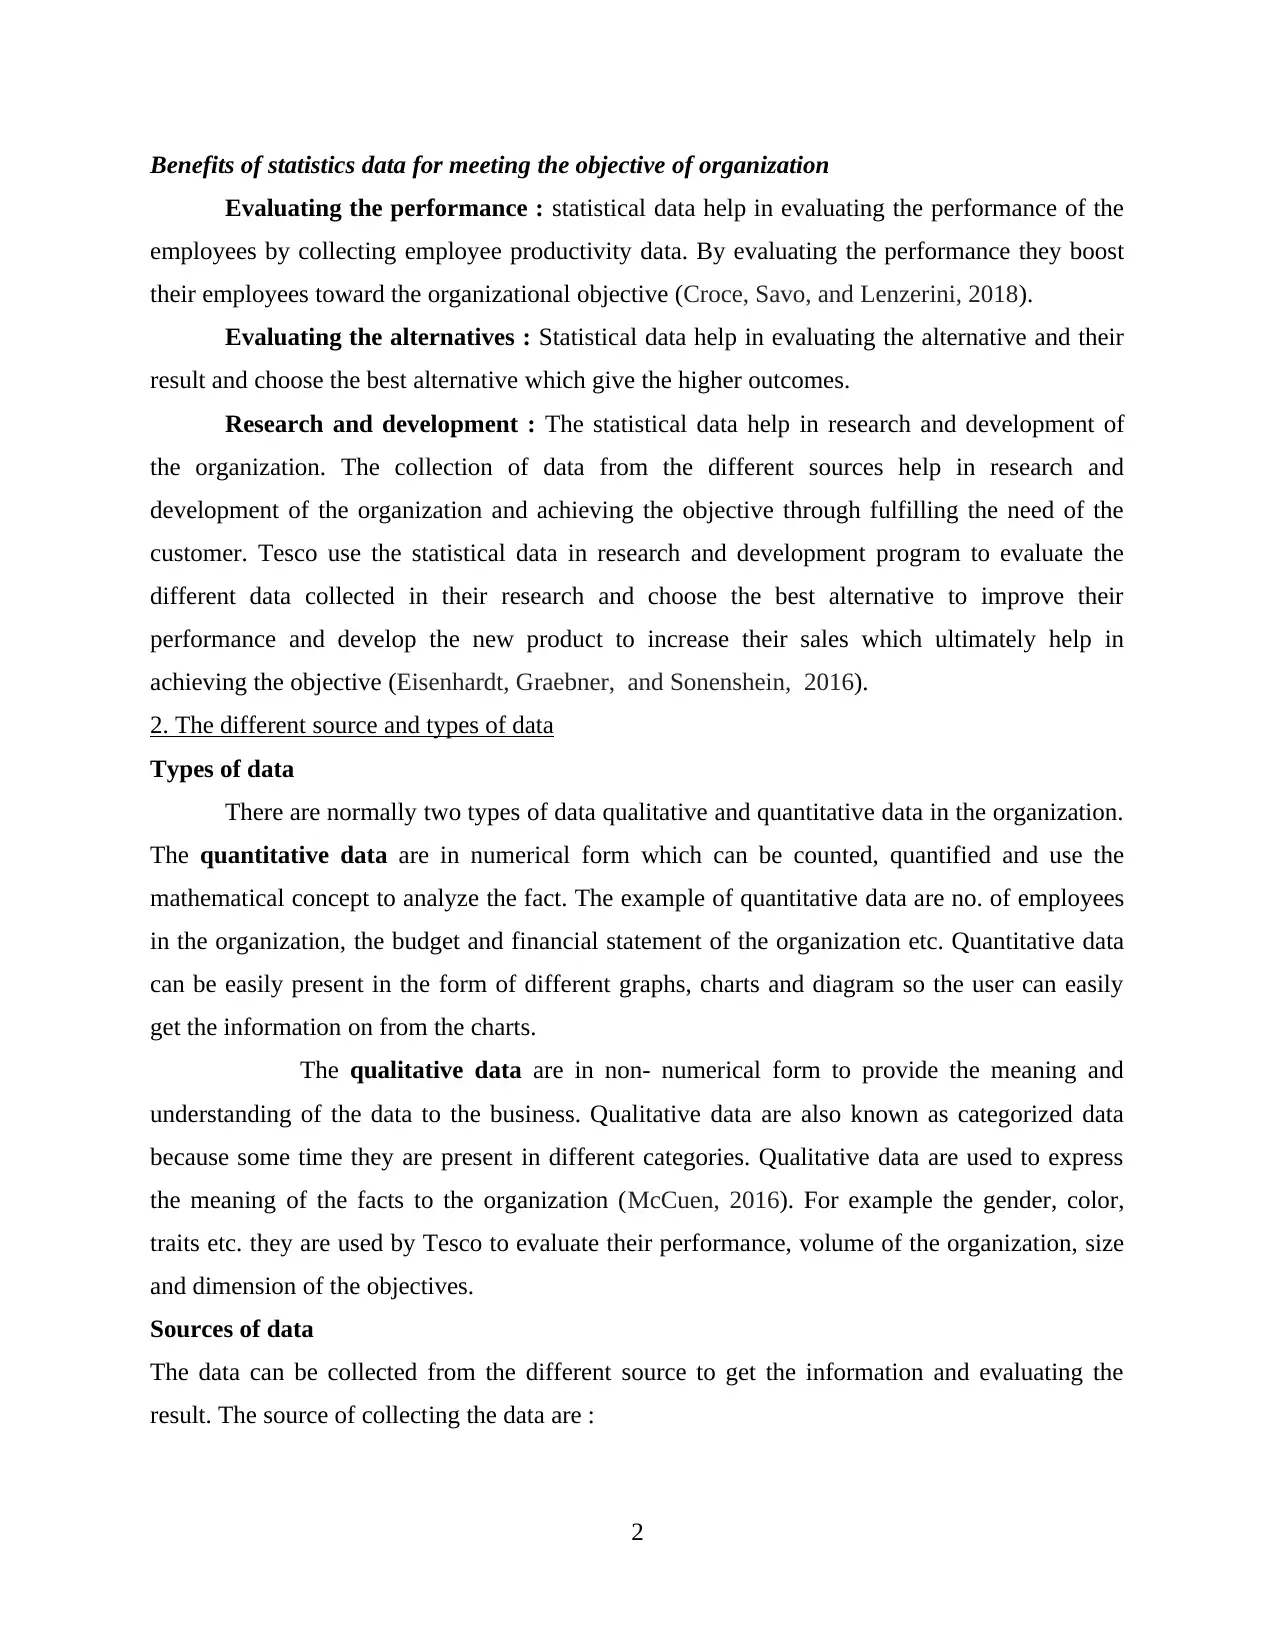
1. Meaning, characteristic and benefit of statistical data in business objective
Statistics : Statistics is used for drawing the conclusion from the set of data from the
different samples (Amrhein, Trafimow, and Greenland, 2018). Statistics is derived from the word
status which mean the group of figures and number which present some useful information for
concluding the result and reach on the final decision. Tesco use the statistical data to implement
their strategy and simplify the large set of data in systematical manner to get the required
information from the data.
Characteristic of statistics
Statistics present the various numerical facts to reach the final result. The characteristics of
statistics are as follows :
Aggregate of facts : Statistic present the aggregate of numerous data by collecting,
analyzing and evaluating them. Tesco aggregate the data for the measure of the final result. By
aggregating the fact it simplifies the process of data collection (Connelly, and et.al., 2016).
It should be numerically expressed : the collected data should be numerically
expressed, it helps in measurement and counting of the data to get the result. The measurement
of data help Tesco to analyze their financial condition and improve their performance.
Systematic manner : The data should be collected in systematic manner so the user can
understand the meaning of the data in a real sense. A proper plan and trained investigation help
the organization to get the accurate information from the data in proper time and cost.
1
Statistics are the set of data which provides the useful information to the users. The data
are collected in large quantity and statistics help in converting the data in small no. through the
different method, so they can be easily understood. The report is divide in 2 parts. In 1 part it
highlights the characteristic of statistical data and the benefits to the organization. It explains the
source and types of data to collect the information. It also helps in understood the deductive and
inductive approach and their implication in business intelligence. In second part the report
highlights the difference in the descriptive and inferential data and the presentation of the data in
different forms like histogram, correlation, trend forecasting etc. It helps to understand the
statistical data in business and the ways to achieve the objective of the organization through the
statistical data.
TASK 1
1. Meaning, characteristic and benefit of statistical data in business objective
Statistics : Statistics is used for drawing the conclusion from the set of data from the
different samples (Amrhein, Trafimow, and Greenland, 2018). Statistics is derived from the word
status which mean the group of figures and number which present some useful information for
concluding the result and reach on the final decision. Tesco use the statistical data to implement
their strategy and simplify the large set of data in systematical manner to get the required
information from the data.
Characteristic of statistics
Statistics present the various numerical facts to reach the final result. The characteristics of
statistics are as follows :
Aggregate of facts : Statistic present the aggregate of numerous data by collecting,
analyzing and evaluating them. Tesco aggregate the data for the measure of the final result. By
aggregating the fact it simplifies the process of data collection (Connelly, and et.al., 2016).
It should be numerically expressed : the collected data should be numerically
expressed, it helps in measurement and counting of the data to get the result. The measurement
of data help Tesco to analyze their financial condition and improve their performance.
Systematic manner : The data should be collected in systematic manner so the user can
understand the meaning of the data in a real sense. A proper plan and trained investigation help
the organization to get the accurate information from the data in proper time and cost.
1
Benefits of statistics data for meeting the objective of organization
Evaluating the performance : statistical data help in evaluating the performance of the
employees by collecting employee productivity data. By evaluating the performance they boost
their employees toward the organizational objective (Croce, Savo, and Lenzerini, 2018).
Evaluating the alternatives : Statistical data help in evaluating the alternative and their
result and choose the best alternative which give the higher outcomes.
Research and development : The statistical data help in research and development of
the organization. The collection of data from the different sources help in research and
development of the organization and achieving the objective through fulfilling the need of the
customer. Tesco use the statistical data in research and development program to evaluate the
different data collected in their research and choose the best alternative to improve their
performance and develop the new product to increase their sales which ultimately help in
achieving the objective (Eisenhardt, Graebner, and Sonenshein, 2016).
2. The different source and types of data
Types of data
There are normally two types of data qualitative and quantitative data in the organization.
The quantitative data are in numerical form which can be counted, quantified and use the
mathematical concept to analyze the fact. The example of quantitative data are no. of employees
in the organization, the budget and financial statement of the organization etc. Quantitative data
can be easily present in the form of different graphs, charts and diagram so the user can easily
get the information on from the charts.
The qualitative data are in non- numerical form to provide the meaning and
understanding of the data to the business. Qualitative data are also known as categorized data
because some time they are present in different categories. Qualitative data are used to express
the meaning of the facts to the organization (McCuen, 2016). For example the gender, color,
traits etc. they are used by Tesco to evaluate their performance, volume of the organization, size
and dimension of the objectives.
Sources of data
The data can be collected from the different source to get the information and evaluating the
result. The source of collecting the data are :
2
Secure Best Marks with AI Grader
Need help grading? Try our AI Grader for instant feedback on your assignments.
Primary sources : In primary source the data are collected for the first time by the user.
The primary data can be collected by the organization in different ways like the survey,
interviews, self observation, field observation and experiments (Data Types and Sources, 2019).
They are also collected by the sampling techniques. The collection of primary data is quite
expensive and time-consuming for the user or the organization because the data are collected by
the first hand.
Secondary source : The secondary source of data are already collect by the researcher in
their research. The organization uses the data which already collected by someone. The source of
collecting the secondary data are authorized web page, official publication, statistical boards,
financial balance sheet and the newspaper and journals. Secondary source of data are easily
available to the organization for their research and also they are less expensive than the primary
source of data.
3. Value of employing statistical methods in meeting business objective.
To meet the objective of the organization and achieving the competitive advantage the
statistical data provide huge help to the organization (Kwak, and Kim, 2017). The use of mean,
median and mode in the data analyses help to simplify the data and provide the information in a
better way so the user can easily understand the meaning of the data. Tesco use the statistical
data to present their information by different method to provide the accurate information to the
users.
There are 2 kind of statistical method descriptive and inferential method. Descriptive
method are used to summarize the result of the data by mean, mode, media, range etc. It helps to
analyse the business activities and improve the performance to achieve the objectives of the
organization. The large number of the data are present in the form of the ratio and percentage, so
they can easily manage and understood by the users.
In inferential method Tesco use the statistical data to draw the conclusion on the limited
data. In inferential method Tesco use t eh sampling, probability and models to draw the result.
They use the sampling method in researching the marketing activities to get the consumer
preferences and opinion about the particular product and services (Park, and et.al., 2019). It helps
them to know the consumer taste and change the product according to the customer demand to
get the more customer and increase their sales. It also provides the information about their
3
competitors product and services and their cost and lower the price of Tesco product and services
to get the competitive advantage.
4. Analysis of deductive and inductive approach and their implication.
Inductive approach : In inductive approach researcher firstly collect the data which are
relevant to the topic of the business organization and then researcher look the pattern of data
collection and gather all the related information to the research. In inductive approach researcher
move from bottom to general. For example Tesco want to research the buying behavior of their
customer. To research the topic the collect the data from the different stores about the taste and
preference of the customer. After collecting the data they evaluate the buying pattern of the
customer and on this pattern they develop theory and improve their performance by introducing
new product in the market to fulfill the customer demand and attract them toward the
organization (Gottfredson, and Aguinis, 2017).
Deductive approach : In deductive approach they reverse the whole process of inductive
approach. They start with the theory and test the implication of the theory with the data. It is a
top down approach. In deductive approach the researcher use the study of the other researcher
what they did in their study and on the basis of their study they make conclusion and finalize
their research. The aim of deductive approach is to test the theory. It was commonly associated
with the qualitative data. It is based on the facts, truth and rules. It is based on the fundamental
law that the result of X is affected by the Y. In deductive approach the researcher take the theory
and generate the hypothesis, on the basis of hypothesis they test the result and record the
different observation from testing the hypothesis.
Implication of deductive and inductive approach on business intelligence
Inductive and deductive approach provide the basic tools for analyzing the data and
present actionable information to help the organization. Tesco use the business intelligence
technique to analyze their data and make the conclusion (Inductive Approach (Inductive
Reasoning), 2019). Through these approach they can simplify the data and analyze them in better
way. It gives the way to the business to improve their performance and profitability.
5. Providing example of analysis of the sample set of data that can be used by the organization.
Data analysis:
Data analysis refers to a method with the help of which a company can analyze the
overall data.
4
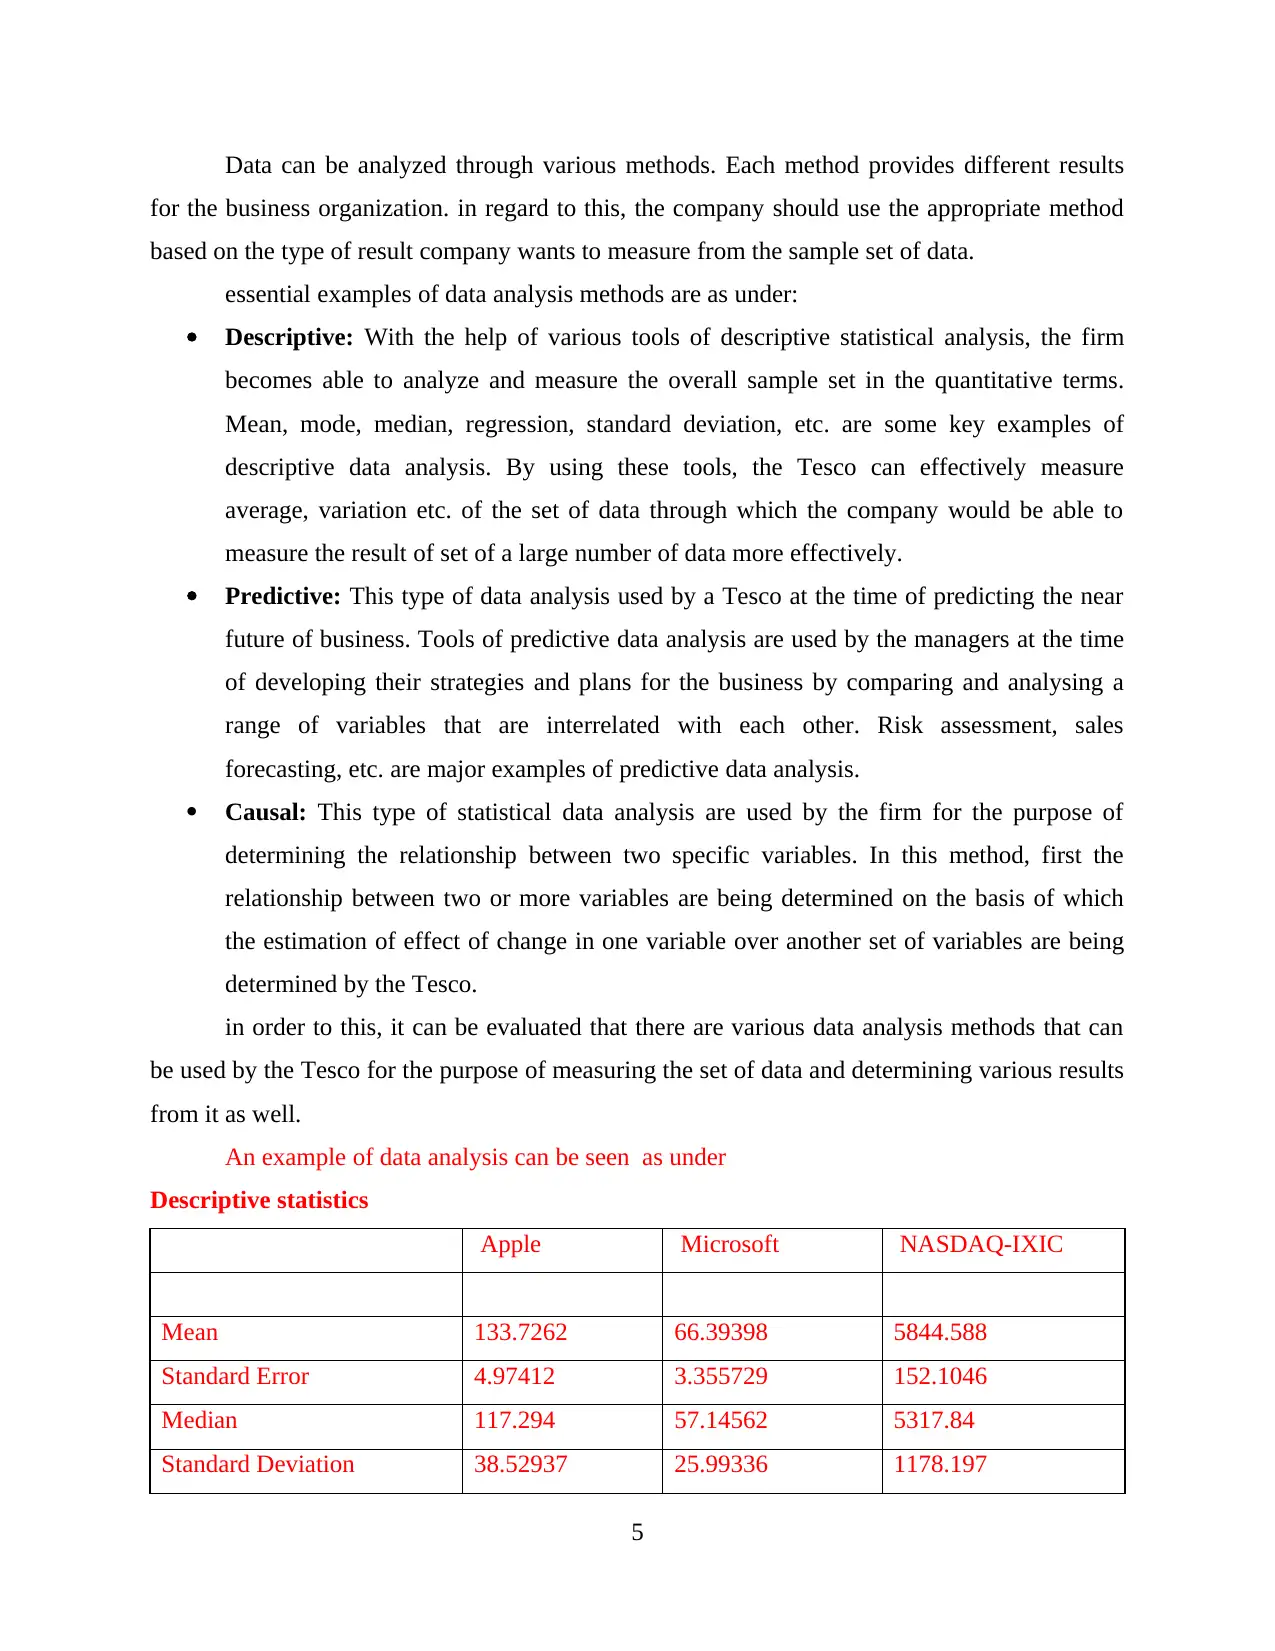
Data can be analyzed through various methods. Each method provides different results
for the business organization. in regard to this, the company should use the appropriate method
based on the type of result company wants to measure from the sample set of data.
essential examples of data analysis methods are as under:
Descriptive: With the help of various tools of descriptive statistical analysis, the firm
becomes able to analyze and measure the overall sample set in the quantitative terms.
Mean, mode, median, regression, standard deviation, etc. are some key examples of
descriptive data analysis. By using these tools, the Tesco can effectively measure
average, variation etc. of the set of data through which the company would be able to
measure the result of set of a large number of data more effectively.
Predictive: This type of data analysis used by a Tesco at the time of predicting the near
future of business. Tools of predictive data analysis are used by the managers at the time
of developing their strategies and plans for the business by comparing and analysing a
range of variables that are interrelated with each other. Risk assessment, sales
forecasting, etc. are major examples of predictive data analysis.
Causal: This type of statistical data analysis are used by the firm for the purpose of
determining the relationship between two specific variables. In this method, first the
relationship between two or more variables are being determined on the basis of which
the estimation of effect of change in one variable over another set of variables are being
determined by the Tesco.
in order to this, it can be evaluated that there are various data analysis methods that can
be used by the Tesco for the purpose of measuring the set of data and determining various results
from it as well.
An example of data analysis can be seen as under
Descriptive statistics
Apple Microsoft NASDAQ-IXIC
Mean 133.7262 66.39398 5844.588
Standard Error 4.97412 3.355729 152.1046
Median 117.294 57.14562 5317.84
Standard Deviation 38.52937 25.99336 1178.197
5
Paraphrase This Document
Need a fresh take? Get an instant paraphrase of this document with our AI Paraphraser

Sample Variance 1484.512 675.655 1388149
Kurtosis -0.53538 -0.89274 -1.24886
Skewness 0.681033 0.685136 0.478652
Range 145.1161 87.33971 3866.92
Minimum 79.96438 36.42029 4242.62
Maximum 225.0804 123.76 8109.54
Regression analysis
Regression Statistics
Multiple R 0.987766
R Square 0.975682
Adjusted R
Square 0.974829
Standard Error 186.9265
Observations 60
ANOVA
df SS MS F
Significance
F
Regression 2 79909128 39954564 1143.469 9.98E-47
Residual 57 1991667 34941.53
Total 59 81900796
Coefficients
Standard
Error t Stat P-value
Lower
95%
Upper
95%
Lower
95.0%
Upper
95.0%
Intercept 2316.523 98.47038 23.52508
4.95E-
31 2119.34 2513.707 2119.34 2513.707
Apple 14.22151 1.716248 8.286395
2.3E-
11 10.78478 17.65824 10.78478 17.65824
Microsoft 24.49432 2.543955 9.628438 1.48E- 19.40014 29.5885 19.40014 29.5885
6
13
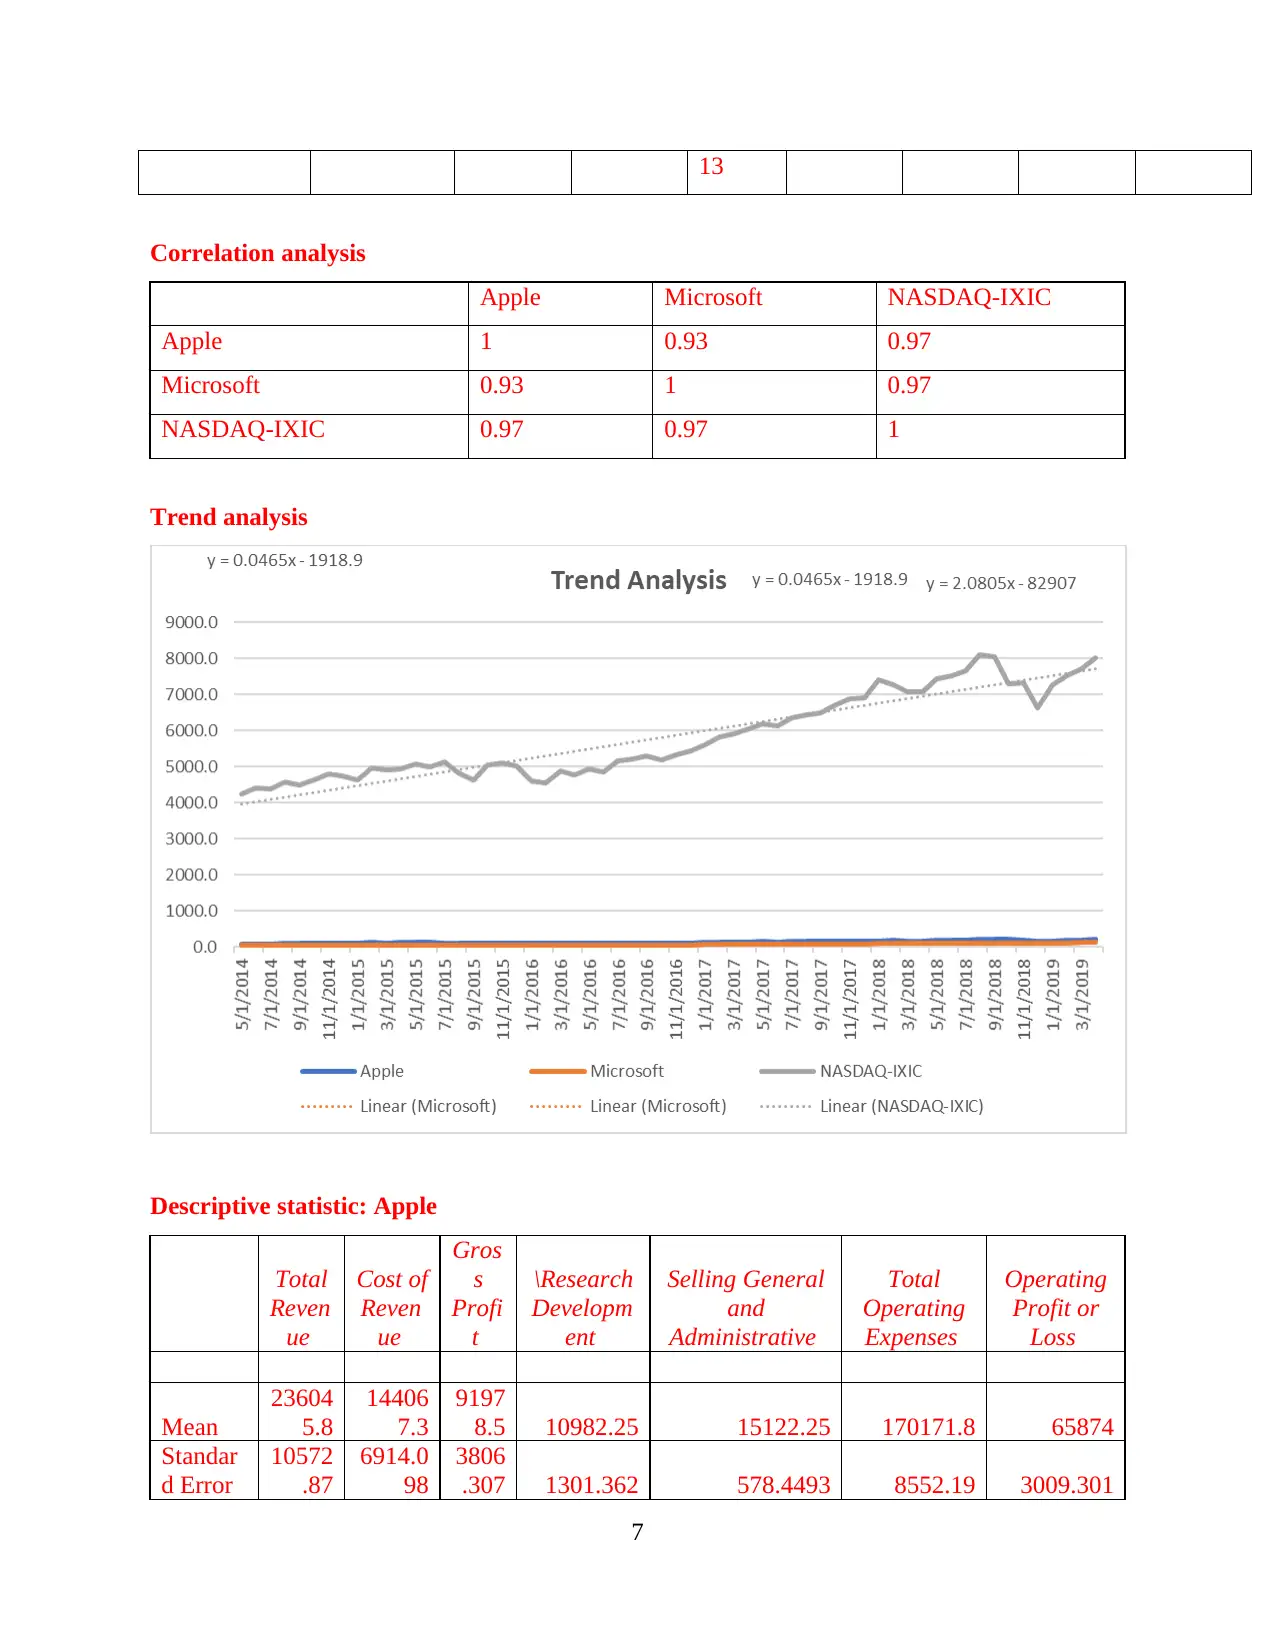
Correlation analysis
Apple Microsoft NASDAQ-IXIC
Apple 1 0.93 0.97
Microsoft 0.93 1 0.97
NASDAQ-IXIC 0.97 0.97 1
Trend analysis
Descriptive statistic: Apple
Total
Reven
ue
Cost of
Reven
ue
Gros
s
Profi
t
\Research
Developm
ent
Selling General
and
Administrative
Total
Operating
Expenses
Operating
Profit or
Loss
Mean
23604
5.8
14406
7.3
9197
8.5 10982.25 15122.25 170171.8 65874
Standar
d Error
10572
.87
6914.0
98
3806
.307 1301.362 578.4493 8552.19 3009.301
7
Median
23147
4.5
14056
8.5
9090
6 10813 14795 165187.5 66121
Standar
d
Deviati
on
21145
.73
13828.
2
7612
.615 2602.724 1156.899 17104.38 6018.602
Kurtosis
2.138
444
2.5944
36
-
0.38
72 -0.04663 0.296412 2.475435 -5.74604
Skewne
ss
1.196
833
1.3860
82
0.67
9049
0.342673 1.148981 1.49226 -0.03886
Range 49956 32380 1757
6
6169 2511 39082 11206
Minimu
m
21563
9
13137
6
8426
3
8067 14194 155615 60024
Maximu
m
26559
5
16375
6
1018
39
14236 16705 194697 71230
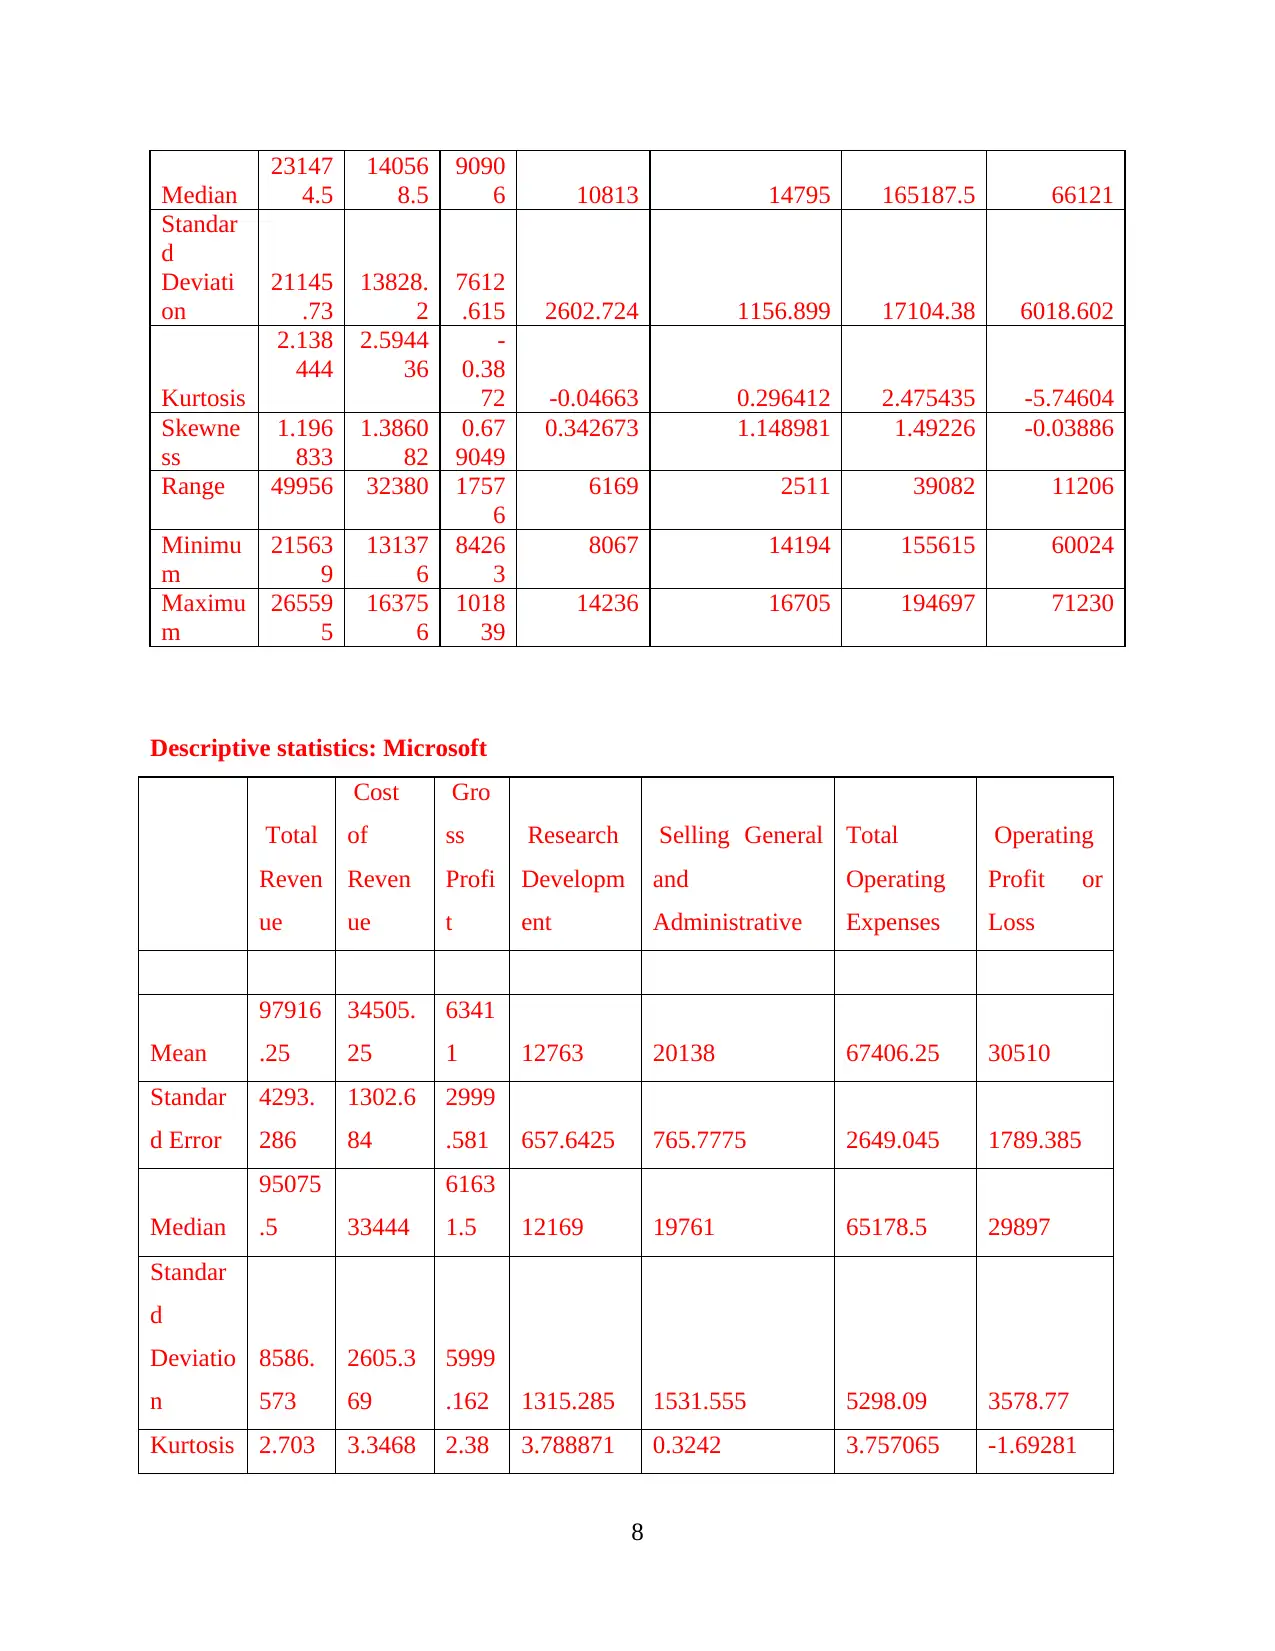
Descriptive statistics: Microsoft
Total
Reven
ue
Cost
of
Reven
ue
Gro
ss
Profi
t
Research
Developm
ent
Selling General
and
Administrative
Total
Operating
Expenses
Operating
Profit or
Loss
Mean
97916
.25
34505.
25
6341
1 12763 20138 67406.25 30510
Standar
d Error
4293.
286
1302.6
84
2999
.581 657.6425 765.7775 2649.045 1789.385
Median
95075
.5 33444
6163
1.5 12169 19761 65178.5 29897
Standar
d
Deviatio
n
8586.
573
2605.3
69
5999
.162 1315.285 1531.555 5298.09 3578.77
Kurtosis 2.703 3.3468 2.38 3.788871 0.3242 3.757065 -1.69281
8
23147
4.5
14056
8.5
9090
6 10813 14795 165187.5 66121
Standar
d
Deviati
on
21145
.73
13828.
2
7612
.615 2602.724 1156.899 17104.38 6018.602
Kurtosis
2.138
444
2.5944
36
-
0.38
72 -0.04663 0.296412 2.475435 -5.74604
Skewne
ss
1.196
833
1.3860
82
0.67
9049
0.342673 1.148981 1.49226 -0.03886
Range 49956 32380 1757
6
6169 2511 39082 11206
Minimu
m
21563
9
13137
6
8426
3
8067 14194 155615 60024
Maximu
m
26559
5
16375
6
1018
39
14236 16705 194697 71230
Descriptive statistics: Microsoft
Total
Reven
ue
Cost
of
Reven
ue
Gro
ss
Profi
t
Research
Developm
ent
Selling General
and
Administrative
Total
Operating
Expenses
Operating
Profit or
Loss
Mean
97916
.25
34505.
25
6341
1 12763 20138 67406.25 30510
Standar
d Error
4293.
286
1302.6
84
2999
.581 657.6425 765.7775 2649.045 1789.385
Median
95075
.5 33444
6163
1.5 12169 19761 65178.5 29897
Standar
d
Deviatio
n
8586.
573
2605.3
69
5999
.162 1315.285 1531.555 5298.09 3578.77
Kurtosis 2.703 3.3468 2.38 3.788871 0.3242 3.757065 -1.69281
8
Secure Best Marks with AI Grader
Need help grading? Try our AI Grader for instant feedback on your assignments.
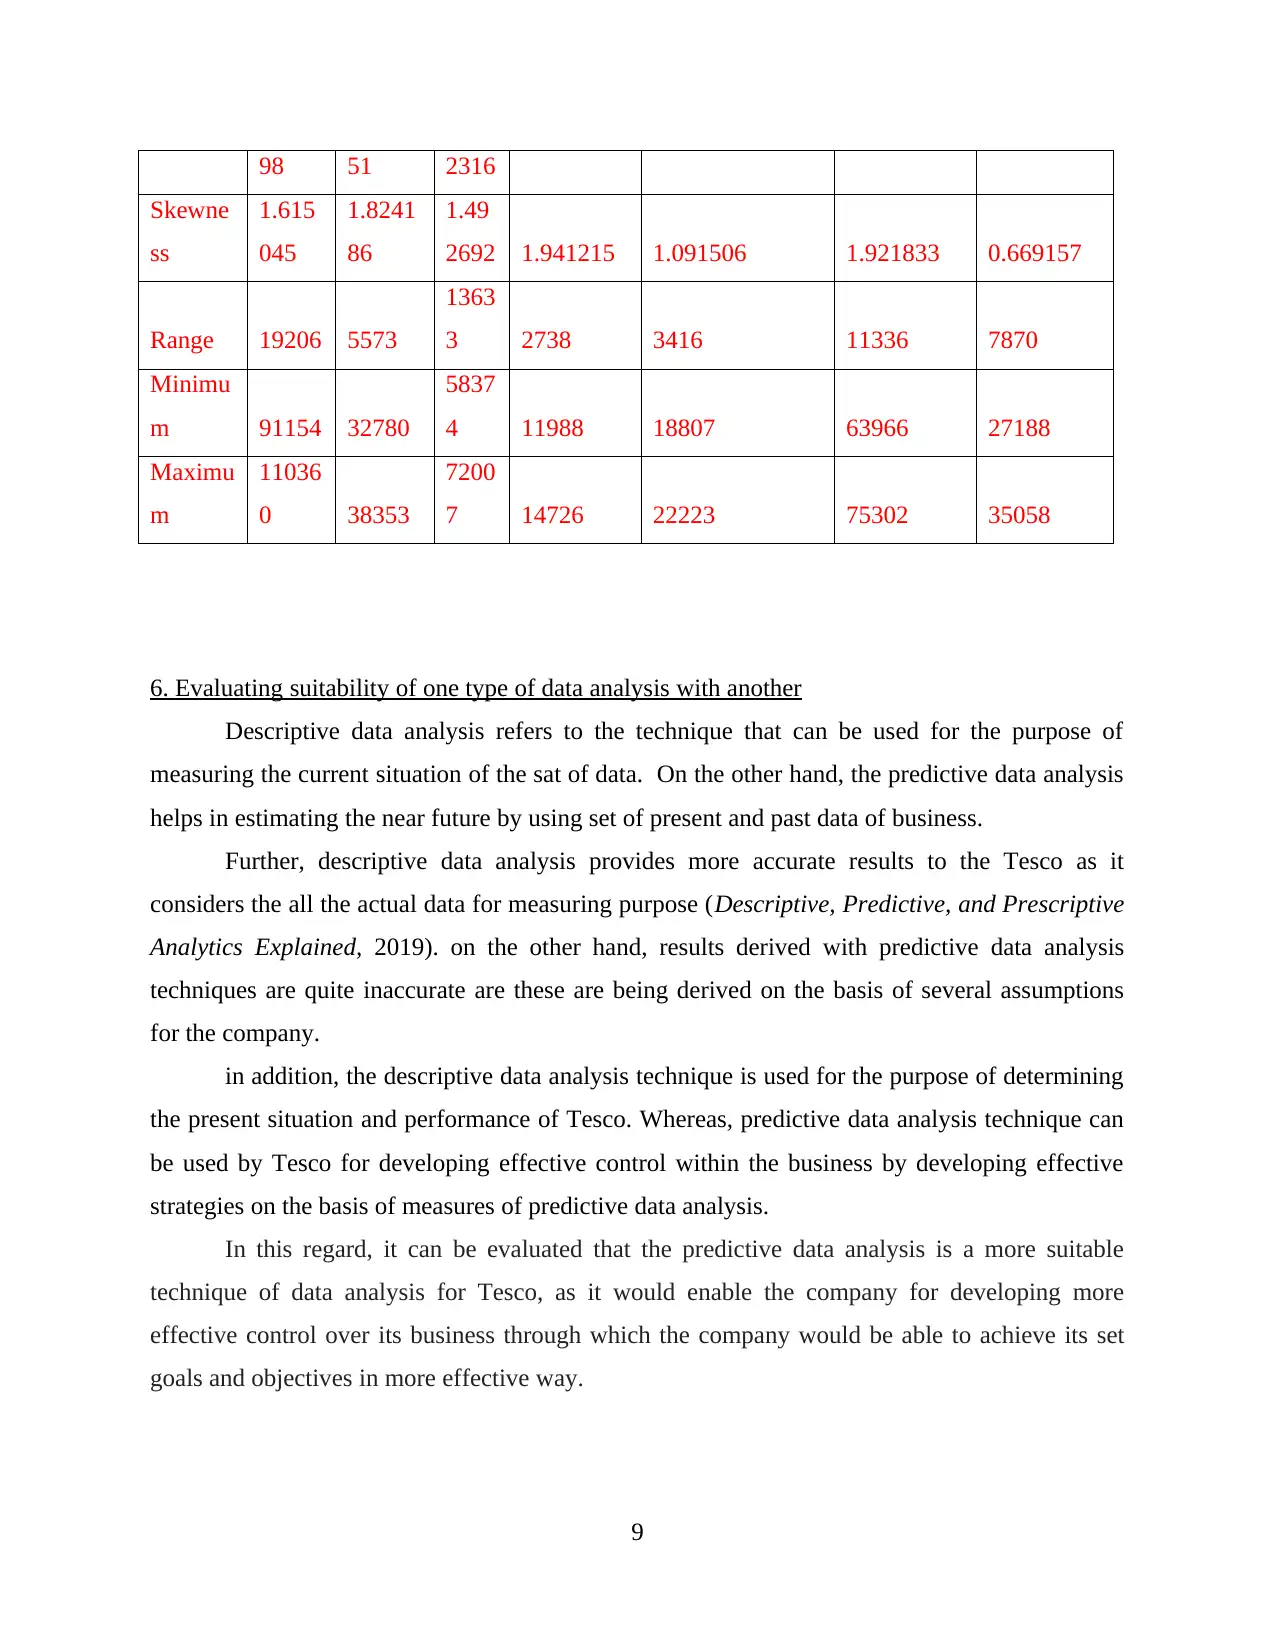
98 51 2316
Skewne
ss
1.615
045
1.8241
86
1.49
2692 1.941215 1.091506 1.921833 0.669157
Range 19206 5573
1363
3 2738 3416 11336 7870
Minimu
m 91154 32780
5837
4 11988 18807 63966 27188
Maximu
m
11036
0 38353
7200
7 14726 22223 75302 35058
6. Evaluating suitability of one type of data analysis with another
Descriptive data analysis refers to the technique that can be used for the purpose of
measuring the current situation of the sat of data. On the other hand, the predictive data analysis
helps in estimating the near future by using set of present and past data of business.
Further, descriptive data analysis provides more accurate results to the Tesco as it
considers the all the actual data for measuring purpose (Descriptive, Predictive, and Prescriptive
Analytics Explained, 2019). on the other hand, results derived with predictive data analysis
techniques are quite inaccurate are these are being derived on the basis of several assumptions
for the company.
in addition, the descriptive data analysis technique is used for the purpose of determining
the present situation and performance of Tesco. Whereas, predictive data analysis technique can
be used by Tesco for developing effective control within the business by developing effective
strategies on the basis of measures of predictive data analysis.
In this regard, it can be evaluated that the predictive data analysis is a more suitable
technique of data analysis for Tesco, as it would enable the company for developing more
effective control over its business through which the company would be able to achieve its set
goals and objectives in more effective way.
9
TASK 2
(Covered in PPT)
CONCLUSION
The report summarizes the meaning of statistical data in management and the different
features of the statistical data and their benefits in achieving the organizational objective. It
explains the different sources of the data like primary source and secondary source for analyzing
the data in the organization. It helps to understand the quantitative and qualitative data in
business and make conclusion on the basis of the data. It can be concluded from the study that
different statistical method are used for the meeting the organizational goal like descriptive and
inferential method. It also explains the use of deductive and inductive approach and their
implication in the business intelligence. The report summarizes the different ways to present the
data of the organization in graphs, histogram and trend forecasting.
10
REFERENCES
Books and journals
Amrhein, V., Trafimow, D. and Greenland, S., 2018. Inferential Statistics as Descriptive
Statistics: There is No Replication Crisis if We Don’t Expect Replication. The American
Statistician.
Connelly, R., and et.al., 2016. The role of administrative data in the big data revolution in social
science research. Social Science Research, 59. pp.1-12.
Croce, F., Savo, D.F. and Lenzerini, M., 2018. On the Experimental Usage of Ontology-based
Data Management for the Italian Integrated System of Statistical Registers: Quality
Issues.
Eisenhardt, K.M., Graebner, M.E. and Sonenshein, S., 2016. Grand challenges and inductive
methods: Rigor without rigor mortis.
Gandomi, A. and Haider, M., 2015. Beyond the hype: Big data concepts, methods, and
analytics. International journal of information management, 35(2). pp.137-144.
Gottfredson, R.K. and Aguinis, H., 2017. Leadership behaviors and follower performance:
Deductive and inductive examination of theoretical rationales and underlying
mechanisms. Journal of Organizational Behavior, 38(4). pp.558-591.
Kwak, S.K. and Kim, J.H., 2017. Statistical data preparation: management of missing values and
outliers. Korean journal of anesthesiology, 70(4). p.407.
McCuen, R.H., 2016. Modeling hydrologic change: statistical methods. CRC press.
Park, and et.al., 2019. Causal Mediation Analysis Leveraging Multiple Types of Summary
Statistics Data. arXiv preprint arXiv:1901.08540.
Rees, D.G., 2018. Essential statistics. Chapman and Hall/CRC.
Simonsohn, U., Simmons, J.P. and Nelson, L.D., 2015. Specification curve: Descriptive and
inferential statistics on all reasonable specifications.
Wang, Y., Hand Held Products Inc, 2016. System and method to automatically discriminate
between different data types. U.S. Patent 9,317,763.
Online
Inductive Approach (Inductive Reasoning). 2019. [Online]. Available through <https://research-
methodology.net/research-methodology/research-approach/inductive-ap>
11
Paraphrase This Document
Need a fresh take? Get an instant paraphrase of this document with our AI Paraphraser

Data Types and Sources. 2019. [Online]. Available through
<https://fhssrsc.byu.edu/Pages/Data.aspx>
Descriptive, Predictive, and Prescriptive Analytics Explained. 2019. [Online]. Available through
: <https://halobi.com/blog/descriptive-predictive-and-prescriptive-analytics-explained/>
12
<https://fhssrsc.byu.edu/Pages/Data.aspx>
Descriptive, Predictive, and Prescriptive Analytics Explained. 2019. [Online]. Available through
: <https://halobi.com/blog/descriptive-predictive-and-prescriptive-analytics-explained/>
12
1 out of 14
Related Documents


Your All-in-One AI-Powered Toolkit for Academic Success.
+13062052269
info@desklib.com
Available 24*7 on WhatsApp / Email
![[object Object]](/_next/static/media/star-bottom.7253800d.svg)
Unlock your academic potential
© 2024 | Zucol Services PVT LTD | All rights reserved.