Statistics for Management: Business Process Analysis Report
VerifiedAdded on 2021/01/01
|18
|3743
|496
Report
AI Summary
This report provides a comprehensive overview of statistics for management, focusing on the analysis of business decisions and operational management using statistical methods. It defines business processes and economic data from various sources, including CPI, CPIH, and RPI, and explores the differences between these indices. The report delves into descriptive, exploratory, and confirmatory analysis, providing examples to illustrate each method. It examines the importance of the inflation rate, presenting data analysis using the consumer price index and discussing its significance in economic evaluation. Furthermore, the report includes practical examples, such as analyzing hot drink sales based on temperature using scatter diagrams and correlation coefficients. The report also evaluates qualitative and quantitative data, and concludes with recommendations and justifications, supported by graphical and tabular representations for effective understanding. The report is designed to assist in business planning and capacity management.

Statistics for Management
Paraphrase This Document
Need a fresh take? Get an instant paraphrase of this document with our AI Paraphraser
Table of Contents
INTRODUCTION...........................................................................................................................1
ACTIVITY 1....................................................................................................................................1
P1 Process and nature of business and economic data with different published sources............1
P2 Data form variety of sources using various methods of analysis...........................................5
M1 Analysis of price indices other than Office of National Statistics........................................7
D1 Difference between the descriptive, Exploratory and confirmatory analysis with examples 7
ACTIVITY 2....................................................................................................................................8
P3 Evaluation of qualitative and quantitative data from a range of examples and appropriate
statistical methods........................................................................................................................8
M2 Assessment of different statistical application....................................................................11
ACTIVITY 3..................................................................................................................................11
P4 Statistical methods used in business planning, inventory management and capacity
management...............................................................................................................................11
M3 Justification and use of statistical methods.........................................................................12
D2 Explanation and recommendation for activity 3..................................................................12
ACTIVITY 4..................................................................................................................................12
P5 Use of adequate charts and tables to execute the findings for a various variables...............12
M4 Graphical representation assessed in activity one and second............................................15
D3 Use of tables and graphical representations in activity 1 and 2...........................................15
CONCLUSION..............................................................................................................................15
REFRENCES.................................................................................................................................17
INTRODUCTION
Statistics for management stands for analysis of business decisions and operational
management with statistical evaluation tools and methods (Zhou and Luo, 2015). This report
defines the business process and nature with economical data form various published sources.
Various data are used with different methods of analysis. Difference between descriptive,
exploratory and conformity analysis given with suitable examples. Evaluation of difference
between analytical methods used for elaboration. Statistical methods used in business planning
and capacity management are with practical based examples. Justifications and recommendations
are also provided with particular section. Information and data are being presented in graphical
and tabular form for effective elaboration and conductive approach.
ACTIVITY 1
P1 Process and nature of business and economic data with different published sources
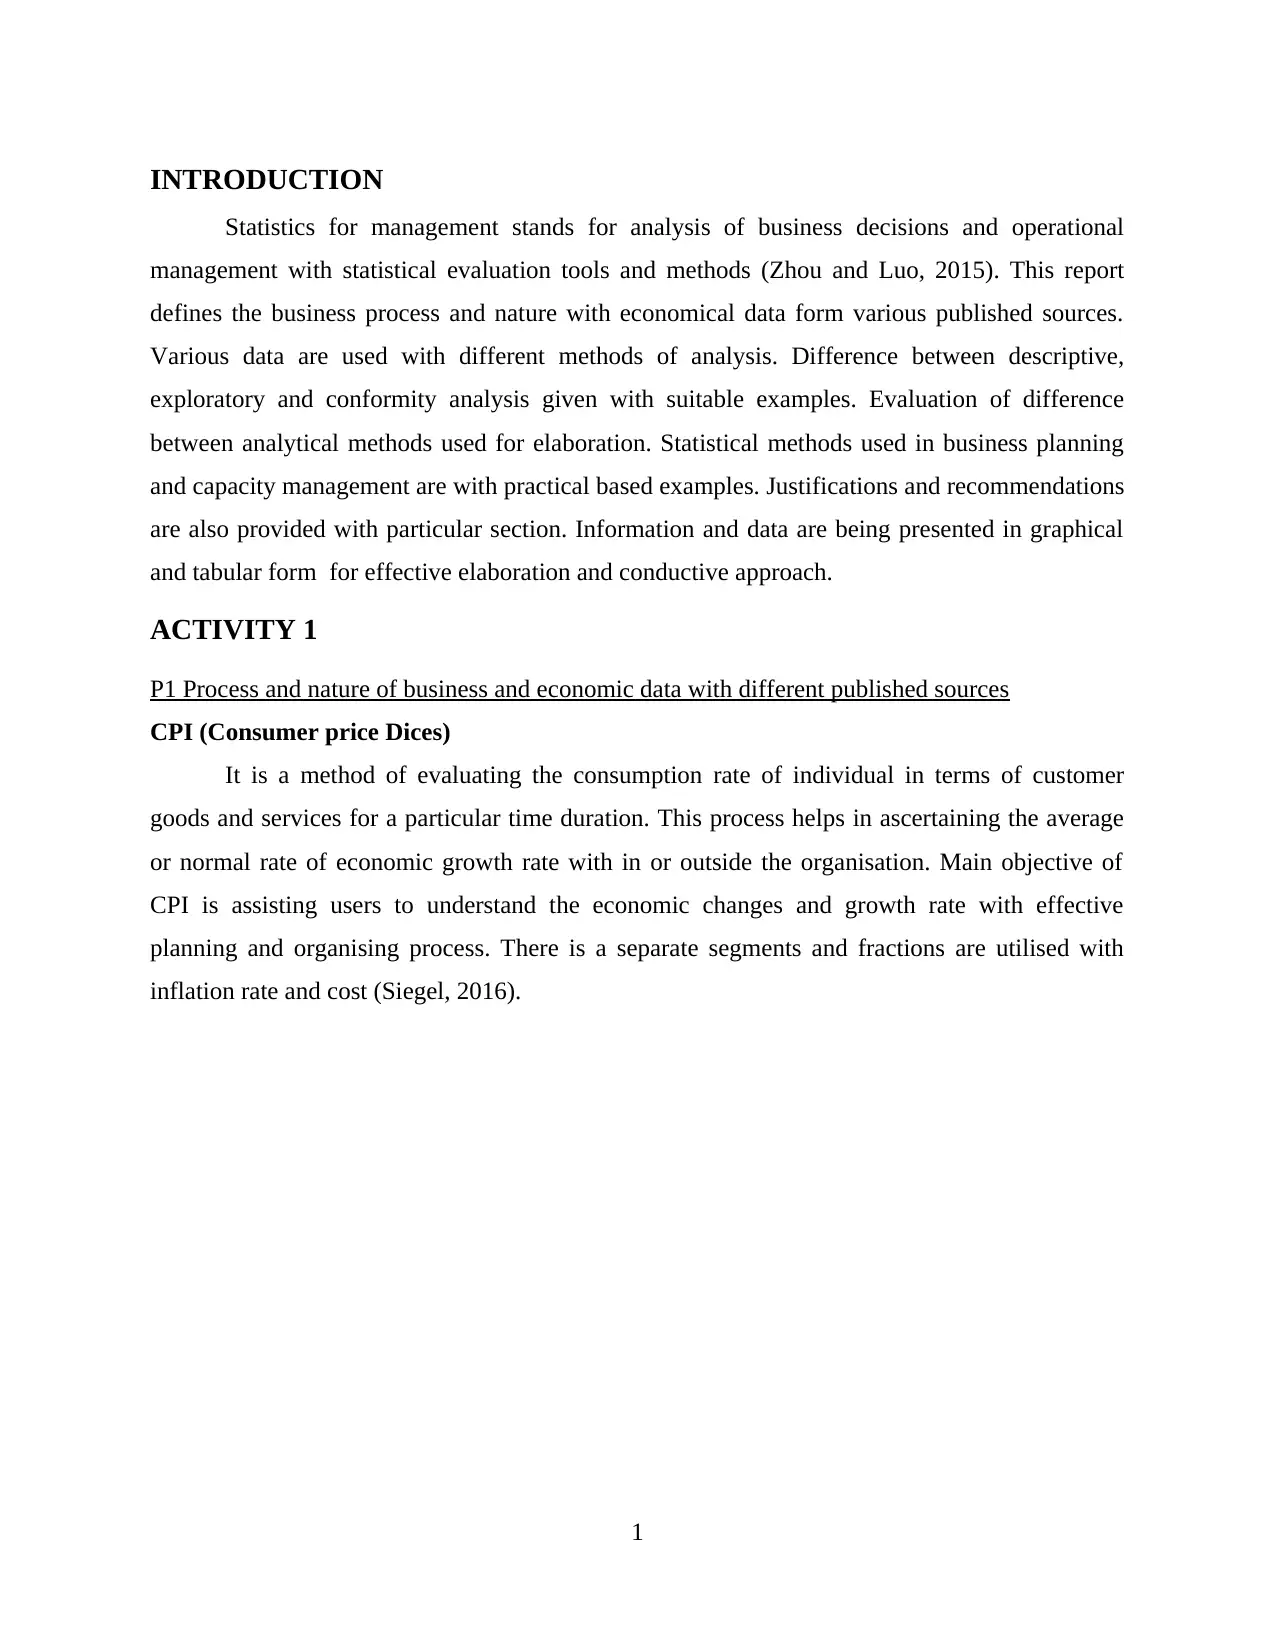
CPI (Consumer price Dices)
It is a method of evaluating the consumption rate of individual in terms of customer
goods and services for a particular time duration. This process helps in ascertaining the average
or normal rate of economic growth rate with in or outside the organisation. Main objective of
CPI is assisting users to understand the economic changes and growth rate with effective
planning and organising process. There is a separate segments and fractions are utilised with
inflation rate and cost (Siegel, 2016).
1
Statistics for management stands for analysis of business decisions and operational
management with statistical evaluation tools and methods (Zhou and Luo, 2015). This report
defines the business process and nature with economical data form various published sources.
Various data are used with different methods of analysis. Difference between descriptive,
exploratory and conformity analysis given with suitable examples. Evaluation of difference
between analytical methods used for elaboration. Statistical methods used in business planning
and capacity management are with practical based examples. Justifications and recommendations
are also provided with particular section. Information and data are being presented in graphical
and tabular form for effective elaboration and conductive approach.
ACTIVITY 1
P1 Process and nature of business and economic data with different published sources
CPI (Consumer price Dices)
It is a method of evaluating the consumption rate of individual in terms of customer
goods and services for a particular time duration. This process helps in ascertaining the average
or normal rate of economic growth rate with in or outside the organisation. Main objective of
CPI is assisting users to understand the economic changes and growth rate with effective
planning and organising process. There is a separate segments and fractions are utilised with
inflation rate and cost (Siegel, 2016).
1
⊘ This is a preview!⊘
Do you want full access?
Subscribe today to unlock all pages.
Trusted by 1+ million students worldwide
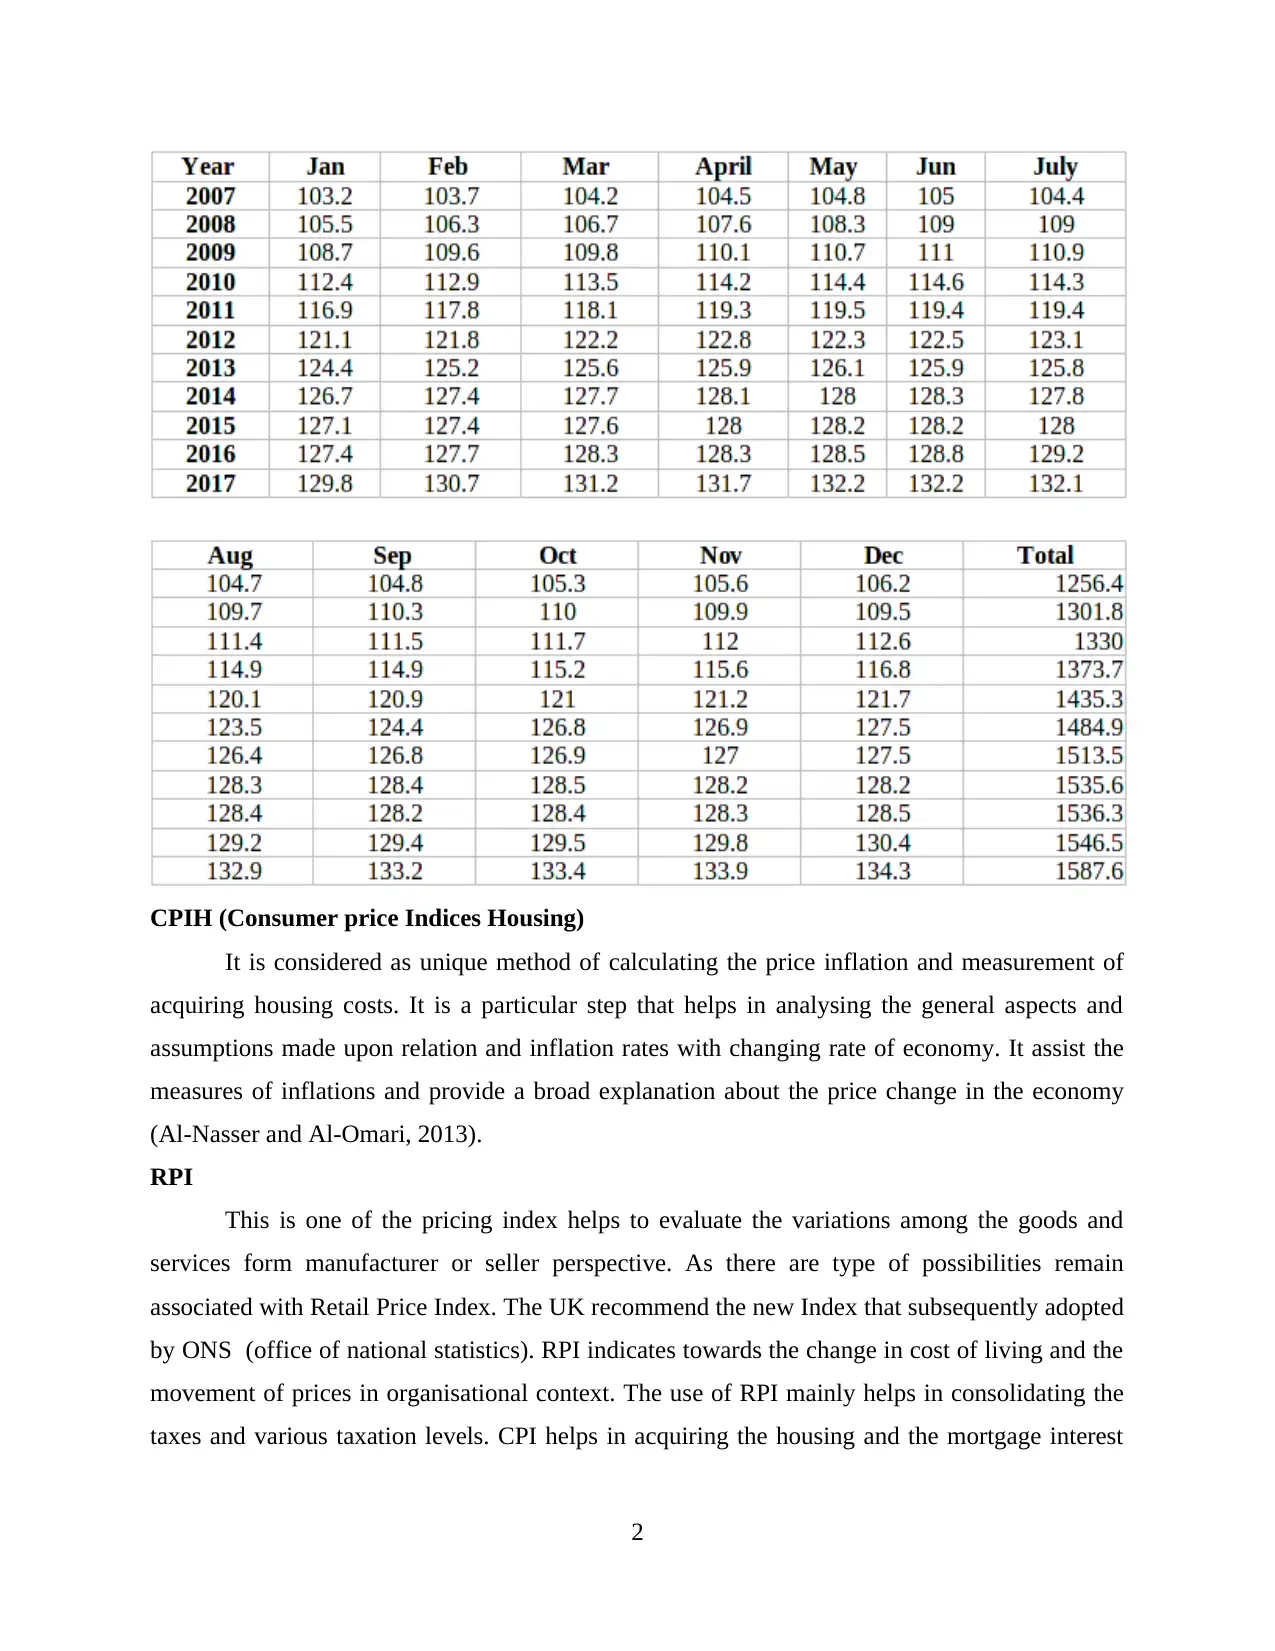
CPIH (Consumer price Indices Housing)
It is considered as unique method of calculating the price inflation and measurement of
acquiring housing costs. It is a particular step that helps in analysing the general aspects and
assumptions made upon relation and inflation rates with changing rate of economy. It assist the
measures of inflations and provide a broad explanation about the price change in the economy
(Al-Nasser and Al-Omari, 2013).
RPI
This is one of the pricing index helps to evaluate the variations among the goods and
services form manufacturer or seller perspective. As there are type of possibilities remain
associated with Retail Price Index. The UK recommend the new Index that subsequently adopted
by ONS (office of national statistics). RPI indicates towards the change in cost of living and the
movement of prices in organisational context. The use of RPI mainly helps in consolidating the
taxes and various taxation levels. CPI helps in acquiring the housing and the mortgage interest
2
Paraphrase This Document
Need a fresh take? Get an instant paraphrase of this document with our AI Paraphraser
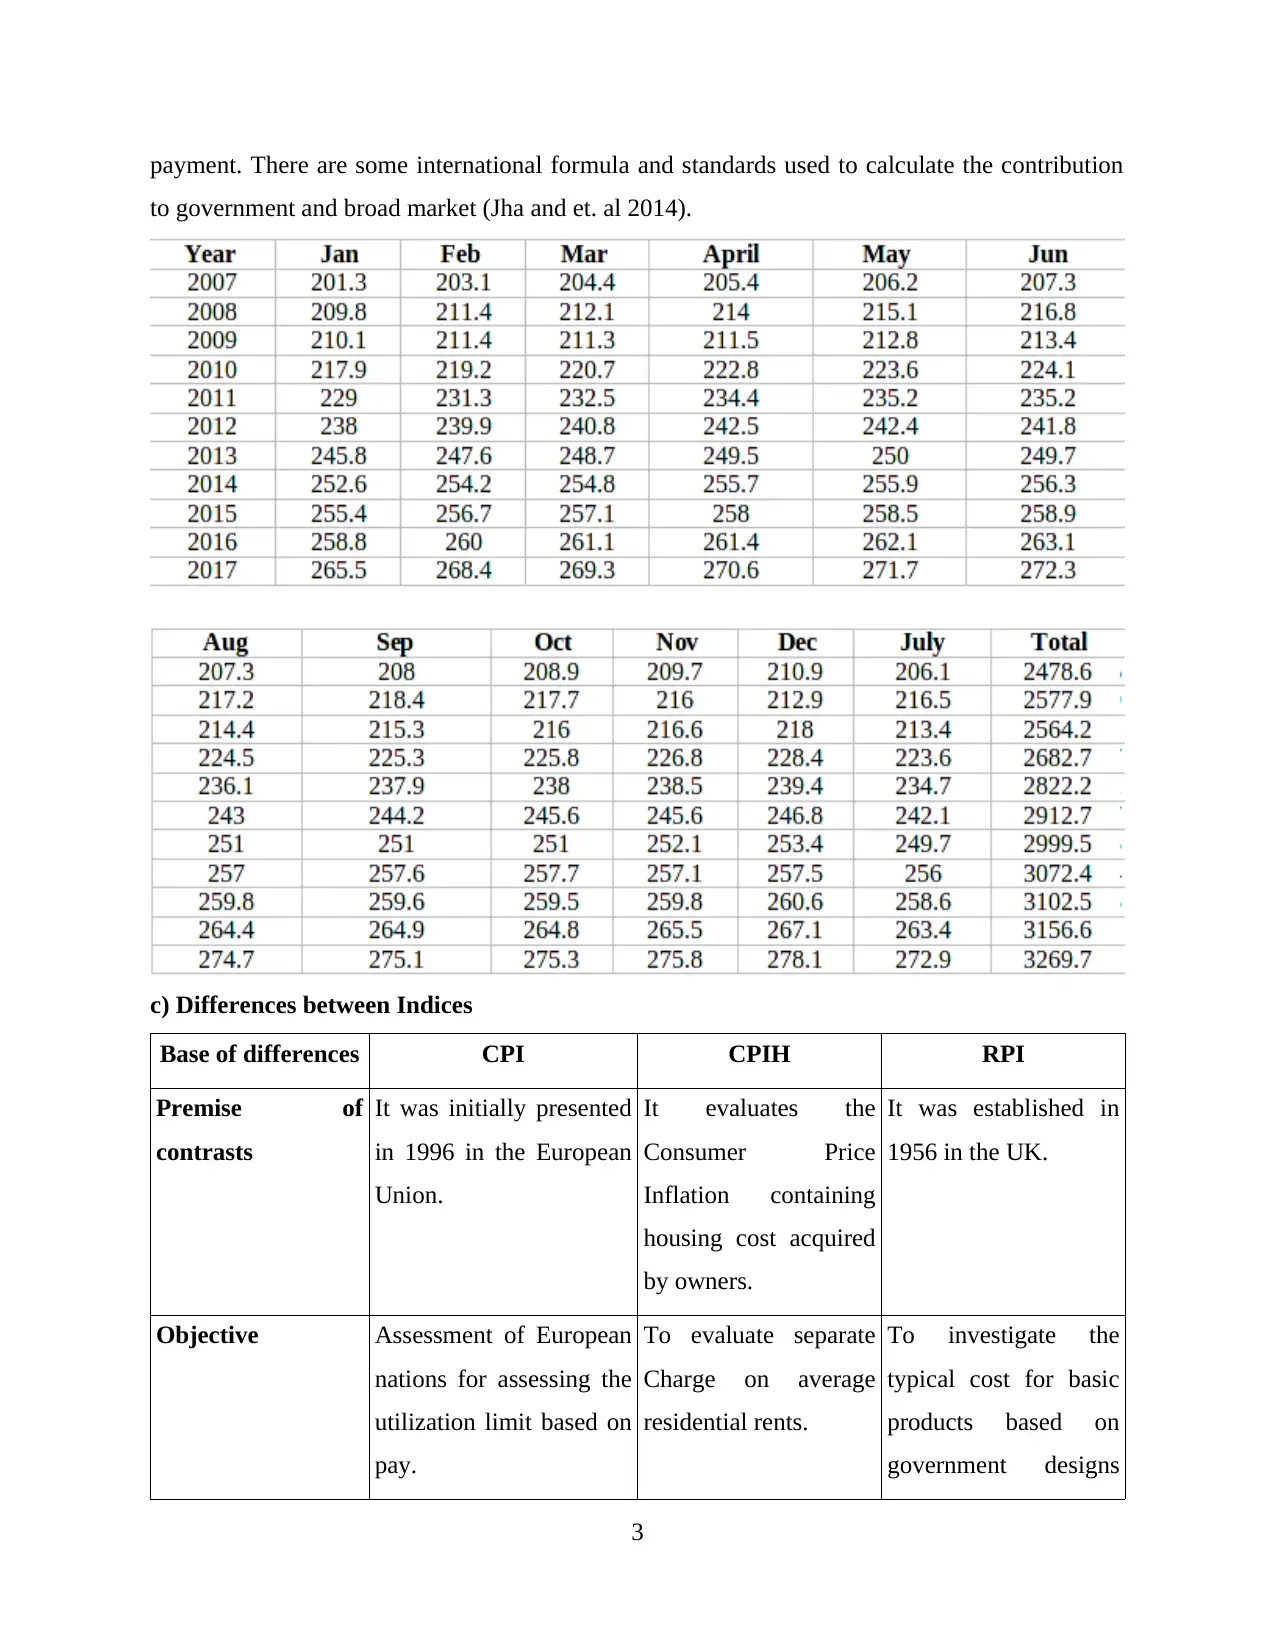
payment. There are some international formula and standards used to calculate the contribution
to government and broad market (Jha and et. al 2014).
c) Differences between Indices
Base of differences CPI CPIH RPI
Premise of
contrasts
It was initially presented
in 1996 in the European
Union.
It evaluates the
Consumer Price
Inflation containing
housing cost acquired
by owners.
It was established in
1956 in the UK.
Objective Assessment of European
nations for assessing the
utilization limit based on
pay.
To evaluate separate
Charge on average
residential rents.
To investigate the
typical cost for basic
products based on
government designs
3
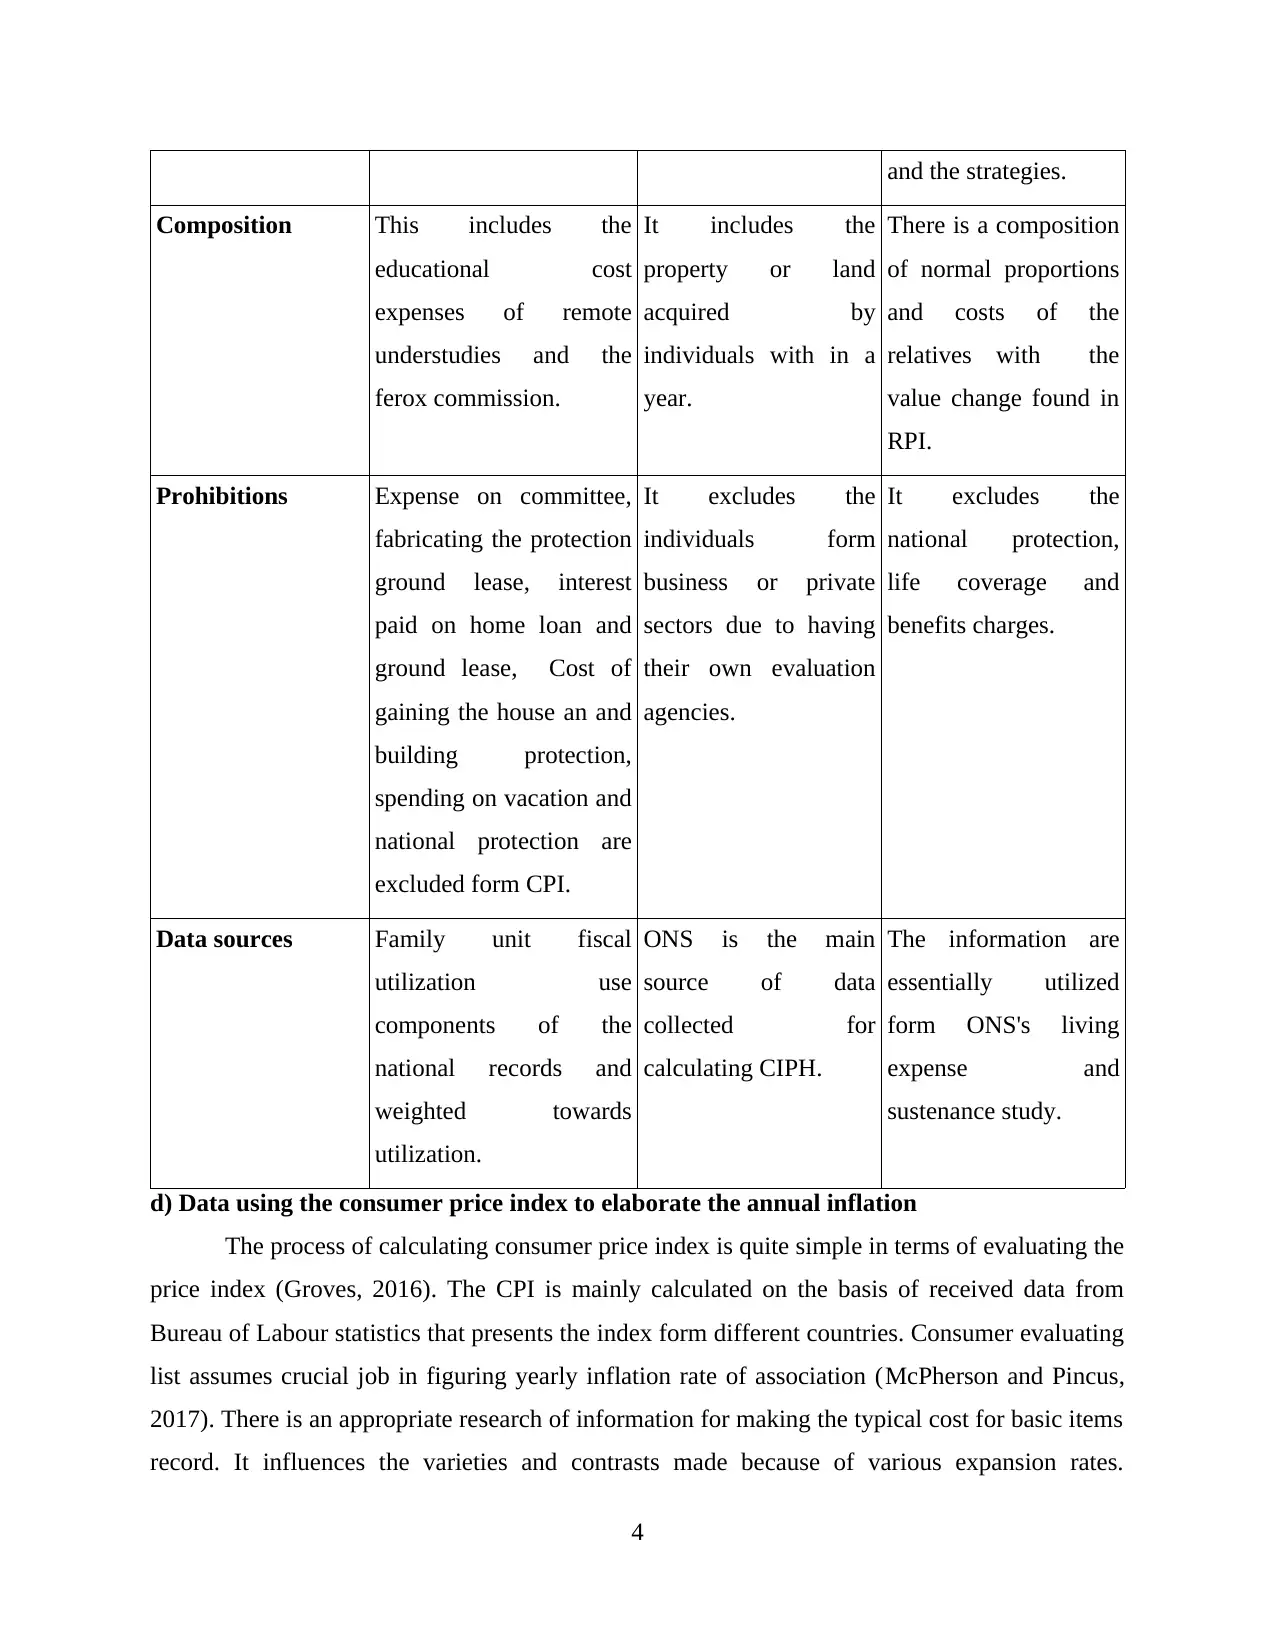
and the strategies.
Composition This includes the
educational cost
expenses of remote
understudies and the
ferox commission.
It includes the
property or land
acquired by
individuals with in a
year.
There is a composition
of normal proportions
and costs of the
relatives with the
value change found in
RPI.
Prohibitions Expense on committee,
fabricating the protection
ground lease, interest
paid on home loan and
ground lease, Cost of
gaining the house an and
building protection,
spending on vacation and
national protection are
excluded form CPI.
It excludes the
individuals form
business or private
sectors due to having
their own evaluation
agencies.
It excludes the
national protection,
life coverage and
benefits charges.
Data sources Family unit fiscal
utilization use
components of the
national records and
weighted towards
utilization.
ONS is the main
source of data
collected for
calculating CIPH.
The information are
essentially utilized
form ONS's living
expense and
sustenance study.
d) Data using the consumer price index to elaborate the annual inflation
The process of calculating consumer price index is quite simple in terms of evaluating the
price index (Groves, 2016). The CPI is mainly calculated on the basis of received data from
Bureau of Labour statistics that presents the index form different countries. Consumer evaluating
list assumes crucial job in figuring yearly inflation rate of association (McPherson and Pincus,
2017). There is an appropriate research of information for making the typical cost for basic items
record. It influences the varieties and contrasts made because of various expansion rates.
4
⊘ This is a preview!⊘
Do you want full access?
Subscribe today to unlock all pages.
Trusted by 1+ million students worldwide
Different components stay in charge of figuring the yearly expansion rate and the shopper value
record. CPI is a list that assistance in combining the gatherings with making the departmental
changes with somewhat reason. Information shape Bureau of Labour insights (BLS) gives the
information identified with yearly spending by the client for a specific duration. There are eight
essential areas are investigated for deciding the cost raised because of expense of inflation and
the vitality costs. For deciding the yearly inflation rate it is required to have the information
related utilization for a specific time length. It not just decides the concentrated financial rate yet
in addition breaks down the government use to dissect the financial management for alteration
and sustaining the inflation rate.
e) Reasons why inflation rate is essential to analyse
Inflation rate is an important element to analyse the growth rate and execution of view
point of issues form base level. GDP is the main part of economy of an country. It shows that
how much consumption increased or decreased for a specific time span with in a country is
analysed on the basis of consumption (Melnykov, 2013). Consumer Price Index presents the
fluctuations among the consumption levels and helps in collecting the comprehensive income
and variations in growth rate. Inflation rate is the only source that clarify the scenarios and the
variations among the decisions and changes. The activities and the practices helps in analysing
the debates with related to various sources. For analysing the accurate economical condition it is
required to calculate the inflation rate. It is not only limited up to evaluating the growth rate of
economy but also helps to analyse fragmented information like employment, job opportunities,
production and service levels.
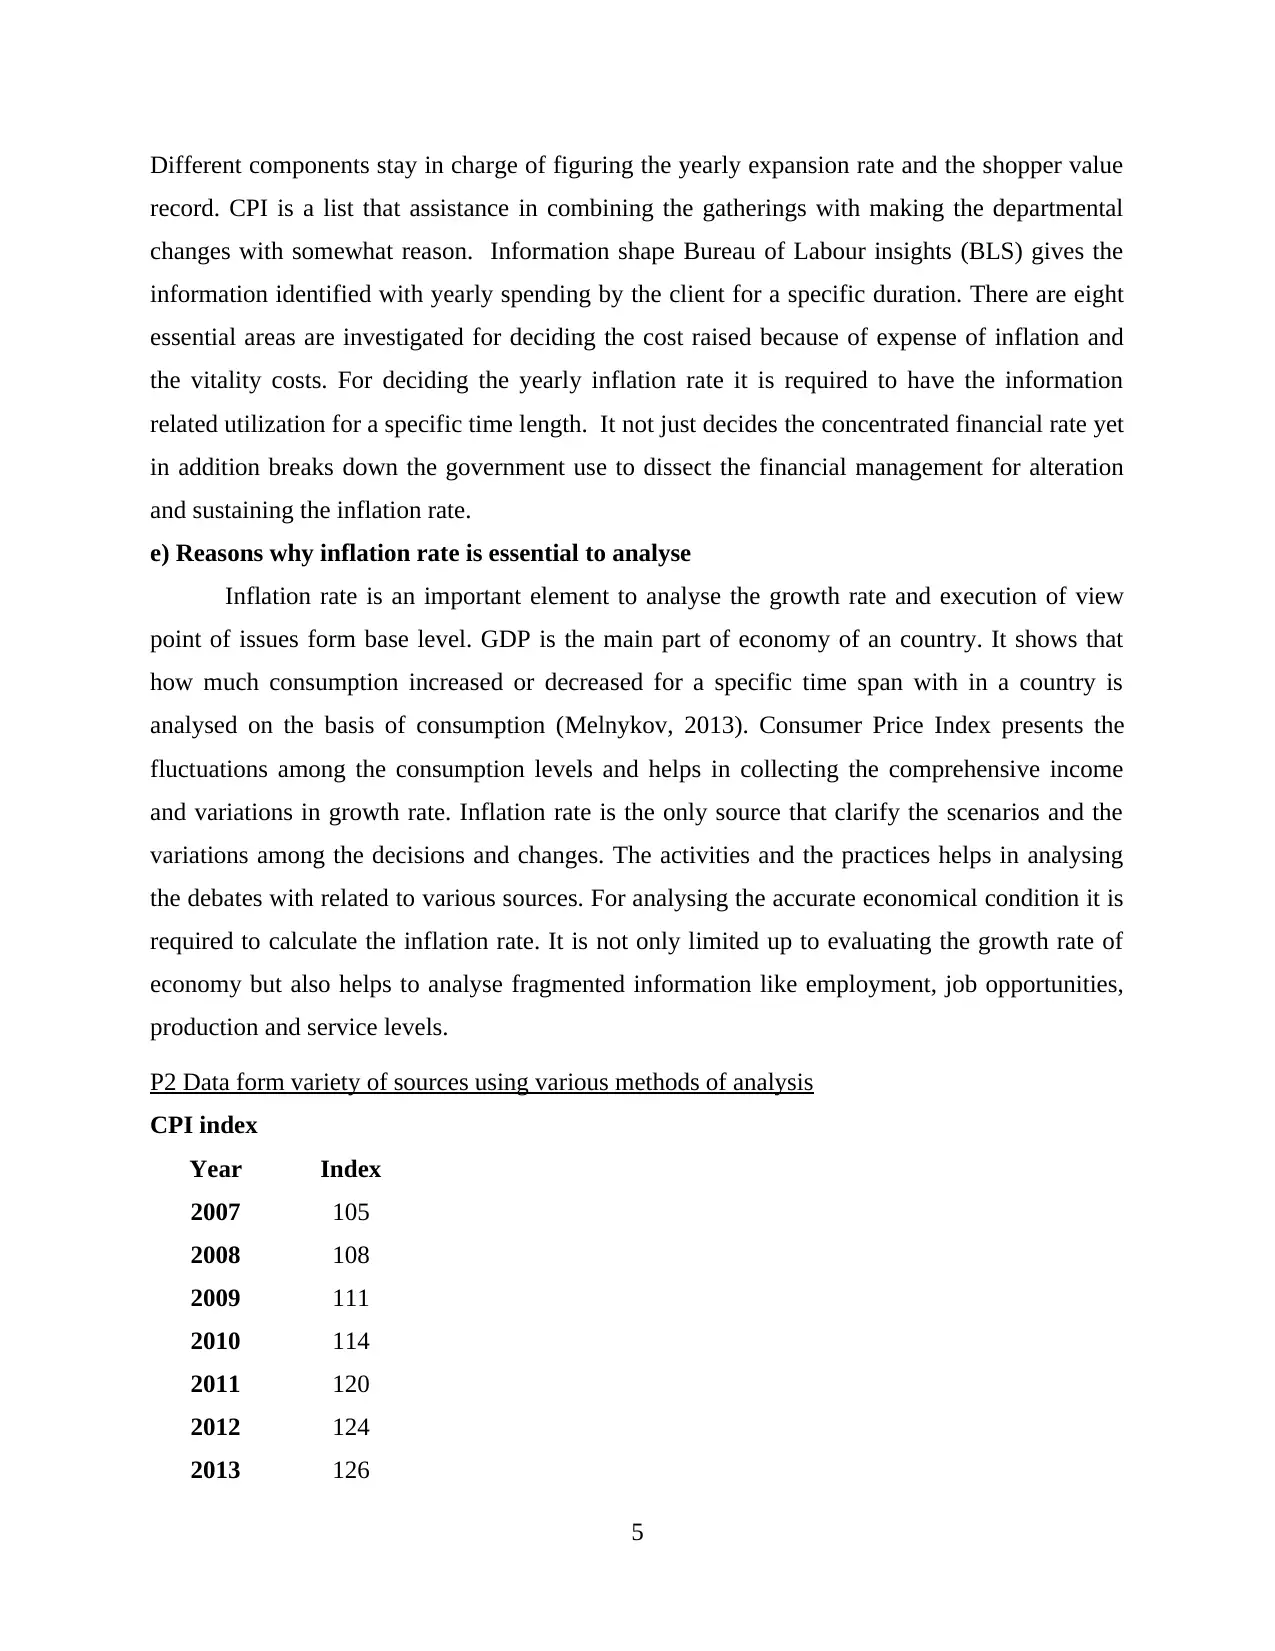
P2 Data form variety of sources using various methods of analysis
CPI index
Year Index
2007 105
2008 108
2009 111
2010 114
2011 120
2012 124
2013 126
5
record. CPI is a list that assistance in combining the gatherings with making the departmental
changes with somewhat reason. Information shape Bureau of Labour insights (BLS) gives the
information identified with yearly spending by the client for a specific duration. There are eight
essential areas are investigated for deciding the cost raised because of expense of inflation and
the vitality costs. For deciding the yearly inflation rate it is required to have the information
related utilization for a specific time length. It not just decides the concentrated financial rate yet
in addition breaks down the government use to dissect the financial management for alteration
and sustaining the inflation rate.
e) Reasons why inflation rate is essential to analyse
Inflation rate is an important element to analyse the growth rate and execution of view
point of issues form base level. GDP is the main part of economy of an country. It shows that
how much consumption increased or decreased for a specific time span with in a country is
analysed on the basis of consumption (Melnykov, 2013). Consumer Price Index presents the
fluctuations among the consumption levels and helps in collecting the comprehensive income
and variations in growth rate. Inflation rate is the only source that clarify the scenarios and the
variations among the decisions and changes. The activities and the practices helps in analysing
the debates with related to various sources. For analysing the accurate economical condition it is
required to calculate the inflation rate. It is not only limited up to evaluating the growth rate of
economy but also helps to analyse fragmented information like employment, job opportunities,
production and service levels.
P2 Data form variety of sources using various methods of analysis
CPI index
Year Index
2007 105
2008 108
2009 111
2010 114
2011 120
2012 124
2013 126
5
Paraphrase This Document
Need a fresh take? Get an instant paraphrase of this document with our AI Paraphraser
2014 128
2015 128
2016 129
2017 132
29/06/1905 01/07/1905 03/07/1905 05/07/1905 07/07/1905 09/07/1905
0
20
40
60
80
100
120
140
105 108 111 114 120 124 126 128 128 129 132
Index
According to the above mentioned graph of CPI shows the information of customer
Value Index formed between 2007 to 2017. there is a different varieties and checks are taken
Form Office of National Statistics. It is seen that cost record expanded consistently with the huge
rate of 3.5% (estimated). There is a scattered chart is displayed regarding characterizing the
plotted regions and change focuses underneath.
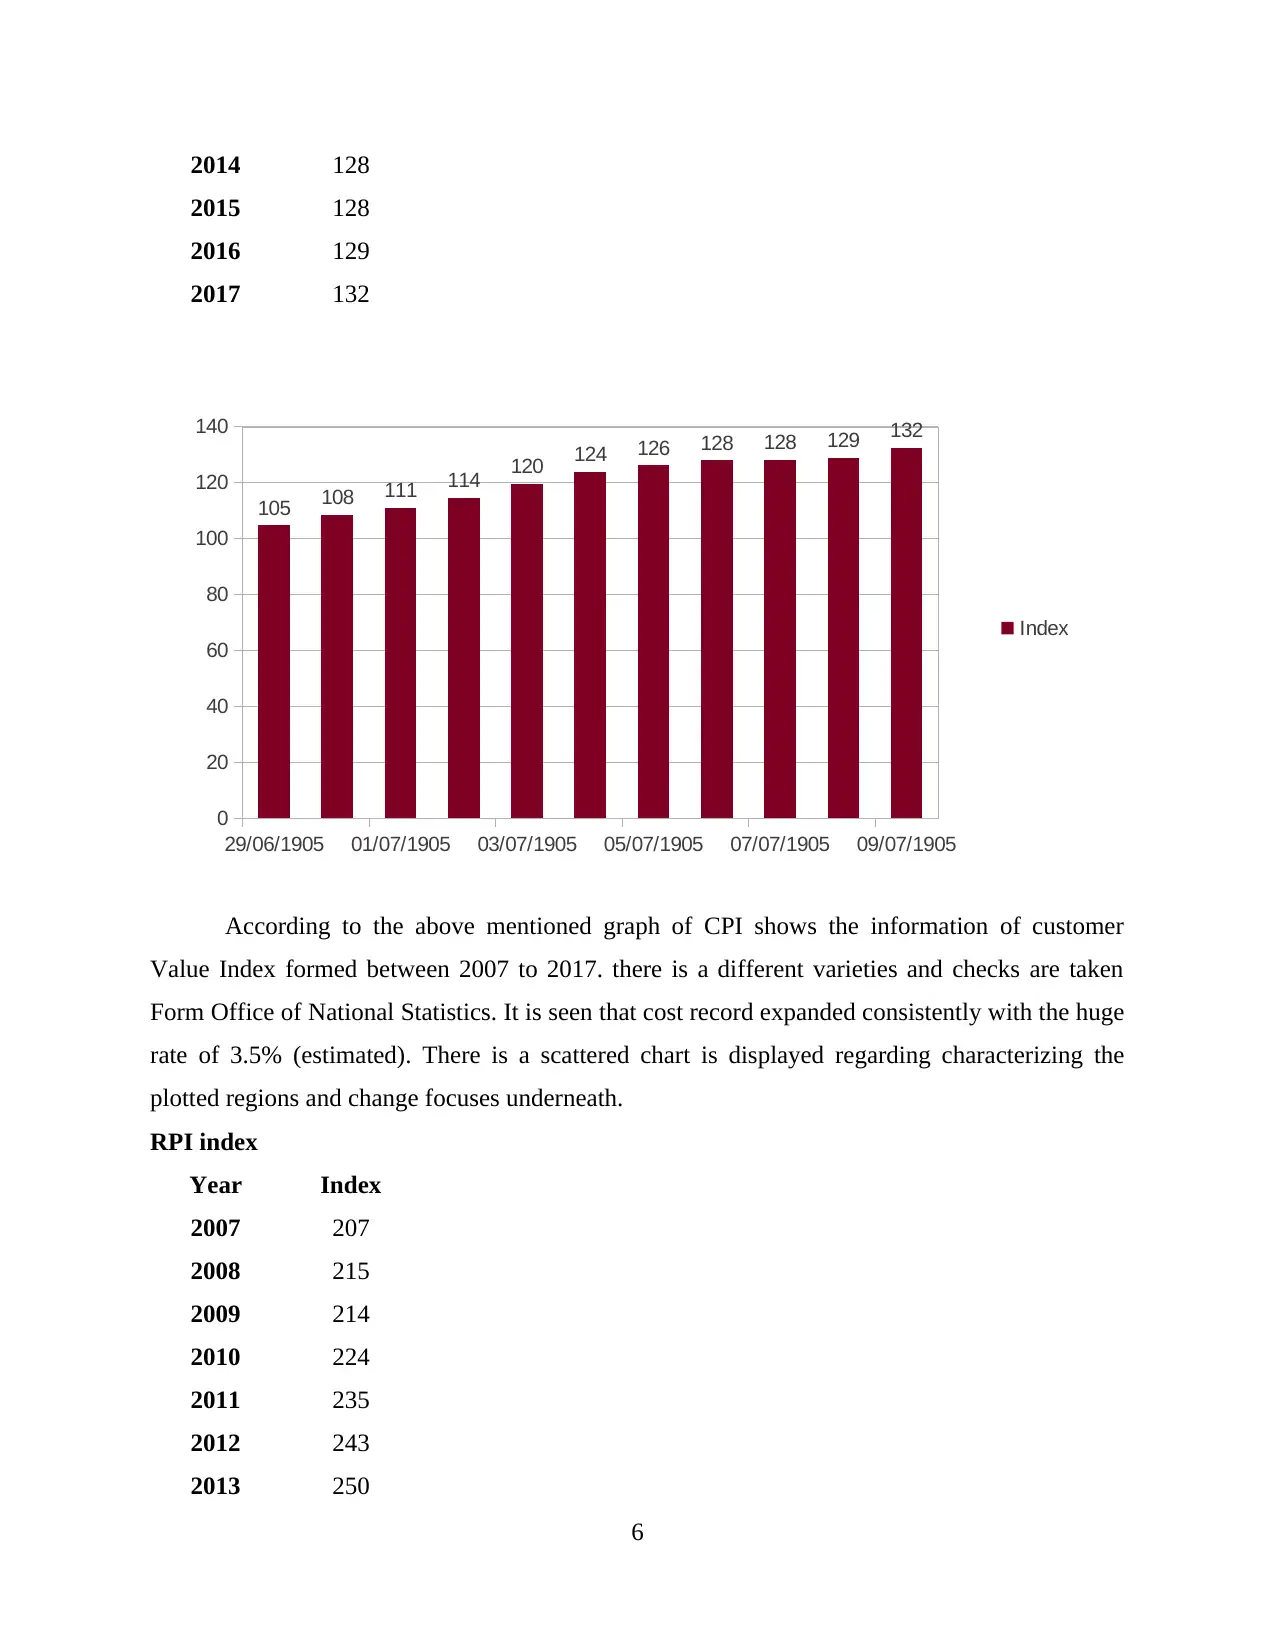
RPI index
Year Index
2007 207
2008 215
2009 214
2010 224
2011 235
2012 243
2013 250
6
2015 128
2016 129
2017 132
29/06/1905 01/07/1905 03/07/1905 05/07/1905 07/07/1905 09/07/1905
0
20
40
60
80
100
120
140
105 108 111 114 120 124 126 128 128 129 132
Index
According to the above mentioned graph of CPI shows the information of customer
Value Index formed between 2007 to 2017. there is a different varieties and checks are taken
Form Office of National Statistics. It is seen that cost record expanded consistently with the huge
rate of 3.5% (estimated). There is a scattered chart is displayed regarding characterizing the
plotted regions and change focuses underneath.
RPI index
Year Index
2007 207
2008 215
2009 214
2010 224
2011 235
2012 243
2013 250
6
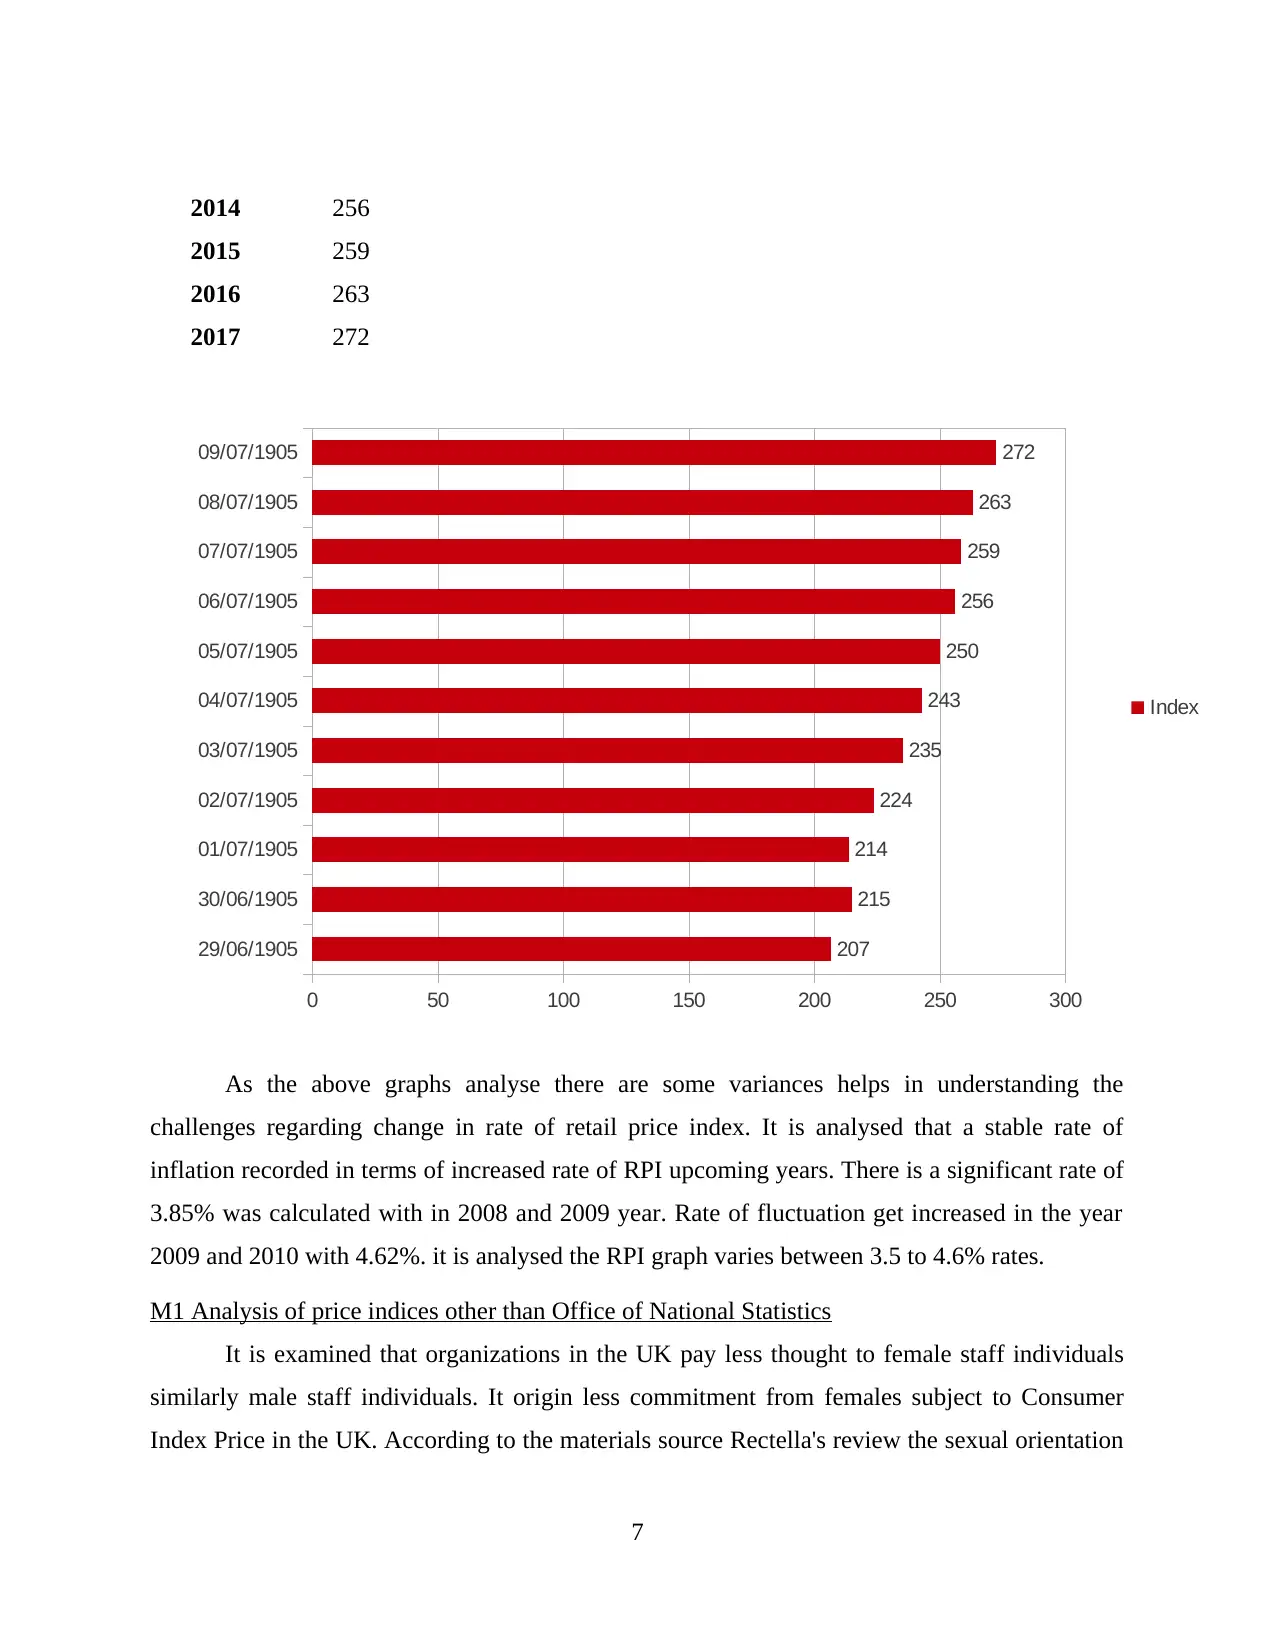
2014 256
2015 259
2016 263
2017 272
29/06/1905
30/06/1905
01/07/1905
02/07/1905
03/07/1905
04/07/1905
05/07/1905
06/07/1905
07/07/1905
08/07/1905
09/07/1905
0 50 100 150 200 250 300
207
215
214
224
235
243
250
256
259
263
272
Index
As the above graphs analyse there are some variances helps in understanding the
challenges regarding change in rate of retail price index. It is analysed that a stable rate of
inflation recorded in terms of increased rate of RPI upcoming years. There is a significant rate of
3.85% was calculated with in 2008 and 2009 year. Rate of fluctuation get increased in the year
2009 and 2010 with 4.62%. it is analysed the RPI graph varies between 3.5 to 4.6% rates.
M1 Analysis of price indices other than Office of National Statistics
It is examined that organizations in the UK pay less thought to female staff individuals
similarly male staff individuals. It origin less commitment from females subject to Consumer
Index Price in the UK. According to the materials source Rectella's review the sexual orientation
7
⊘ This is a preview!⊘
Do you want full access?
Subscribe today to unlock all pages.
Trusted by 1+ million students worldwide
pay hole was recorded as 88%. Middle was determined as 9.9% for estimation as far as
instalments (Gender pay hole in UK, 2018).
D1 Difference between the descriptive, Exploratory and confirmatory analysis with examples
Descriptive Exploratory Confirmatory
It is an organized procedure
that incorporates the qualities
and capacities of subjects.
Probability and examining are
utilized for the particular
reason.
It examine that what kind of
information is required to
break down and how the it will
be outlined in most ideal route
for better execution.
It is a piece of information
examination utilized by
conventional factual devices
like certainty, criticality and
surmising.
ACTIVITY 2
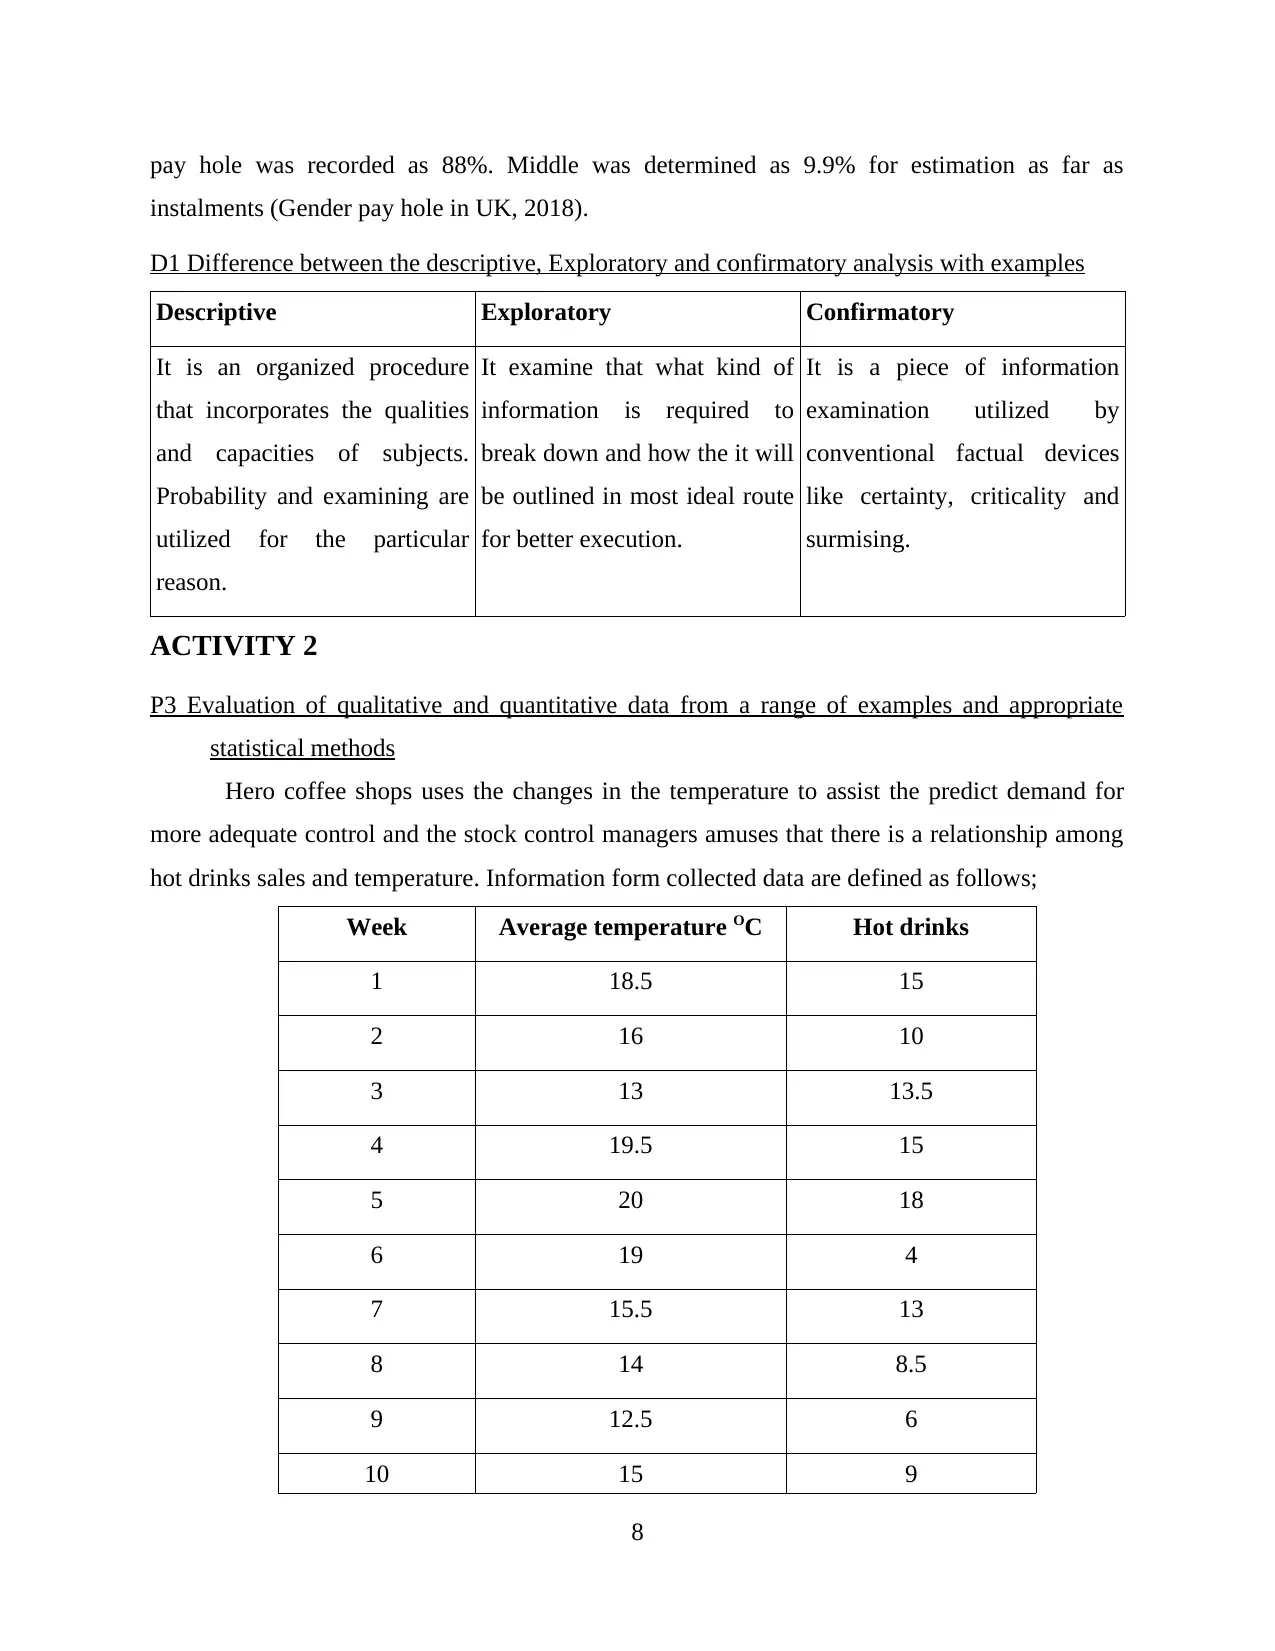
P3 Evaluation of qualitative and quantitative data from a range of examples and appropriate
statistical methods
Hero coffee shops uses the changes in the temperature to assist the predict demand for
more adequate control and the stock control managers amuses that there is a relationship among
hot drinks sales and temperature. Information form collected data are defined as follows;
Week Average temperature OC Hot drinks
1 18.5 15
2 16 10
3 13 13.5
4 19.5 15
5 20 18
6 19 4
7 15.5 13
8 14 8.5
9 12.5 6
10 15 9
8
instalments (Gender pay hole in UK, 2018).
D1 Difference between the descriptive, Exploratory and confirmatory analysis with examples
Descriptive Exploratory Confirmatory
It is an organized procedure
that incorporates the qualities
and capacities of subjects.
Probability and examining are
utilized for the particular
reason.
It examine that what kind of
information is required to
break down and how the it will
be outlined in most ideal route
for better execution.
It is a piece of information
examination utilized by
conventional factual devices
like certainty, criticality and
surmising.
ACTIVITY 2
P3 Evaluation of qualitative and quantitative data from a range of examples and appropriate
statistical methods
Hero coffee shops uses the changes in the temperature to assist the predict demand for
more adequate control and the stock control managers amuses that there is a relationship among
hot drinks sales and temperature. Information form collected data are defined as follows;
Week Average temperature OC Hot drinks
1 18.5 15
2 16 10
3 13 13.5
4 19.5 15
5 20 18
6 19 4
7 15.5 13
8 14 8.5
9 12.5 6
10 15 9
8
Paraphrase This Document
Need a fresh take? Get an instant paraphrase of this document with our AI Paraphraser
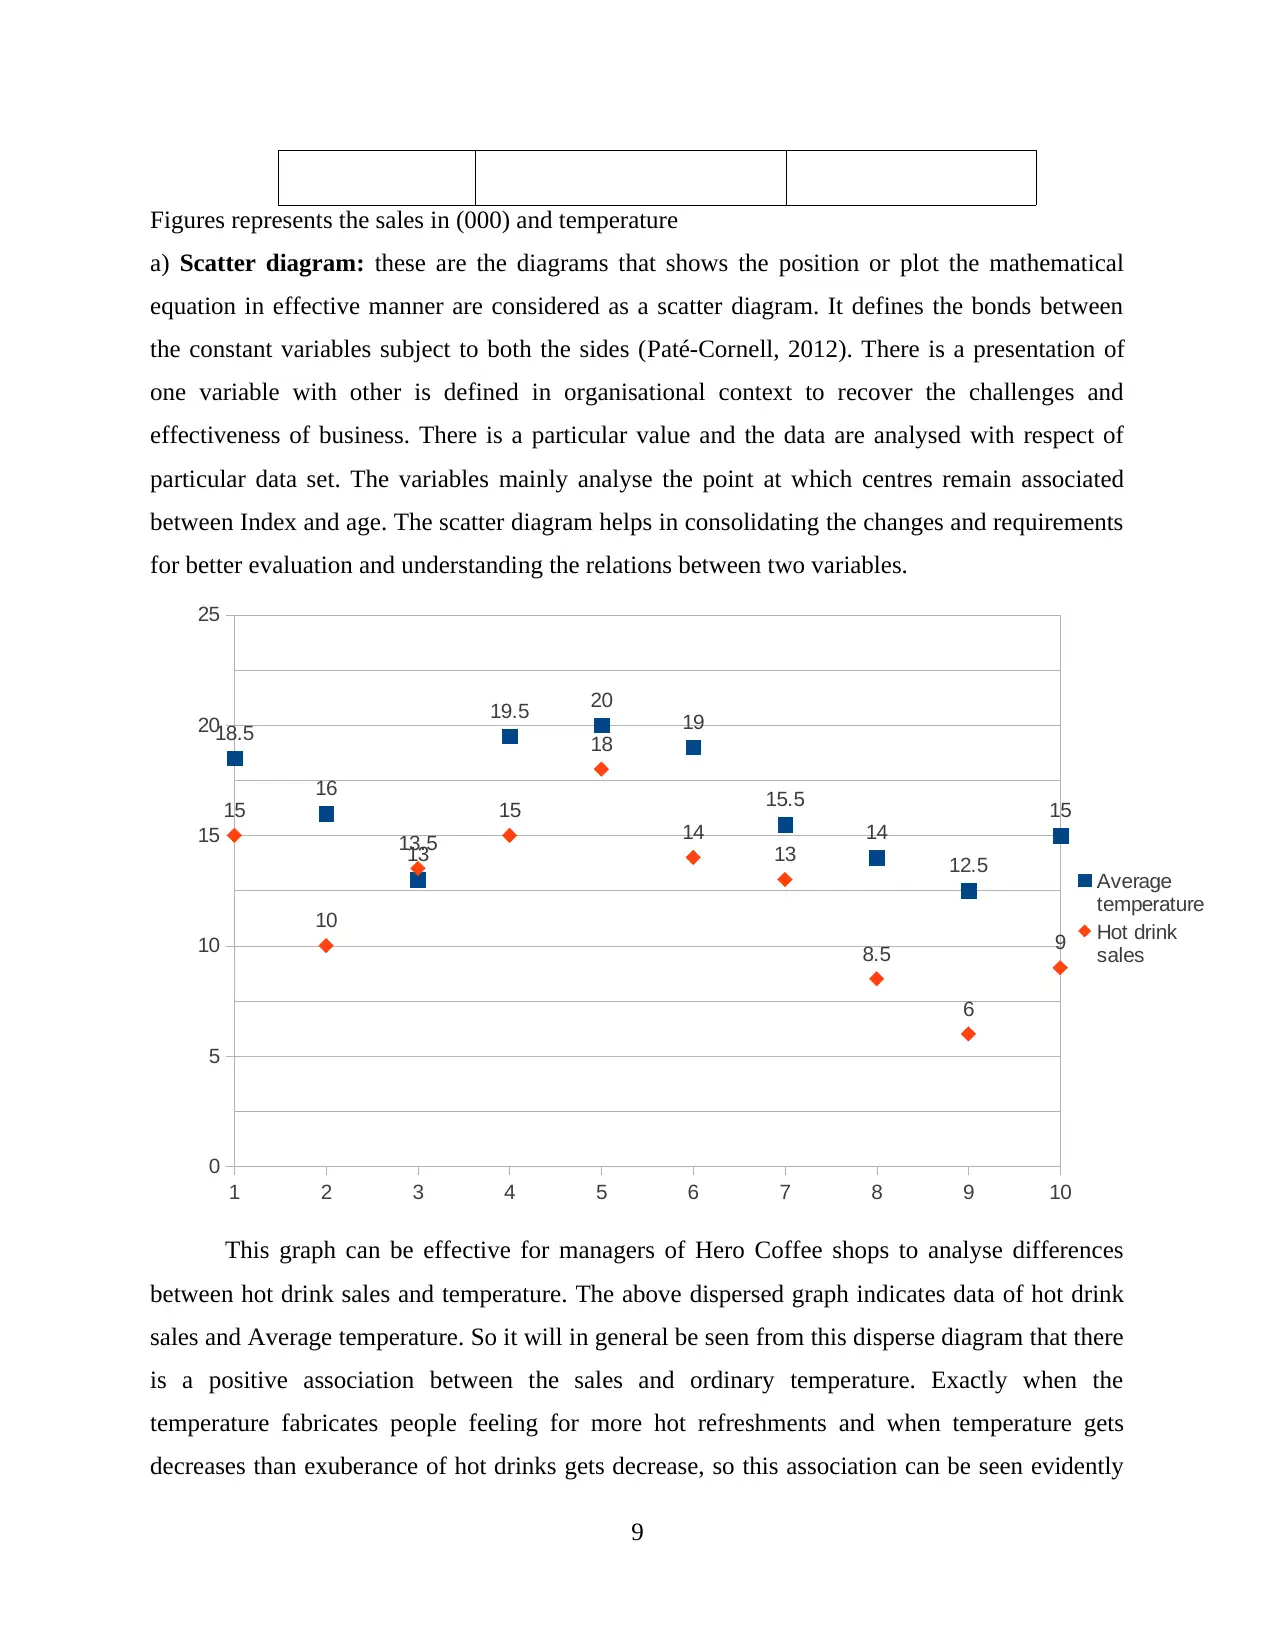
Figures represents the sales in (000) and temperature
a) Scatter diagram: these are the diagrams that shows the position or plot the mathematical
equation in effective manner are considered as a scatter diagram. It defines the bonds between
the constant variables subject to both the sides (Paté‐Cornell, 2012). There is a presentation of
one variable with other is defined in organisational context to recover the challenges and
effectiveness of business. There is a particular value and the data are analysed with respect of
particular data set. The variables mainly analyse the point at which centres remain associated
between Index and age. The scatter diagram helps in consolidating the changes and requirements
for better evaluation and understanding the relations between two variables.
1 2 3 4 5 6 7 8 9 10
0
5
10
15
20
25
18.5
16
13
19.5 20
19
15.5
14
12.5
1515
10
13.5
15
18
14
13
8.5
6
9
Average
temperature
Hot drink
sales
This graph can be effective for managers of Hero Coffee shops to analyse differences
between hot drink sales and temperature. The above dispersed graph indicates data of hot drink
sales and Average temperature. So it will in general be seen from this disperse diagram that there
is a positive association between the sales and ordinary temperature. Exactly when the
temperature fabricates people feeling for more hot refreshments and when temperature gets
decreases than exuberance of hot drinks gets decrease, so this association can be seen evidently
9
from the above scramble diagram. As in the week second and fourth sales is proportionate to
temperature. As in week ninth sales is at their most insignificant moreover the temperature is
low. So there is a positive association among temperature and hot refreshment sales.
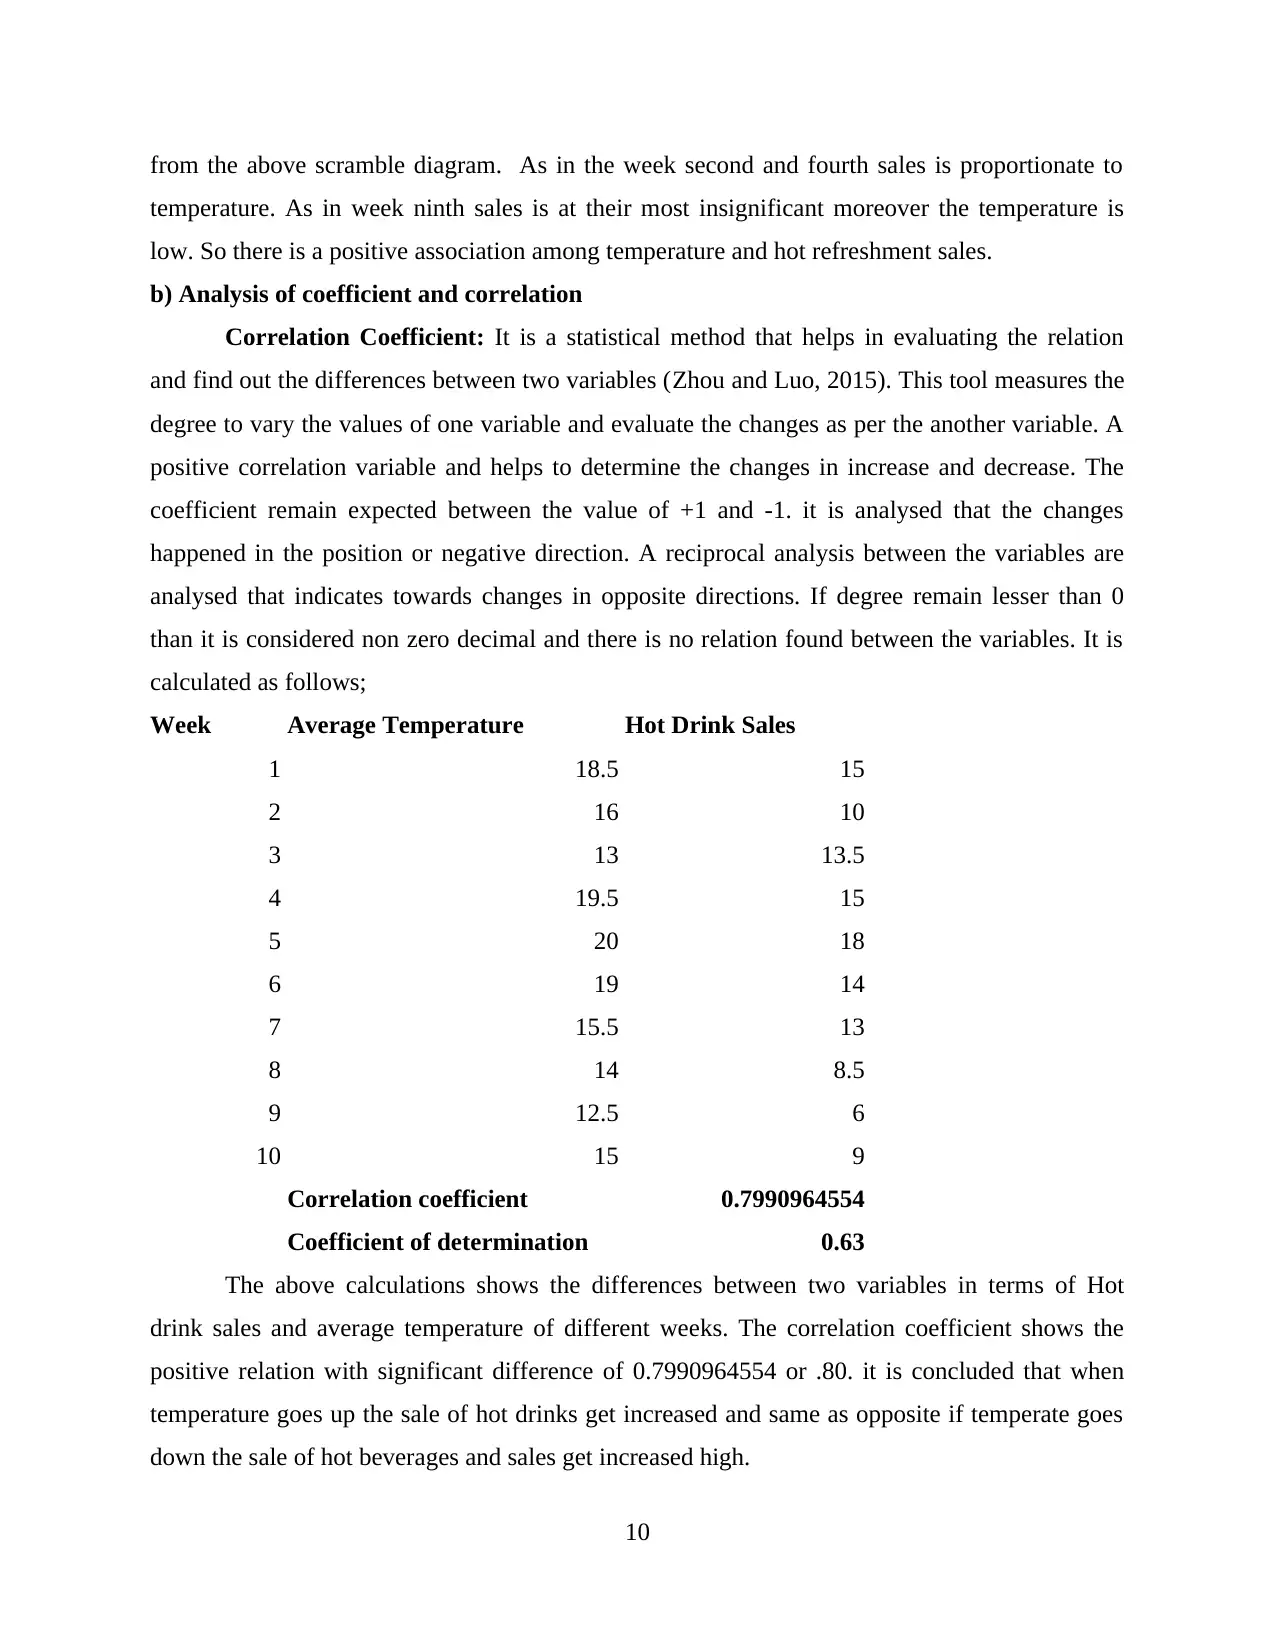
b) Analysis of coefficient and correlation
Correlation Coefficient: It is a statistical method that helps in evaluating the relation
and find out the differences between two variables (Zhou and Luo, 2015). This tool measures the
degree to vary the values of one variable and evaluate the changes as per the another variable. A
positive correlation variable and helps to determine the changes in increase and decrease. The
coefficient remain expected between the value of +1 and -1. it is analysed that the changes
happened in the position or negative direction. A reciprocal analysis between the variables are
analysed that indicates towards changes in opposite directions. If degree remain lesser than 0
than it is considered non zero decimal and there is no relation found between the variables. It is
calculated as follows;
Week Average Temperature Hot Drink Sales
1 18.5 15
2 16 10
3 13 13.5
4 19.5 15
5 20 18
6 19 14
7 15.5 13
8 14 8.5
9 12.5 6
10 15 9
Correlation coefficient 0.7990964554
Coefficient of determination 0.63
The above calculations shows the differences between two variables in terms of Hot
drink sales and average temperature of different weeks. The correlation coefficient shows the
positive relation with significant difference of 0.7990964554 or .80. it is concluded that when
temperature goes up the sale of hot drinks get increased and same as opposite if temperate goes
down the sale of hot beverages and sales get increased high.
10
temperature. As in week ninth sales is at their most insignificant moreover the temperature is
low. So there is a positive association among temperature and hot refreshment sales.
b) Analysis of coefficient and correlation
Correlation Coefficient: It is a statistical method that helps in evaluating the relation
and find out the differences between two variables (Zhou and Luo, 2015). This tool measures the
degree to vary the values of one variable and evaluate the changes as per the another variable. A
positive correlation variable and helps to determine the changes in increase and decrease. The
coefficient remain expected between the value of +1 and -1. it is analysed that the changes
happened in the position or negative direction. A reciprocal analysis between the variables are
analysed that indicates towards changes in opposite directions. If degree remain lesser than 0
than it is considered non zero decimal and there is no relation found between the variables. It is
calculated as follows;
Week Average Temperature Hot Drink Sales
1 18.5 15
2 16 10
3 13 13.5
4 19.5 15
5 20 18
6 19 14
7 15.5 13
8 14 8.5
9 12.5 6
10 15 9
Correlation coefficient 0.7990964554
Coefficient of determination 0.63
The above calculations shows the differences between two variables in terms of Hot
drink sales and average temperature of different weeks. The correlation coefficient shows the
positive relation with significant difference of 0.7990964554 or .80. it is concluded that when
temperature goes up the sale of hot drinks get increased and same as opposite if temperate goes
down the sale of hot beverages and sales get increased high.
10
⊘ This is a preview!⊘
Do you want full access?
Subscribe today to unlock all pages.
Trusted by 1+ million students worldwide
1 out of 18
Related Documents


Your All-in-One AI-Powered Toolkit for Academic Success.
+13062052269
info@desklib.com
Available 24*7 on WhatsApp / Email
![[object Object]](/_next/static/media/star-bottom.7253800d.svg)
Unlock your academic potential
Copyright © 2020–2026 A2Z Services. All Rights Reserved. Developed and managed by ZUCOL.