Statistics for Management: Analysis of Earnings and Economic Data
VerifiedAdded on 2020/10/23
|18
|5012
|422
Report
AI Summary
This report presents a statistical analysis of earnings and economic data, focusing on the comparison of male and female earnings in both public and private sectors from 2010 to 2016. The analysis includes hypothesis testing to determine significant differences in earnings, time charts visualizing gross annual earnings, and the calculation of annual growth rates. Additionally, the report utilizes ogive charts to estimate quartiles and medians of hourly earnings and also calculates mean and standard deviation. The report also reflects charts for CPI, RPI, and CPIH from 2007-2017, and an ogive chart for cumulative percentage of staff versus earnings on an hourly basis. The findings, presented through tables and charts, provide insights into earnings trends and economic indicators.

STATISTICS FOR
MANAGEMENT
MANAGEMENT
Paraphrase This Document
Need a fresh take? Get an instant paraphrase of this document with our AI Paraphraser
TABLE OF CONTENTS
INTRODUCTION...........................................................................................................................1
TASK 1............................................................................................................................................1
1.a Determining that earnings of men in public sector is different from women earning
through hypothesis testing..........................................................................................................1
1.b Determining that earnings of men in private sector is different from women earning
through hypothesis testing..........................................................................................................2
C. Using excel spreadsheet, drawing time chart of earnings of every group for year 2009 –
2016.............................................................................................................................................3
Gross annual earnings of Male (Both sector)..............................................................................3
Gross Annual earnings of female (both sector)...........................................................................4
D. Determining annual growth rate in earnings of four groups..................................................4
TASK 2............................................................................................................................................5
2.1 Draft Ogive chart for estimating quartile and median of hourly earnings............................5
A.2 Calculating mean and standard deviation for hourly earnings.............................................9
Comparing earnings..................................................................................................................11
TASK 3..........................................................................................................................................11
a. Economic order quantity.......................................................................................................11
b.................................................................................................................................................11
c.................................................................................................................................................12
d.................................................................................................................................................12
TASK 4..........................................................................................................................................12
4.A Reflecting chart for CPI, RPI and CPIH from year 2007 – 2017......................................12
B. Ogive chart for cumulative % of staff vs earnings on hourly basis......................................14
CONCLUSION..............................................................................................................................15
REFERENCES..............................................................................................................................16
INTRODUCTION
Statistics is referred as term which is sued for summarizing process which an analyst used
for characterizing a dataset. In case any data set is dependent on sample of large population, then
there are high possibilities for framing interpretations on basis of population on initial based with
reference to statistical outcomes from sample. It helps in good decision making on face of
uncertainty and applied in different disciplines like econometrics, production and operations,
financial analysis along with marketing research and service improvements (Puri and Sengupta,
2018). This helps in giving accurate information to company so it could avoid problems in the
future. The present report will give evaluation of economic and business data or information
obtained through published resources. In this aspect, it will determine changes in gross annual
earning in private and public sector from year 2010 and gap between 2010 to 2016. Furthermore,
there will be application of office of national statistics to extract data on basis of industry sector.
This report will evaluate and analyse raw business data with use of statistical methods and
application of statistical methods with context to business planning. The findings will be
communicated with use of proper tables and charts.
TASK 1
1.a Determining that earnings of men in public sector is different from women earning through
hypothesis testing
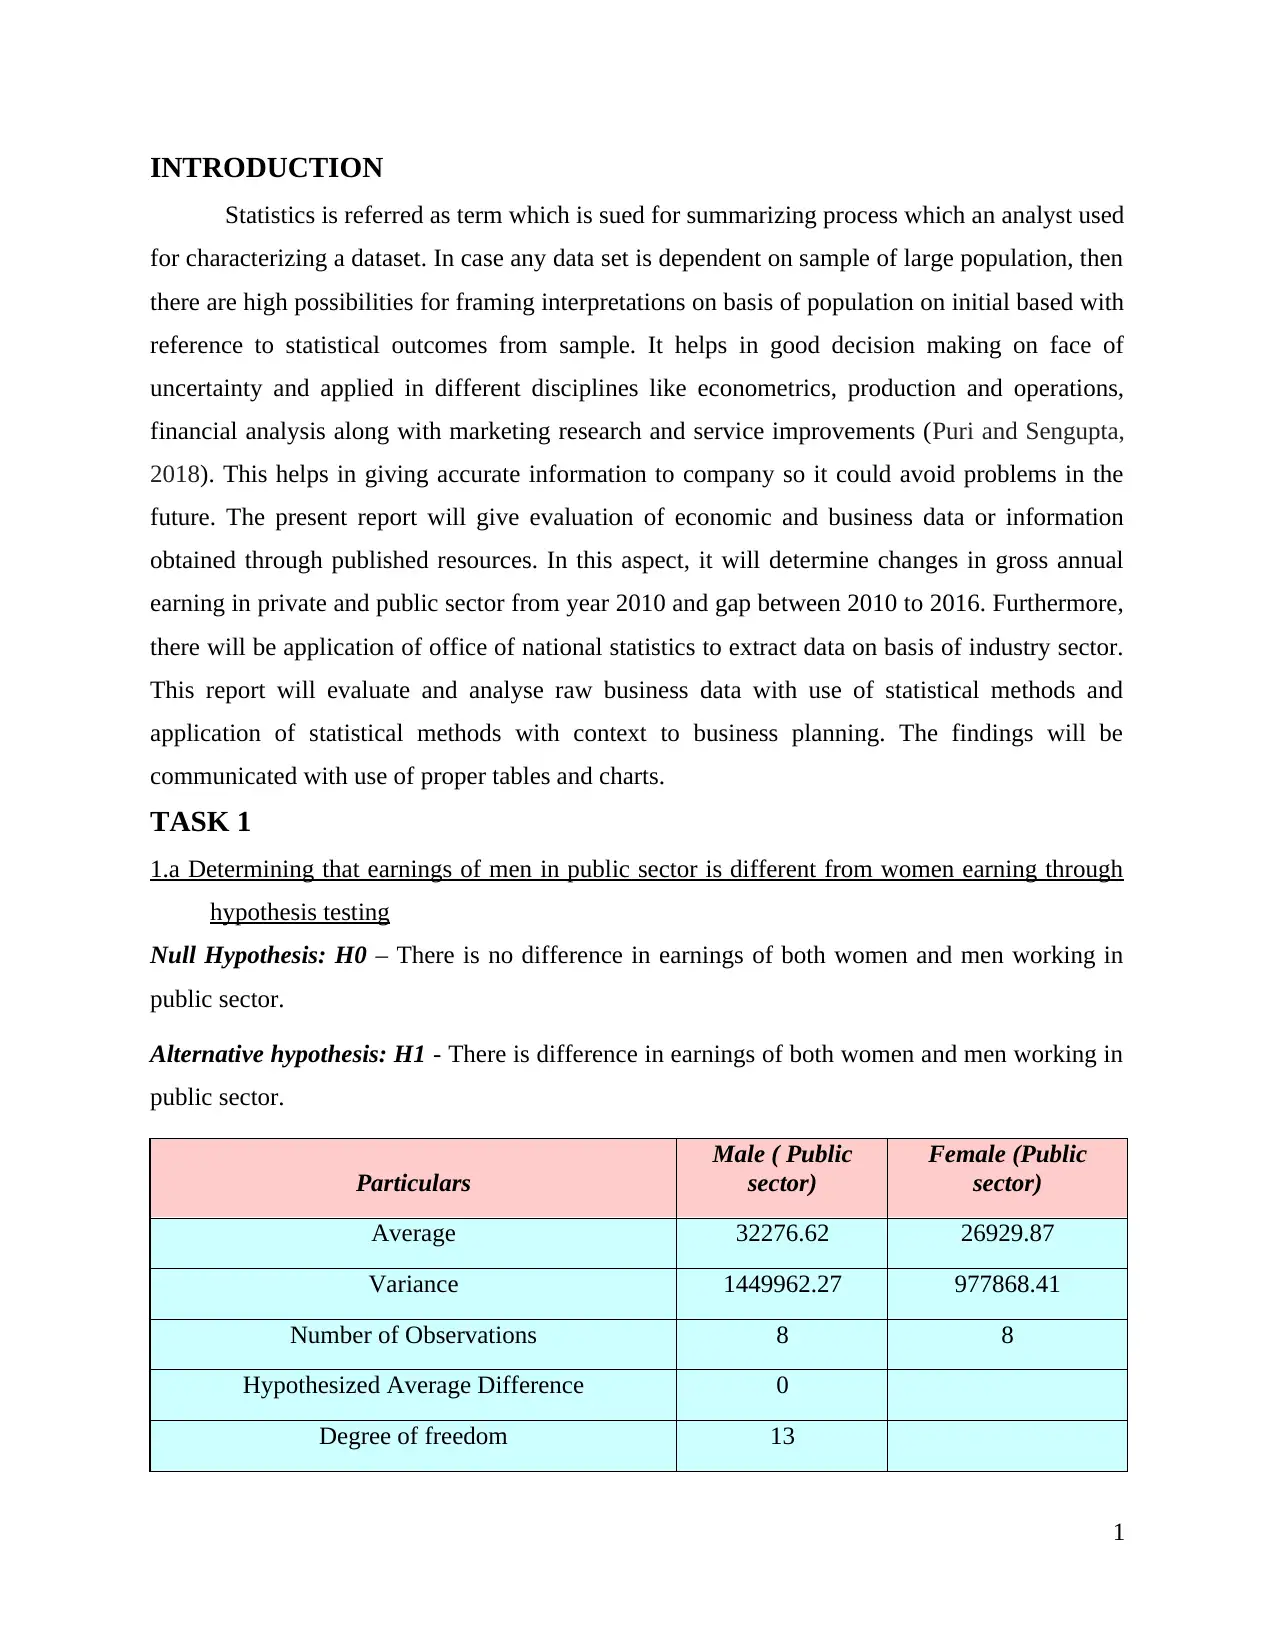
Null Hypothesis: H0 – There is no difference in earnings of both women and men working in
public sector.
Alternative hypothesis: H1 - There is difference in earnings of both women and men working in
public sector.
Particulars
Male ( Public
sector)
Female (Public
sector)
Average 32276.62 26929.87
Variance 1449962.27 977868.41
Number of Observations 8 8
Hypothesized Average Difference 0
Degree of freedom 13
1
Statistics is referred as term which is sued for summarizing process which an analyst used
for characterizing a dataset. In case any data set is dependent on sample of large population, then
there are high possibilities for framing interpretations on basis of population on initial based with
reference to statistical outcomes from sample. It helps in good decision making on face of
uncertainty and applied in different disciplines like econometrics, production and operations,
financial analysis along with marketing research and service improvements (Puri and Sengupta,
2018). This helps in giving accurate information to company so it could avoid problems in the
future. The present report will give evaluation of economic and business data or information
obtained through published resources. In this aspect, it will determine changes in gross annual
earning in private and public sector from year 2010 and gap between 2010 to 2016. Furthermore,
there will be application of office of national statistics to extract data on basis of industry sector.
This report will evaluate and analyse raw business data with use of statistical methods and
application of statistical methods with context to business planning. The findings will be
communicated with use of proper tables and charts.
TASK 1
1.a Determining that earnings of men in public sector is different from women earning through
hypothesis testing
Null Hypothesis: H0 – There is no difference in earnings of both women and men working in
public sector.
Alternative hypothesis: H1 - There is difference in earnings of both women and men working in
public sector.
Particulars
Male ( Public
sector)
Female (Public
sector)
Average 32276.62 26929.87
Variance 1449962.27 977868.41
Number of Observations 8 8
Hypothesized Average Difference 0
Degree of freedom 13
1
⊘ This is a preview!⊘
Do you want full access?
Subscribe today to unlock all pages.
Trusted by 1+ million students worldwide
t Statistics 9.71
P(T<=t) one-tail 1.27
t Critical one-tail 1.77
P(T<=t) two-tail 2.54
t Critical two-tail 2.16
Interpretation: On basis of above table it had been there is extraction of t test which
reflects that p value is greater than 0.05 then there is acceptance of null hypothesis. With context
of referring this aspect, it could be stated that there is no significant difference in earnings of
both gender men and women working in public sector as it is not statistically significant.
1.b Determining that earnings of men in private sector is different from women earning through
hypothesis testing
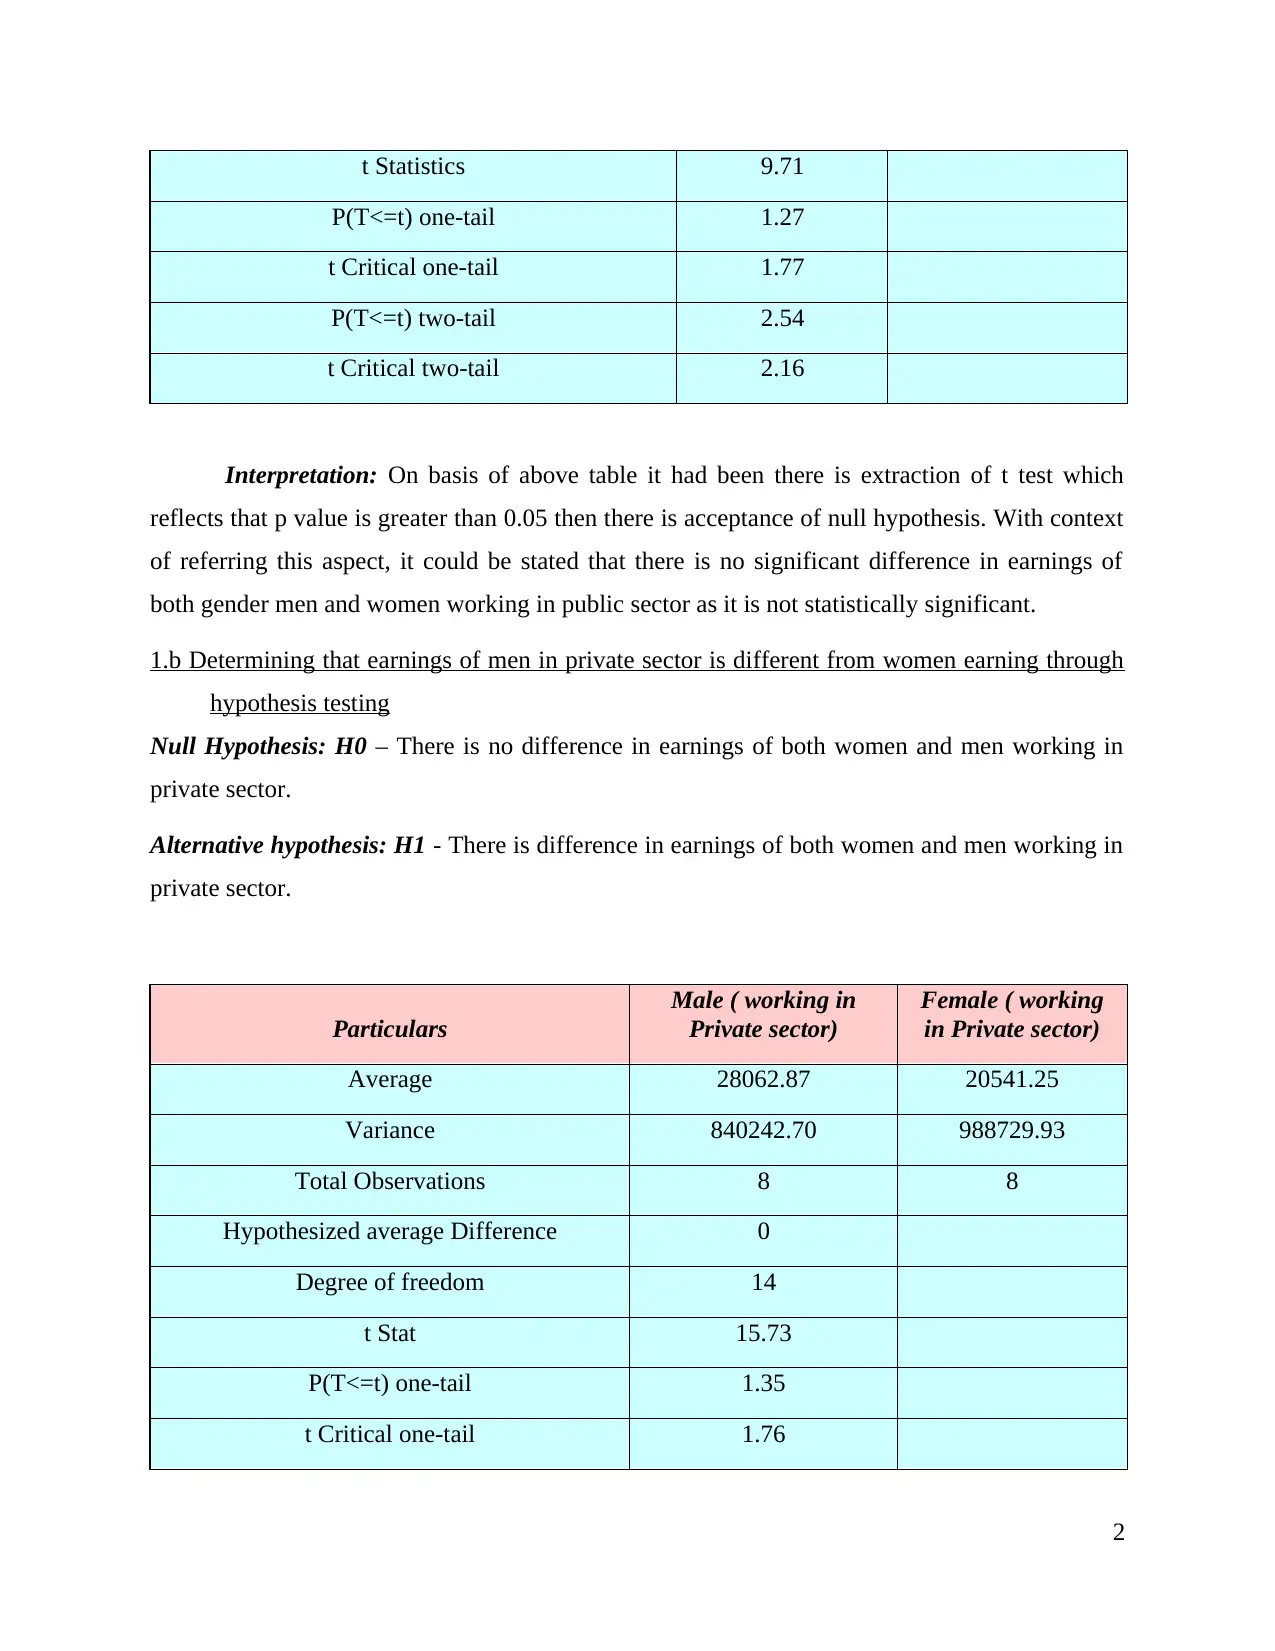
Null Hypothesis: H0 – There is no difference in earnings of both women and men working in
private sector.
Alternative hypothesis: H1 - There is difference in earnings of both women and men working in
private sector.
Particulars
Male ( working in
Private sector)
Female ( working
in Private sector)
Average 28062.87 20541.25
Variance 840242.70 988729.93
Total Observations 8 8
Hypothesized average Difference 0
Degree of freedom 14
t Stat 15.73
P(T<=t) one-tail 1.35
t Critical one-tail 1.76
2
P(T<=t) one-tail 1.27
t Critical one-tail 1.77
P(T<=t) two-tail 2.54
t Critical two-tail 2.16
Interpretation: On basis of above table it had been there is extraction of t test which
reflects that p value is greater than 0.05 then there is acceptance of null hypothesis. With context
of referring this aspect, it could be stated that there is no significant difference in earnings of
both gender men and women working in public sector as it is not statistically significant.
1.b Determining that earnings of men in private sector is different from women earning through
hypothesis testing
Null Hypothesis: H0 – There is no difference in earnings of both women and men working in
private sector.
Alternative hypothesis: H1 - There is difference in earnings of both women and men working in
private sector.
Particulars
Male ( working in
Private sector)
Female ( working
in Private sector)
Average 28062.87 20541.25
Variance 840242.70 988729.93
Total Observations 8 8
Hypothesized average Difference 0
Degree of freedom 14
t Stat 15.73
P(T<=t) one-tail 1.35
t Critical one-tail 1.76
2
Paraphrase This Document
Need a fresh take? Get an instant paraphrase of this document with our AI Paraphraser
P(T<=t) two-tail 2.70
t Critical two-tail 2.15
Interpretation: The above table is articulating average income of both men and women
working in private sector such as £28062.87 and £20541.25 respectively. In the above scenario, p
value is greater than 0.05 so with this consideration, it had been resulted that there is rejection of
alternative hypothesis (Anderson and et.al., 2018). In simple words, it could be elaborated that
there is no significant difference in men and women earnings who are working in private sector.
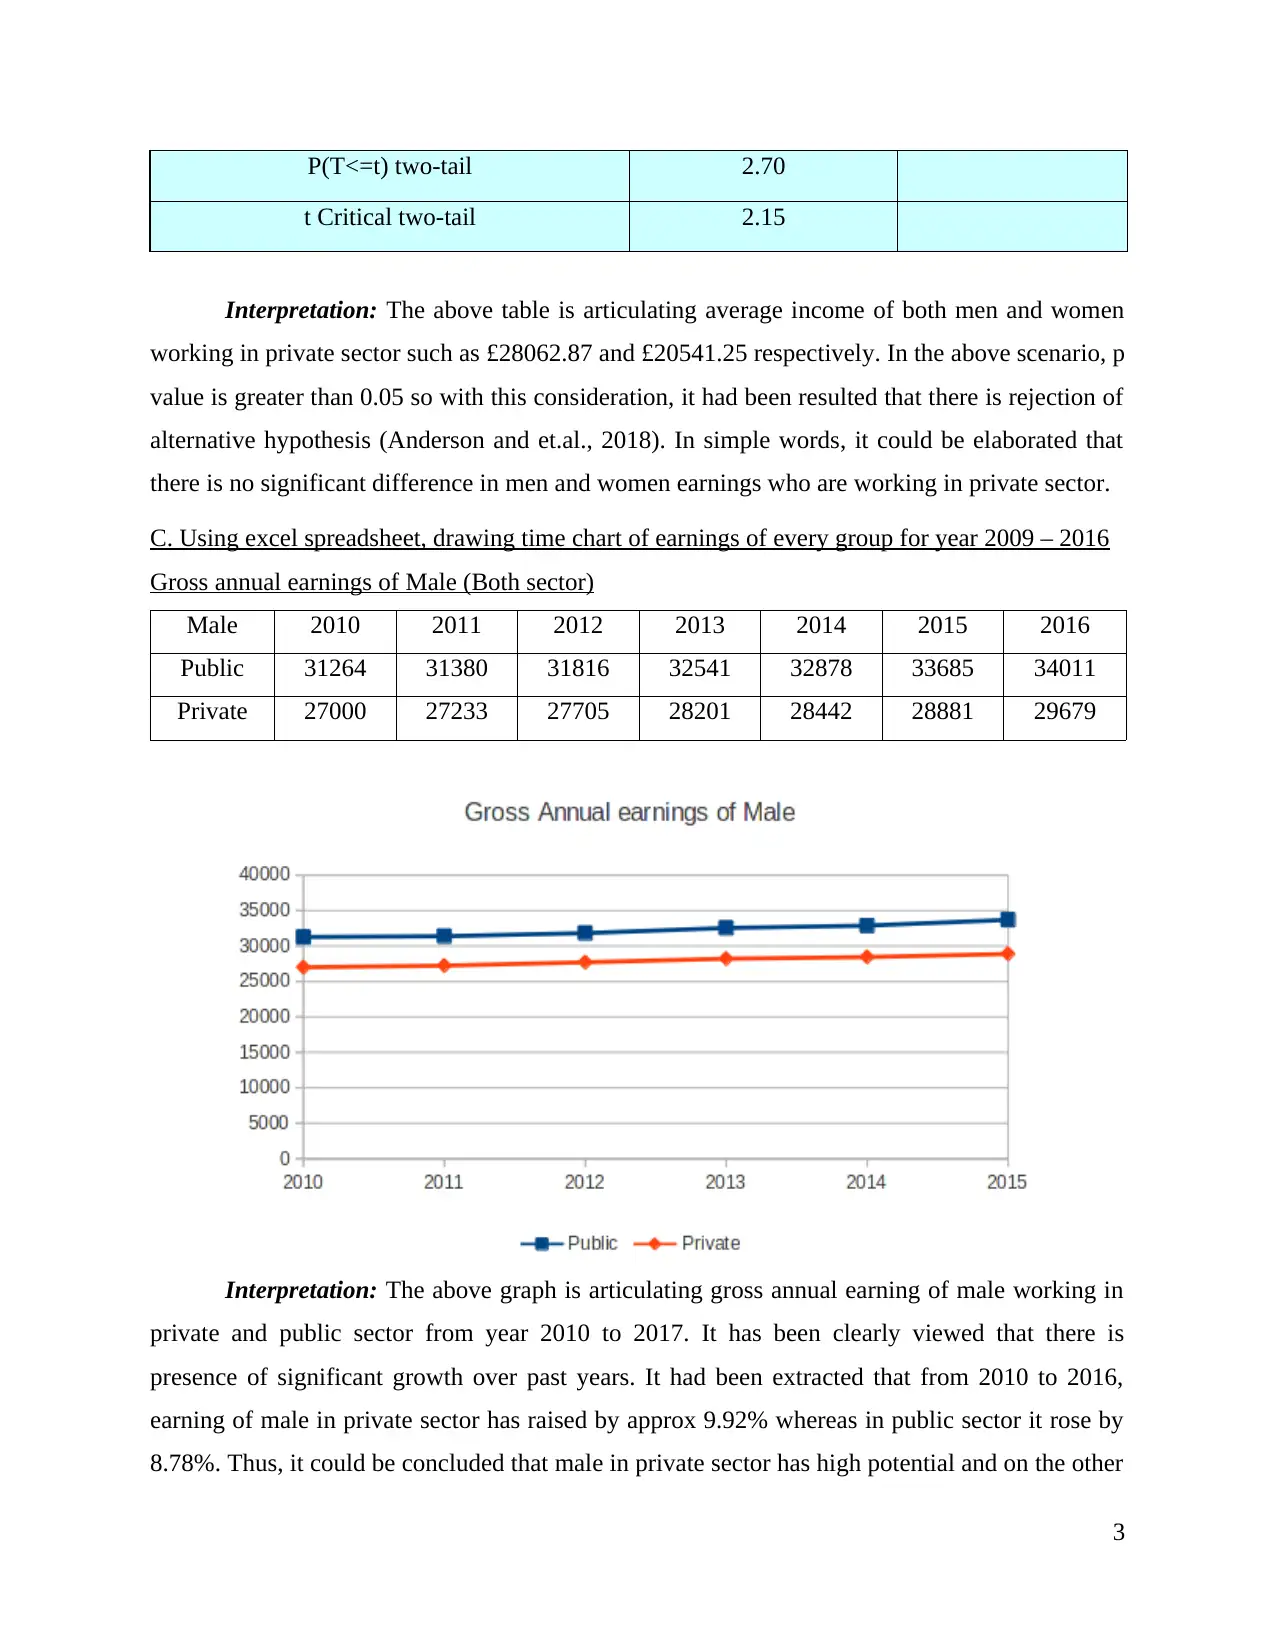
C. Using excel spreadsheet, drawing time chart of earnings of every group for year 2009 – 2016
Gross annual earnings of Male (Both sector)
Male 2010 2011 2012 2013 2014 2015 2016
Public 31264 31380 31816 32541 32878 33685 34011
Private 27000 27233 27705 28201 28442 28881 29679
Interpretation: The above graph is articulating gross annual earning of male working in
private and public sector from year 2010 to 2017. It has been clearly viewed that there is
presence of significant growth over past years. It had been extracted that from 2010 to 2016,
earning of male in private sector has raised by approx 9.92% whereas in public sector it rose by
8.78%. Thus, it could be concluded that male in private sector has high potential and on the other
3
t Critical two-tail 2.15
Interpretation: The above table is articulating average income of both men and women
working in private sector such as £28062.87 and £20541.25 respectively. In the above scenario, p
value is greater than 0.05 so with this consideration, it had been resulted that there is rejection of
alternative hypothesis (Anderson and et.al., 2018). In simple words, it could be elaborated that
there is no significant difference in men and women earnings who are working in private sector.
C. Using excel spreadsheet, drawing time chart of earnings of every group for year 2009 – 2016
Gross annual earnings of Male (Both sector)
Male 2010 2011 2012 2013 2014 2015 2016
Public 31264 31380 31816 32541 32878 33685 34011
Private 27000 27233 27705 28201 28442 28881 29679
Interpretation: The above graph is articulating gross annual earning of male working in
private and public sector from year 2010 to 2017. It has been clearly viewed that there is
presence of significant growth over past years. It had been extracted that from 2010 to 2016,
earning of male in private sector has raised by approx 9.92% whereas in public sector it rose by
8.78%. Thus, it could be concluded that male in private sector has high potential and on the other
3
hand, this graph is showing difference which had been implied in earnings in private and public
sector of men.
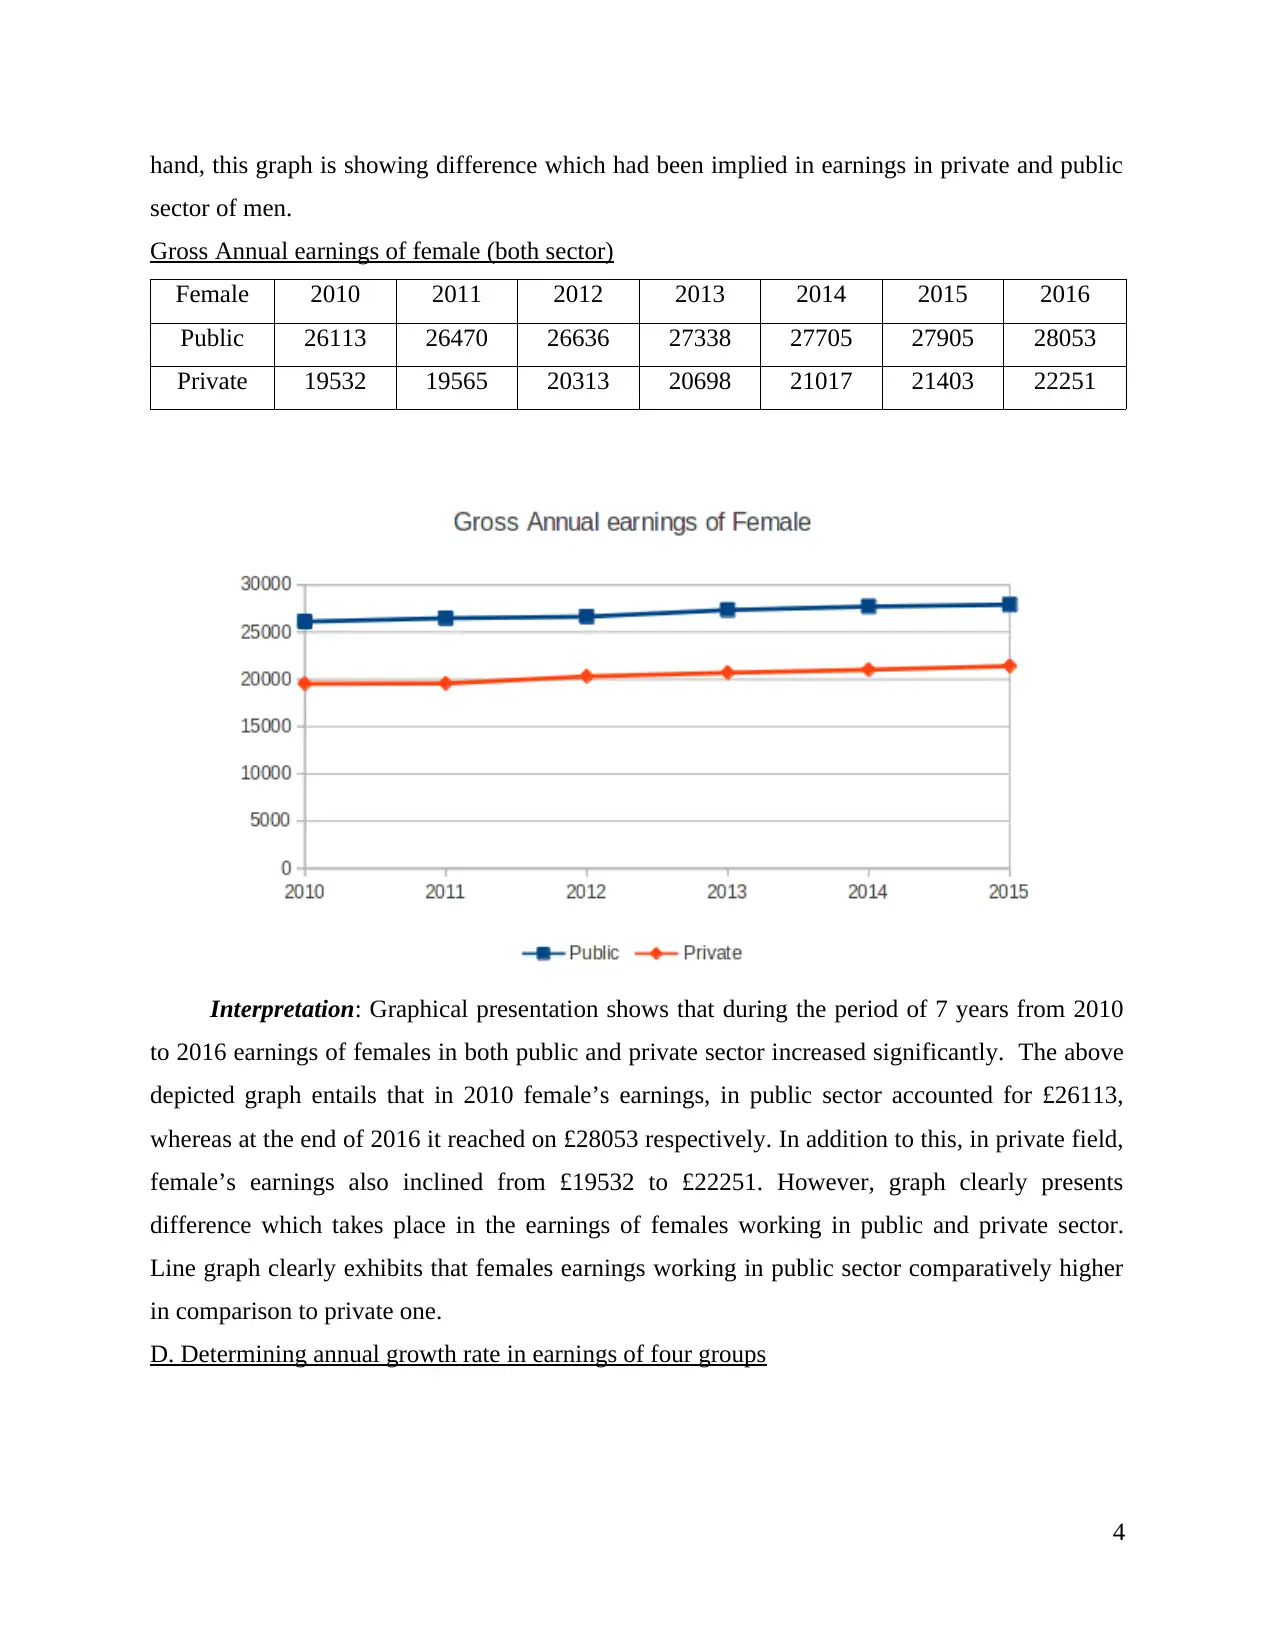
Gross Annual earnings of female (both sector)
Female 2010 2011 2012 2013 2014 2015 2016
Public 26113 26470 26636 27338 27705 27905 28053
Private 19532 19565 20313 20698 21017 21403 22251
Interpretation: Graphical presentation shows that during the period of 7 years from 2010
to 2016 earnings of females in both public and private sector increased significantly. The above
depicted graph entails that in 2010 female’s earnings, in public sector accounted for £26113,
whereas at the end of 2016 it reached on £28053 respectively. In addition to this, in private field,
female’s earnings also inclined from £19532 to £22251. However, graph clearly presents
difference which takes place in the earnings of females working in public and private sector.
Line graph clearly exhibits that females earnings working in public sector comparatively higher
in comparison to private one.
D. Determining annual growth rate in earnings of four groups
4
sector of men.
Gross Annual earnings of female (both sector)
Female 2010 2011 2012 2013 2014 2015 2016
Public 26113 26470 26636 27338 27705 27905 28053
Private 19532 19565 20313 20698 21017 21403 22251
Interpretation: Graphical presentation shows that during the period of 7 years from 2010
to 2016 earnings of females in both public and private sector increased significantly. The above
depicted graph entails that in 2010 female’s earnings, in public sector accounted for £26113,
whereas at the end of 2016 it reached on £28053 respectively. In addition to this, in private field,
female’s earnings also inclined from £19532 to £22251. However, graph clearly presents
difference which takes place in the earnings of females working in public and private sector.
Line graph clearly exhibits that females earnings working in public sector comparatively higher
in comparison to private one.
D. Determining annual growth rate in earnings of four groups
4
⊘ This is a preview!⊘
Do you want full access?
Subscribe today to unlock all pages.
Trusted by 1+ million students worldwide
Male Female
Year
Public
sector
(Men)
Rate of
growth (in
percentage
)
Private
sector
(Men)
Rate of
growth (in
percentage
)
Public
sector
(Women)
Rate of
growth (in
percentage
)
Private
sector
(Women)
Rate of
growth
(in
percen
tage)
2009 30638 NA 27362 NA 25224 NA 19551
2010 31264 2.0 27000 -1.3 26113 3.5 19532 -0.1
2011 31380 0.4 27233 0.9 26470 1.4 19565 0.2
2012 31816 1.4 27705 1.7 26636 0.6 20313 3.8
2013 32541 2.3 28201 1.8 27338 2.6 20698 1.9
2014 32878 1.0 28442 0.9 27705 1.3 21017 1.5
2015 33685 2.5 28881 1.5 27900 0.7 21403 1.8
2016 34011 1.0 29679 2.8 28053 0.5 22251 4.0
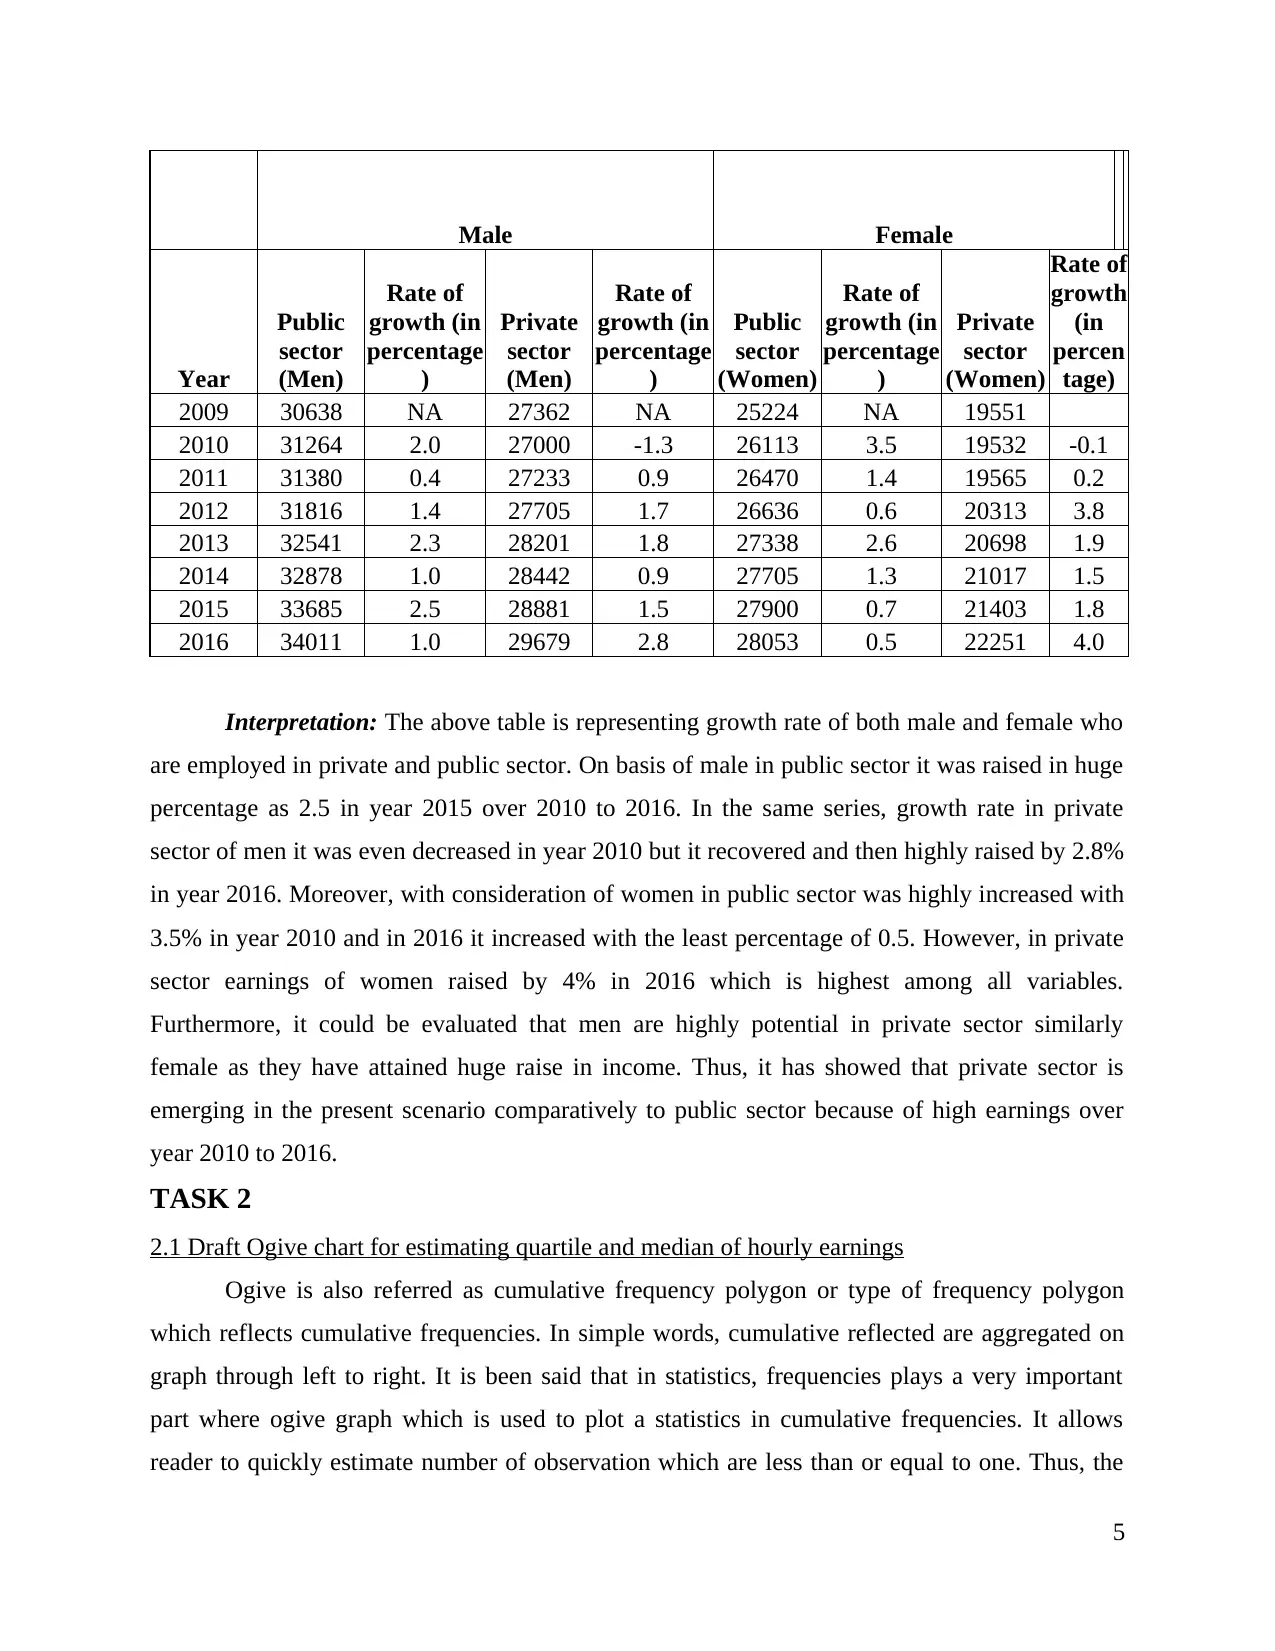
Interpretation: The above table is representing growth rate of both male and female who
are employed in private and public sector. On basis of male in public sector it was raised in huge
percentage as 2.5 in year 2015 over 2010 to 2016. In the same series, growth rate in private
sector of men it was even decreased in year 2010 but it recovered and then highly raised by 2.8%
in year 2016. Moreover, with consideration of women in public sector was highly increased with
3.5% in year 2010 and in 2016 it increased with the least percentage of 0.5. However, in private
sector earnings of women raised by 4% in 2016 which is highest among all variables.
Furthermore, it could be evaluated that men are highly potential in private sector similarly
female as they have attained huge raise in income. Thus, it has showed that private sector is
emerging in the present scenario comparatively to public sector because of high earnings over
year 2010 to 2016.
TASK 2
2.1 Draft Ogive chart for estimating quartile and median of hourly earnings
Ogive is also referred as cumulative frequency polygon or type of frequency polygon
which reflects cumulative frequencies. In simple words, cumulative reflected are aggregated on
graph through left to right. It is been said that in statistics, frequencies plays a very important
part where ogive graph which is used to plot a statistics in cumulative frequencies. It allows
reader to quickly estimate number of observation which are less than or equal to one. Thus, the
5
Year
Public
sector
(Men)
Rate of
growth (in
percentage
)
Private
sector
(Men)
Rate of
growth (in
percentage
)
Public
sector
(Women)
Rate of
growth (in
percentage
)
Private
sector
(Women)
Rate of
growth
(in
percen
tage)
2009 30638 NA 27362 NA 25224 NA 19551
2010 31264 2.0 27000 -1.3 26113 3.5 19532 -0.1
2011 31380 0.4 27233 0.9 26470 1.4 19565 0.2
2012 31816 1.4 27705 1.7 26636 0.6 20313 3.8
2013 32541 2.3 28201 1.8 27338 2.6 20698 1.9
2014 32878 1.0 28442 0.9 27705 1.3 21017 1.5
2015 33685 2.5 28881 1.5 27900 0.7 21403 1.8
2016 34011 1.0 29679 2.8 28053 0.5 22251 4.0
Interpretation: The above table is representing growth rate of both male and female who
are employed in private and public sector. On basis of male in public sector it was raised in huge
percentage as 2.5 in year 2015 over 2010 to 2016. In the same series, growth rate in private
sector of men it was even decreased in year 2010 but it recovered and then highly raised by 2.8%
in year 2016. Moreover, with consideration of women in public sector was highly increased with
3.5% in year 2010 and in 2016 it increased with the least percentage of 0.5. However, in private
sector earnings of women raised by 4% in 2016 which is highest among all variables.
Furthermore, it could be evaluated that men are highly potential in private sector similarly
female as they have attained huge raise in income. Thus, it has showed that private sector is
emerging in the present scenario comparatively to public sector because of high earnings over
year 2010 to 2016.
TASK 2
2.1 Draft Ogive chart for estimating quartile and median of hourly earnings
Ogive is also referred as cumulative frequency polygon or type of frequency polygon
which reflects cumulative frequencies. In simple words, cumulative reflected are aggregated on
graph through left to right. It is been said that in statistics, frequencies plays a very important
part where ogive graph which is used to plot a statistics in cumulative frequencies. It allows
reader to quickly estimate number of observation which are less than or equal to one. Thus, the
5
Paraphrase This Document
Need a fresh take? Get an instant paraphrase of this document with our AI Paraphraser
curve which represent distribution of cumulative frequency in the grouped data are known as
Ogive. In order to identify better understanding of tools and graphs this is the method which
mostly used for representing the cumulative frequency. Mean, median and standard deviation are
basic tool which is used for plotting the result which appeared with outcomes.
This graph plots cumulative frequency on y axis along with each class boundaries on x
axis. It is used for identifying number of data points which are equal to certain value in particular
data set (Lachowska and Myck, 2018). It is different through frequency polygon due to plot of
cumulative values instead of plot of valuing themselves. There is analysis of difference in hourly
earnings of London and Manchester with use of numerous statistical tools. In this aspect, there is
presentation of descriptive analysis of particular data base which comprises analysis of quartile,
mean and standard deviation. There is analysis of variation between leisure employee's hourly
earnings with their respective location. With this consideration, there is application of statistical
tools and simultaneously, reflection of descriptive statistics of specified database which
comprises median and quartile analysis which is stated below:
Median:
It is replicated as statistical term which is one method for extracting mean of specified
database. In simple terms, it is simple measure of central tendency and might be referred centre
or location of particular distribution. It is replicated as value which separates higher half with
lower half of sample data. It is value of number which is equally likely to fall below or above it.
Mainly median is considered as the middle number for the group of numbers. It is considered as
one of primary way in order to find the average of statistical data. Therefore, median is
considered as easy in calculation from comparison to mean and mode. Generally, it is used with
context of measuring properties of data set with reference to probability theory and statistics. In
simple words, it could be elaborated that it is method for identifying average of group of
numbers as it is one of three most common averages which are mean, mode and median. The
middle value in specified list of numbers is replicated as median (Hafiyusholeh, M., Budayasa
and Siswono, 2018).
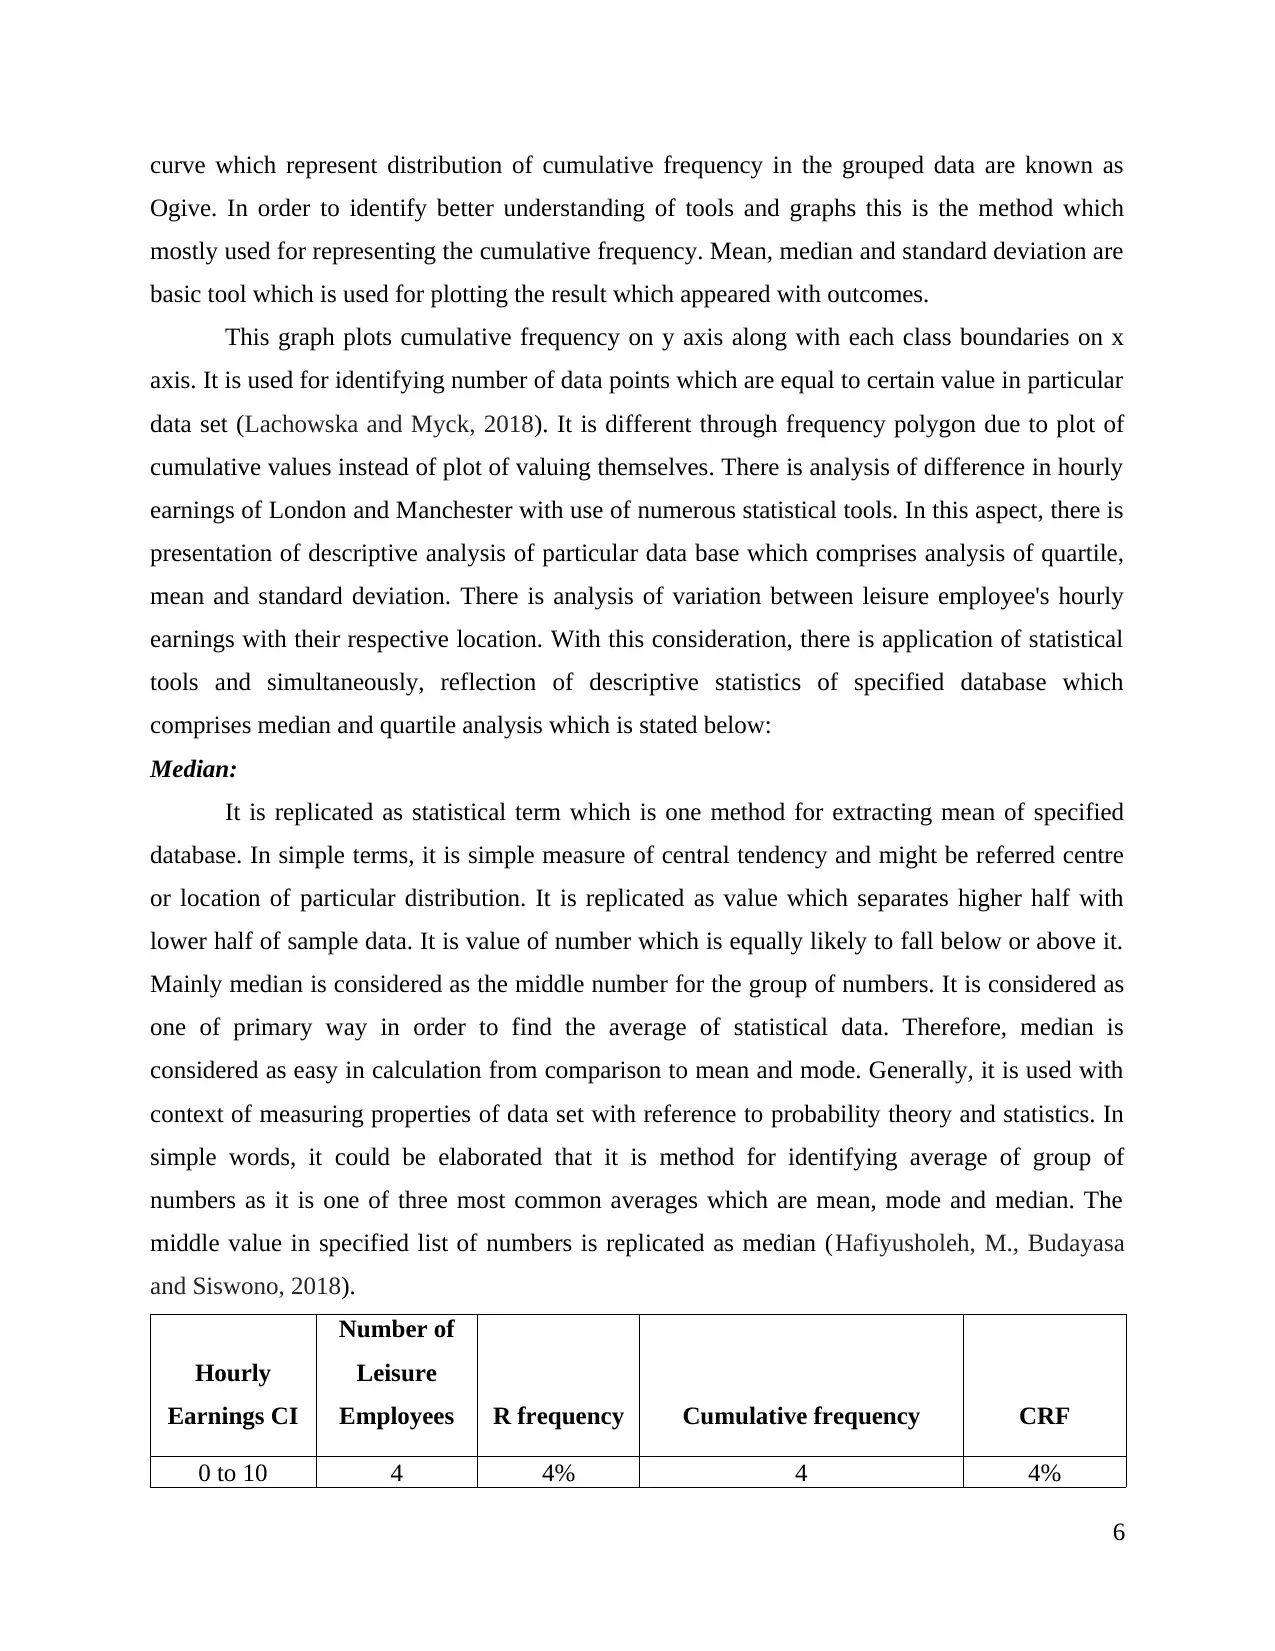
Hourly
Earnings CI
Number of
Leisure
Employees R frequency Cumulative frequency CRF
0 to 10 4 4% 4 4%
6
Ogive. In order to identify better understanding of tools and graphs this is the method which
mostly used for representing the cumulative frequency. Mean, median and standard deviation are
basic tool which is used for plotting the result which appeared with outcomes.
This graph plots cumulative frequency on y axis along with each class boundaries on x
axis. It is used for identifying number of data points which are equal to certain value in particular
data set (Lachowska and Myck, 2018). It is different through frequency polygon due to plot of
cumulative values instead of plot of valuing themselves. There is analysis of difference in hourly
earnings of London and Manchester with use of numerous statistical tools. In this aspect, there is
presentation of descriptive analysis of particular data base which comprises analysis of quartile,
mean and standard deviation. There is analysis of variation between leisure employee's hourly
earnings with their respective location. With this consideration, there is application of statistical
tools and simultaneously, reflection of descriptive statistics of specified database which
comprises median and quartile analysis which is stated below:
Median:
It is replicated as statistical term which is one method for extracting mean of specified
database. In simple terms, it is simple measure of central tendency and might be referred centre
or location of particular distribution. It is replicated as value which separates higher half with
lower half of sample data. It is value of number which is equally likely to fall below or above it.
Mainly median is considered as the middle number for the group of numbers. It is considered as
one of primary way in order to find the average of statistical data. Therefore, median is
considered as easy in calculation from comparison to mean and mode. Generally, it is used with
context of measuring properties of data set with reference to probability theory and statistics. In
simple words, it could be elaborated that it is method for identifying average of group of
numbers as it is one of three most common averages which are mean, mode and median. The
middle value in specified list of numbers is replicated as median (Hafiyusholeh, M., Budayasa
and Siswono, 2018).
Hourly
Earnings CI
Number of
Leisure
Employees R frequency Cumulative frequency CRF
0 to 10 4 4% 4 4%
6
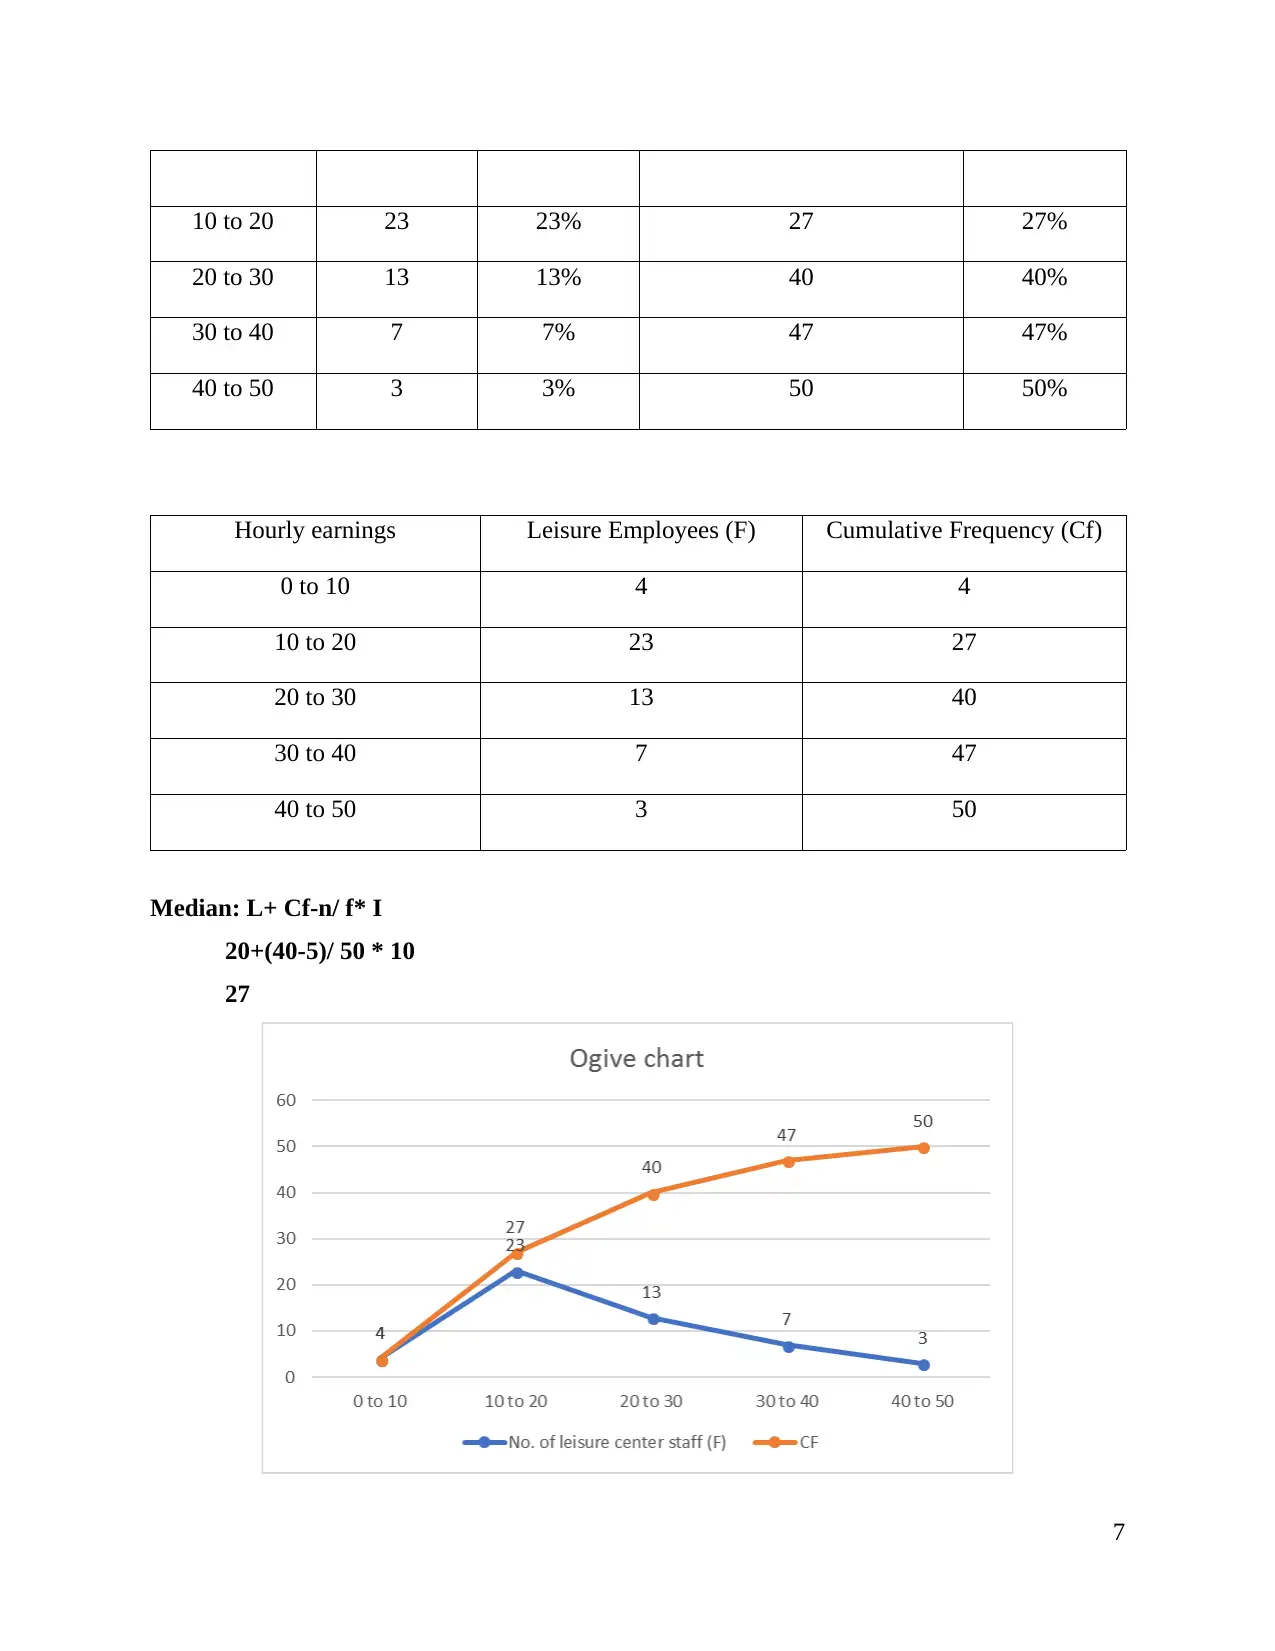
10 to 20 23 23% 27 27%
20 to 30 13 13% 40 40%
30 to 40 7 7% 47 47%
40 to 50 3 3% 50 50%
Hourly earnings Leisure Employees (F) Cumulative Frequency (Cf)
0 to 10 4 4
10 to 20 23 27
20 to 30 13 40
30 to 40 7 47
40 to 50 3 50
Median: L+ Cf-n/ f* I
20+(40-5)/ 50 * 10
27
7
20 to 30 13 13% 40 40%
30 to 40 7 7% 47 47%
40 to 50 3 3% 50 50%
Hourly earnings Leisure Employees (F) Cumulative Frequency (Cf)
0 to 10 4 4
10 to 20 23 27
20 to 30 13 40
30 to 40 7 47
40 to 50 3 50
Median: L+ Cf-n/ f* I
20+(40-5)/ 50 * 10
27
7
⊘ This is a preview!⊘
Do you want full access?
Subscribe today to unlock all pages.
Trusted by 1+ million students worldwide
Interpretation: The above graph is articulating ogive chart of hourly earnings of leisure
employees of London area. It could be clearly viewed that from 0 to 10 hours are increasing to
10 to 20 hours. In this aspect, trend has been observed that as hours are increasing then
frequency is decreasing as there is presence of cumulative frequency which at last it reached as
50.
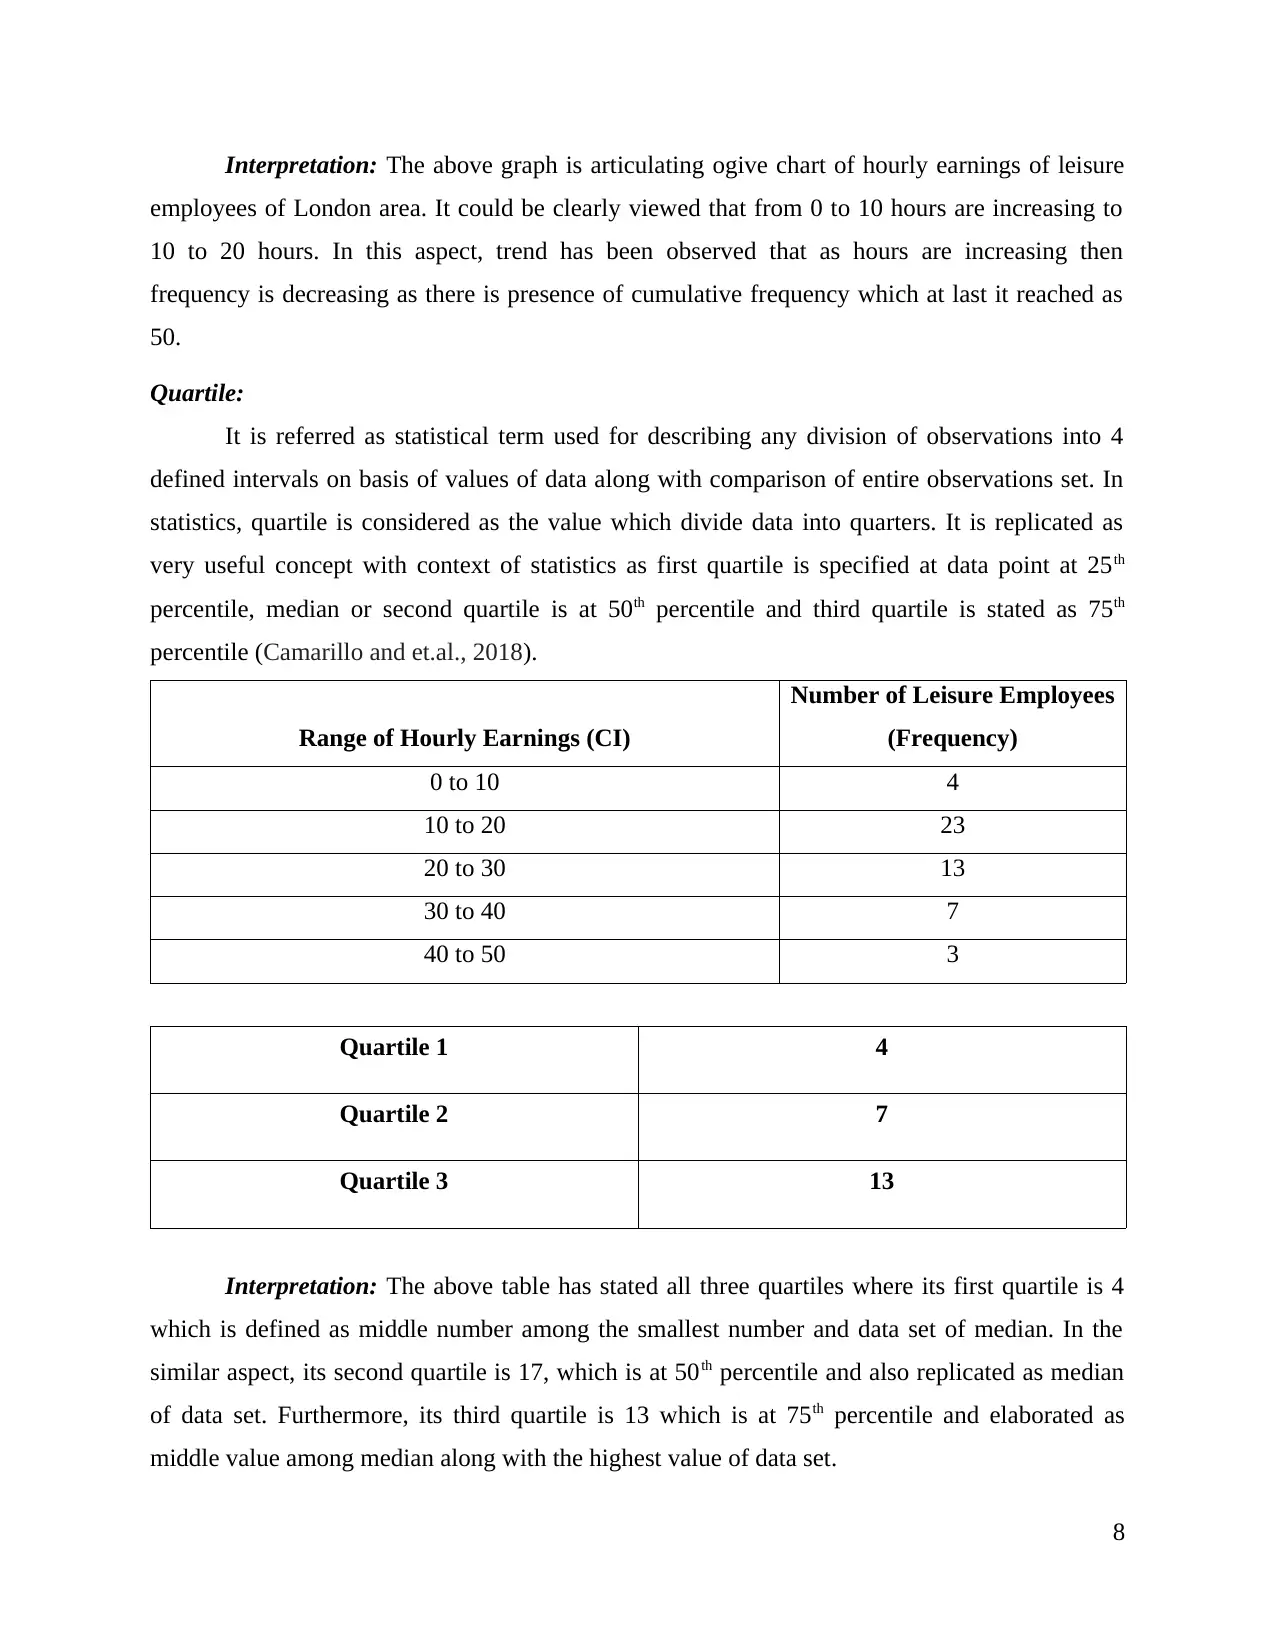
Quartile:
It is referred as statistical term used for describing any division of observations into 4
defined intervals on basis of values of data along with comparison of entire observations set. In
statistics, quartile is considered as the value which divide data into quarters. It is replicated as
very useful concept with context of statistics as first quartile is specified at data point at 25th
percentile, median or second quartile is at 50th percentile and third quartile is stated as 75th
percentile (Camarillo and et.al., 2018).
Range of Hourly Earnings (CI)
Number of Leisure Employees
(Frequency)
0 to 10 4
10 to 20 23
20 to 30 13
30 to 40 7
40 to 50 3
Quartile 1 4
Quartile 2 7
Quartile 3 13
Interpretation: The above table has stated all three quartiles where its first quartile is 4
which is defined as middle number among the smallest number and data set of median. In the
similar aspect, its second quartile is 17, which is at 50th percentile and also replicated as median
of data set. Furthermore, its third quartile is 13 which is at 75th percentile and elaborated as
middle value among median along with the highest value of data set.
8
employees of London area. It could be clearly viewed that from 0 to 10 hours are increasing to
10 to 20 hours. In this aspect, trend has been observed that as hours are increasing then
frequency is decreasing as there is presence of cumulative frequency which at last it reached as
50.
Quartile:
It is referred as statistical term used for describing any division of observations into 4
defined intervals on basis of values of data along with comparison of entire observations set. In
statistics, quartile is considered as the value which divide data into quarters. It is replicated as
very useful concept with context of statistics as first quartile is specified at data point at 25th
percentile, median or second quartile is at 50th percentile and third quartile is stated as 75th
percentile (Camarillo and et.al., 2018).
Range of Hourly Earnings (CI)
Number of Leisure Employees
(Frequency)
0 to 10 4
10 to 20 23
20 to 30 13
30 to 40 7
40 to 50 3
Quartile 1 4
Quartile 2 7
Quartile 3 13
Interpretation: The above table has stated all three quartiles where its first quartile is 4
which is defined as middle number among the smallest number and data set of median. In the
similar aspect, its second quartile is 17, which is at 50th percentile and also replicated as median
of data set. Furthermore, its third quartile is 13 which is at 75th percentile and elaborated as
middle value among median along with the highest value of data set.
8
Paraphrase This Document
Need a fresh take? Get an instant paraphrase of this document with our AI Paraphraser
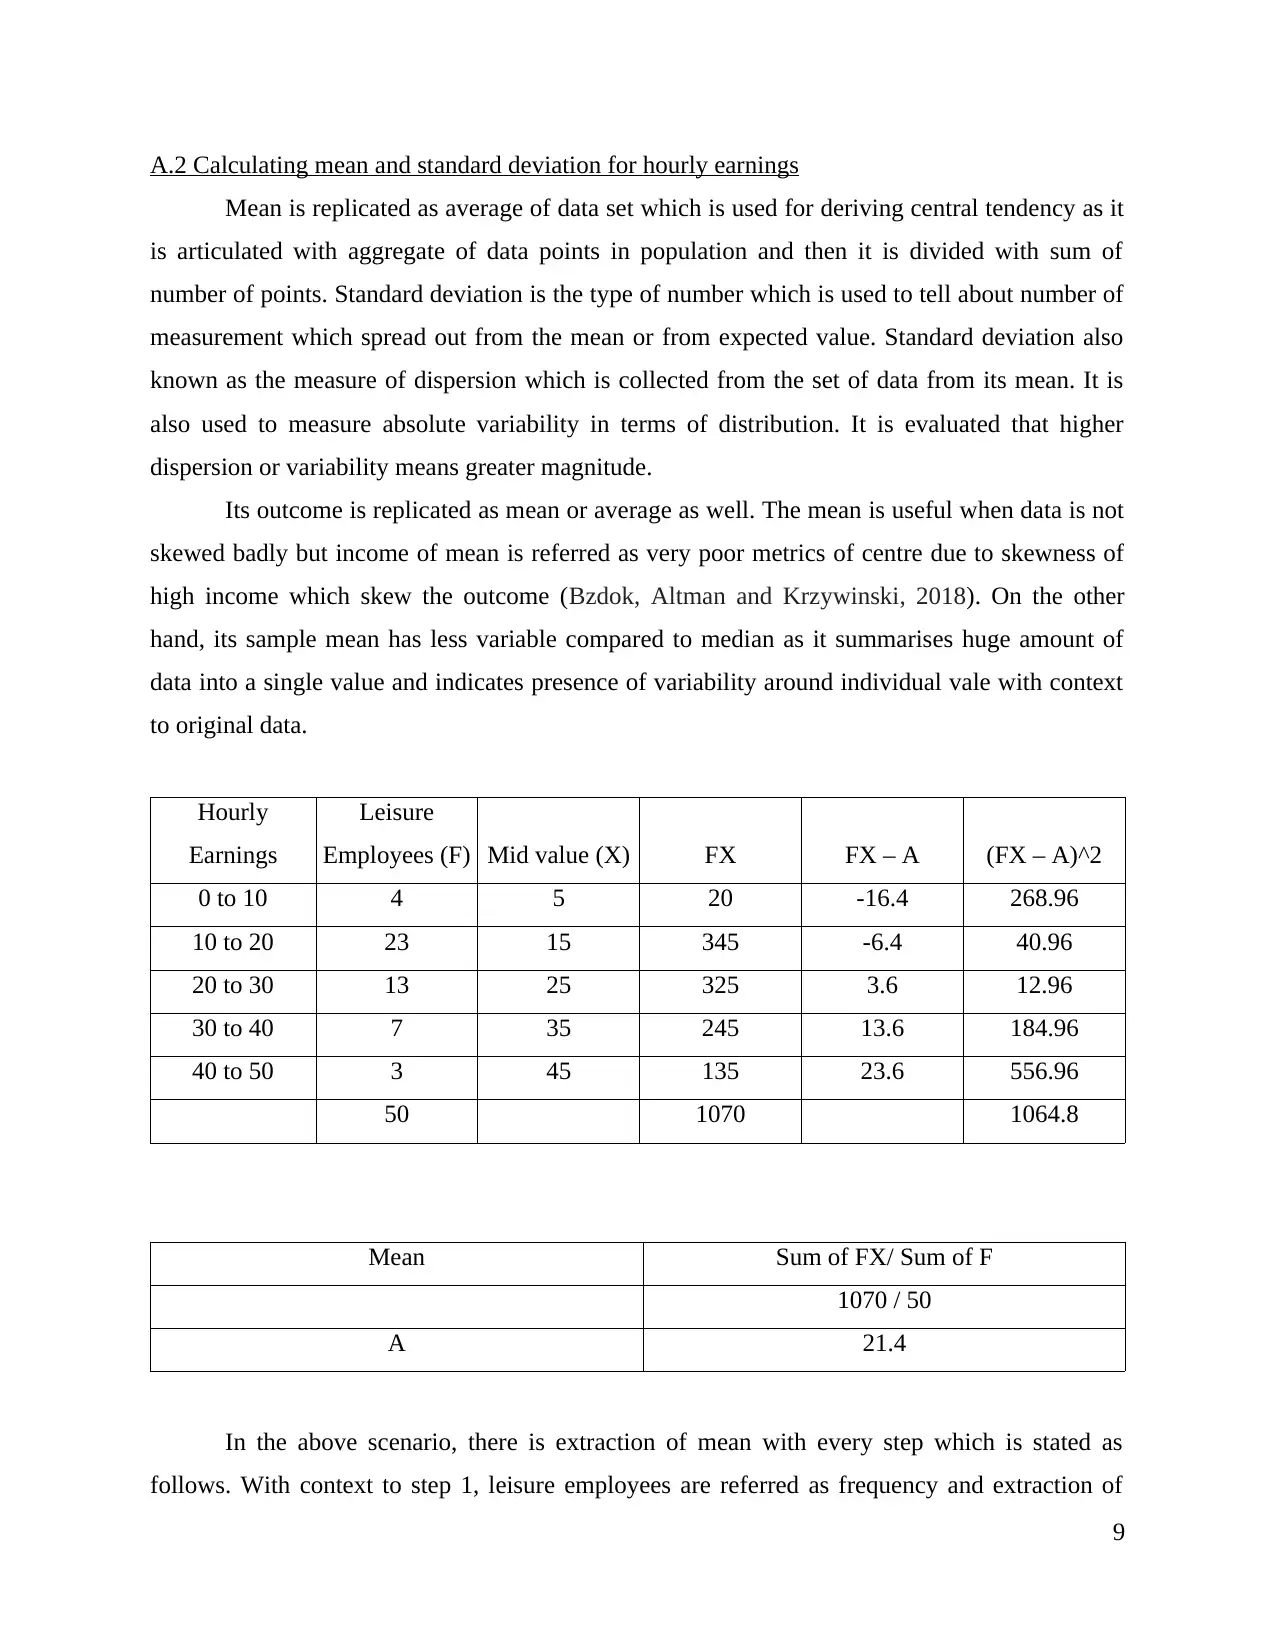
A.2 Calculating mean and standard deviation for hourly earnings
Mean is replicated as average of data set which is used for deriving central tendency as it
is articulated with aggregate of data points in population and then it is divided with sum of
number of points. Standard deviation is the type of number which is used to tell about number of
measurement which spread out from the mean or from expected value. Standard deviation also
known as the measure of dispersion which is collected from the set of data from its mean. It is
also used to measure absolute variability in terms of distribution. It is evaluated that higher
dispersion or variability means greater magnitude.
Its outcome is replicated as mean or average as well. The mean is useful when data is not
skewed badly but income of mean is referred as very poor metrics of centre due to skewness of
high income which skew the outcome (Bzdok, Altman and Krzywinski, 2018). On the other
hand, its sample mean has less variable compared to median as it summarises huge amount of
data into a single value and indicates presence of variability around individual vale with context
to original data.
Hourly
Earnings
Leisure
Employees (F) Mid value (X) FX FX – A (FX – A)^2
0 to 10 4 5 20 -16.4 268.96
10 to 20 23 15 345 -6.4 40.96
20 to 30 13 25 325 3.6 12.96
30 to 40 7 35 245 13.6 184.96
40 to 50 3 45 135 23.6 556.96
50 1070 1064.8
Mean Sum of FX/ Sum of F
1070 / 50
A 21.4
In the above scenario, there is extraction of mean with every step which is stated as
follows. With context to step 1, leisure employees are referred as frequency and extraction of
9
mid value from interval is specified with addition of both interval and divided by 2 is named as
X. Further, there is extraction of FX which originates from multiplication of F and X. Thus,
mean calculation is derived from sum of FX divided from sum of F as 1070 divided by 50
respectively and mean as 21.4. It could be elaborated as measure of average distance among
values of data in specific data set along with mean.
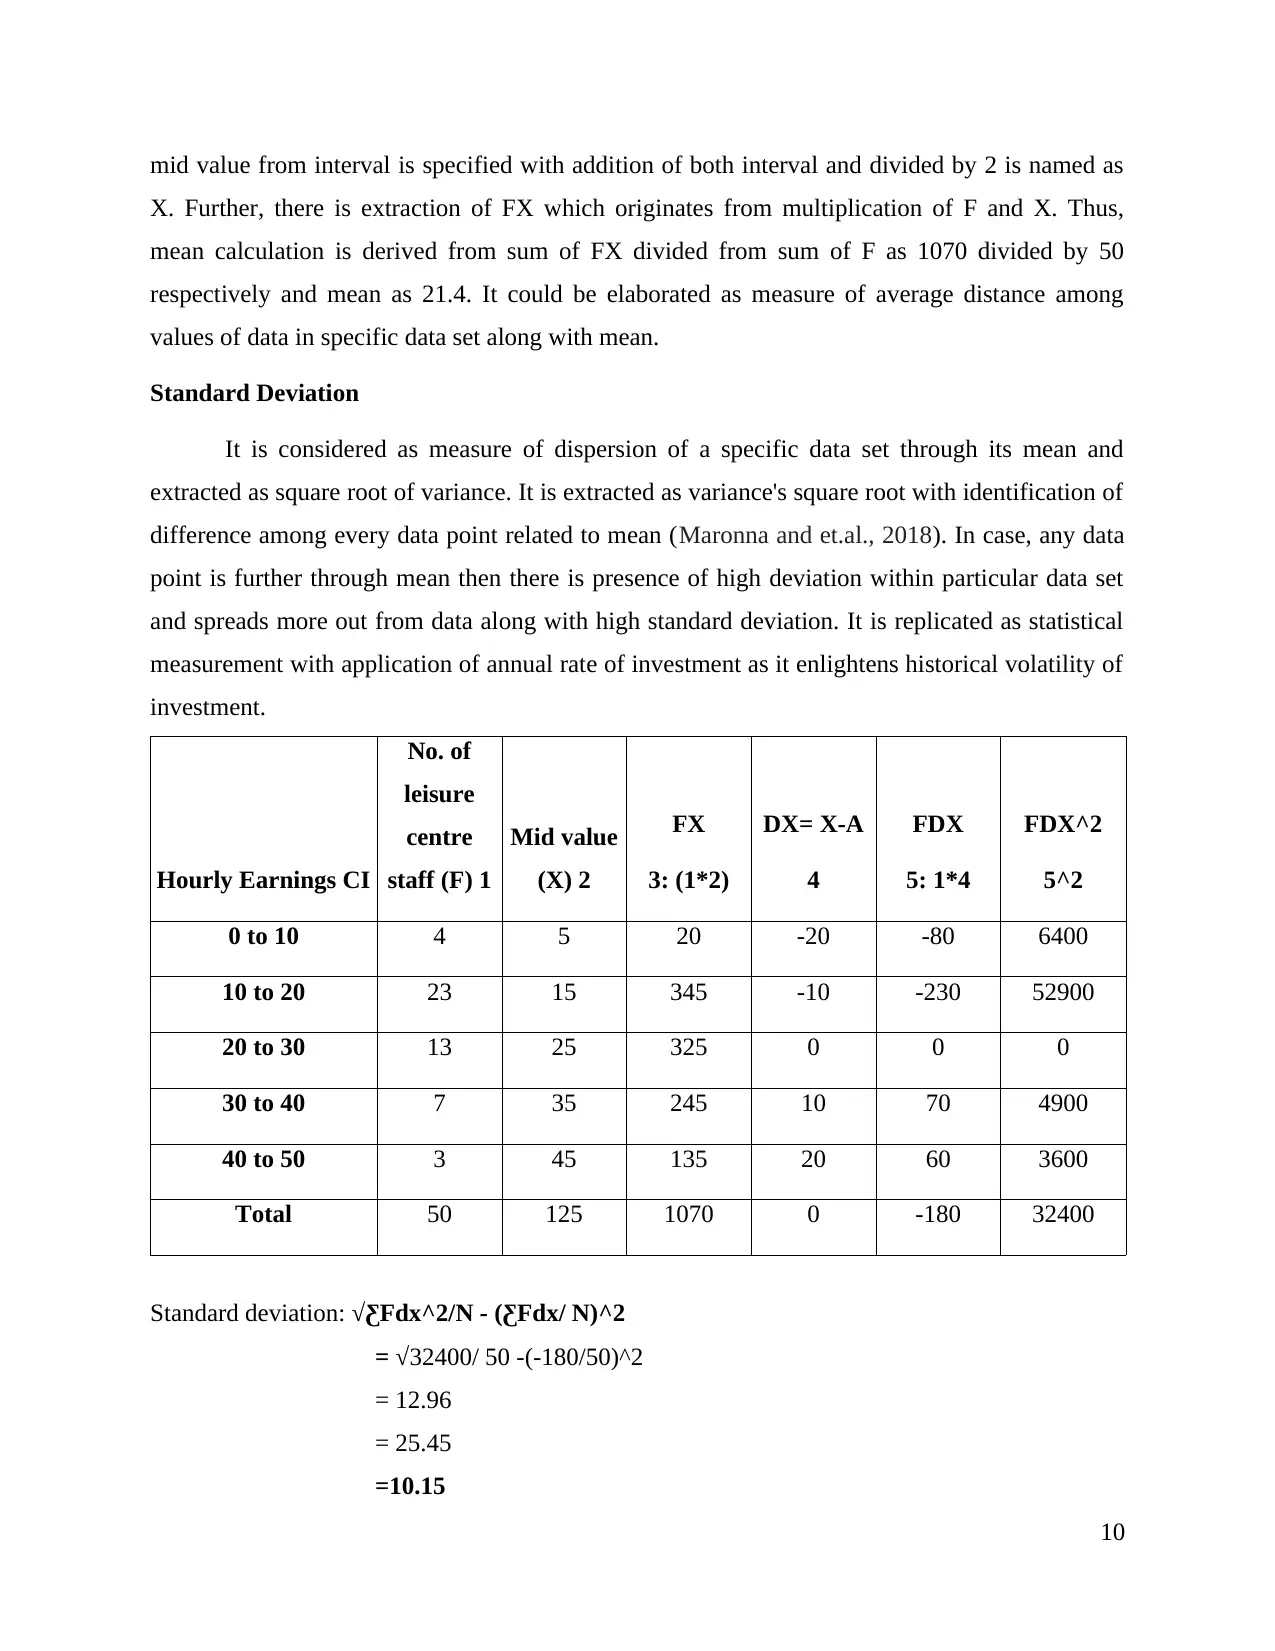
Standard Deviation
It is considered as measure of dispersion of a specific data set through its mean and
extracted as square root of variance. It is extracted as variance's square root with identification of
difference among every data point related to mean (Maronna and et.al., 2018). In case, any data
point is further through mean then there is presence of high deviation within particular data set
and spreads more out from data along with high standard deviation. It is replicated as statistical
measurement with application of annual rate of investment as it enlightens historical volatility of
investment.
Hourly Earnings CI
No. of
leisure
centre
staff (F) 1
Mid value
(X) 2
FX
3: (1*2)
DX= X-A
4
FDX
5: 1*4
FDX^2
5^2
0 to 10 4 5 20 -20 -80 6400
10 to 20 23 15 345 -10 -230 52900
20 to 30 13 25 325 0 0 0
30 to 40 7 35 245 10 70 4900
40 to 50 3 45 135 20 60 3600
Total 50 125 1070 0 -180 32400
Standard deviation: √ƸFdx^2/N - (ƸFdx/ N)^2
= √32400/ 50 -(-180/50)^2
= 12.96
= 25.45
=10.15
10
X. Further, there is extraction of FX which originates from multiplication of F and X. Thus,
mean calculation is derived from sum of FX divided from sum of F as 1070 divided by 50
respectively and mean as 21.4. It could be elaborated as measure of average distance among
values of data in specific data set along with mean.
Standard Deviation
It is considered as measure of dispersion of a specific data set through its mean and
extracted as square root of variance. It is extracted as variance's square root with identification of
difference among every data point related to mean (Maronna and et.al., 2018). In case, any data
point is further through mean then there is presence of high deviation within particular data set
and spreads more out from data along with high standard deviation. It is replicated as statistical
measurement with application of annual rate of investment as it enlightens historical volatility of
investment.
Hourly Earnings CI
No. of
leisure
centre
staff (F) 1
Mid value
(X) 2
FX
3: (1*2)
DX= X-A
4
FDX
5: 1*4
FDX^2
5^2
0 to 10 4 5 20 -20 -80 6400
10 to 20 23 15 345 -10 -230 52900
20 to 30 13 25 325 0 0 0
30 to 40 7 35 245 10 70 4900
40 to 50 3 45 135 20 60 3600
Total 50 125 1070 0 -180 32400
Standard deviation: √ƸFdx^2/N - (ƸFdx/ N)^2
= √32400/ 50 -(-180/50)^2
= 12.96
= 25.45
=10.15
10
⊘ This is a preview!⊘
Do you want full access?
Subscribe today to unlock all pages.
Trusted by 1+ million students worldwide
1 out of 18
Related Documents


Your All-in-One AI-Powered Toolkit for Academic Success.
+13062052269
info@desklib.com
Available 24*7 on WhatsApp / Email
![[object Object]](/_next/static/media/star-bottom.7253800d.svg)
Unlock your academic potential
Copyright © 2020–2026 A2Z Services. All Rights Reserved. Developed and managed by ZUCOL.