Estimating Male and Female Earnings in Private Sector
VerifiedAdded on 2021/01/01
|14
|2712
|372
AI Summary
a determination of male and female earnings in public sector 1 1 B determination of male and female earnings in private sector 2 1 C Presenting earning time chart for different group from year 2009-2016 2 1.d Annual growth rate of earnings of each group4 ACTIVITY 23.8% 5 percentage 2.A.b Estimation of the median hourly earnings with the use of Ogive chart with quartile 5 2.A.b Determining the standard deviation and mean with regards to hourly earnings 7 2.B Presenting comparison on
Contribute Materials
Your contribution can guide someone’s learning journey. Share your
documents today.

STATISTICS FOR
MANAGEMENT
MANAGEMENT
Secure Best Marks with AI Grader
Need help grading? Try our AI Grader for instant feedback on your assignments.
Table of Contents
INTRODUCTION...........................................................................................................................1
ACTIVITY 1....................................................................................................................................1
1. a determination of male and female earnings in public sector................................................1
1 B determination of male and female earnings in private sector...............................................2
1 C Presenting earning time chart for different group from year 2009-2016.............................2
1.d Annual growth rate of earnings of each group......................................................................4
ACTIVITY 2....................................................................................................................................5
2.A.a Estimation of the median hourly earnings with the use of Ogive chart with quartile.......5
2.A.b Determining the standard deviation and mean with regards to hourly earnings...............7
2.B Presenting comparison on the earnings of London and Manchester region........................8
ACTIVITY 3....................................................................................................................................9
a. Calculation of economic order quantity..................................................................................9
b. Occurrence of order and cost.................................................................................................9
c. Calculation of inventory policy cost.......................................................................................9
d. Identification of the current service level................................................................................9
e. Determining the re-order level................................................................................................9
ACTIVITY 4....................................................................................................................................9
4.A Formulating charts for RPI, CPI and CHIP form 2007-2017..............................................9
4.B Formulating the O-give chart for cumulative % of leisure staff employee and hourly
earnings.....................................................................................................................................11
........................................................................................................................................................11
CONCLUSION..............................................................................................................................11
REFERENCES..............................................................................................................................12
INTRODUCTION
Business statistics can be defined as science of decision making in between the standing
uncertainties and it is used by the financial analysis under different disciplines such as financial
analysis, econometric, auditing, production and operations which includes service improvements
and marketing research. In the present report a detailed discussion related with earnings of male
and female employed in private and public sector. Along with this the earnings of leisure staff in
London area is determined with the use of Ogive chart. In the lase section of the report
comparison of the earning is two regions that is London and Manchester is identified
ACTIVITY 1
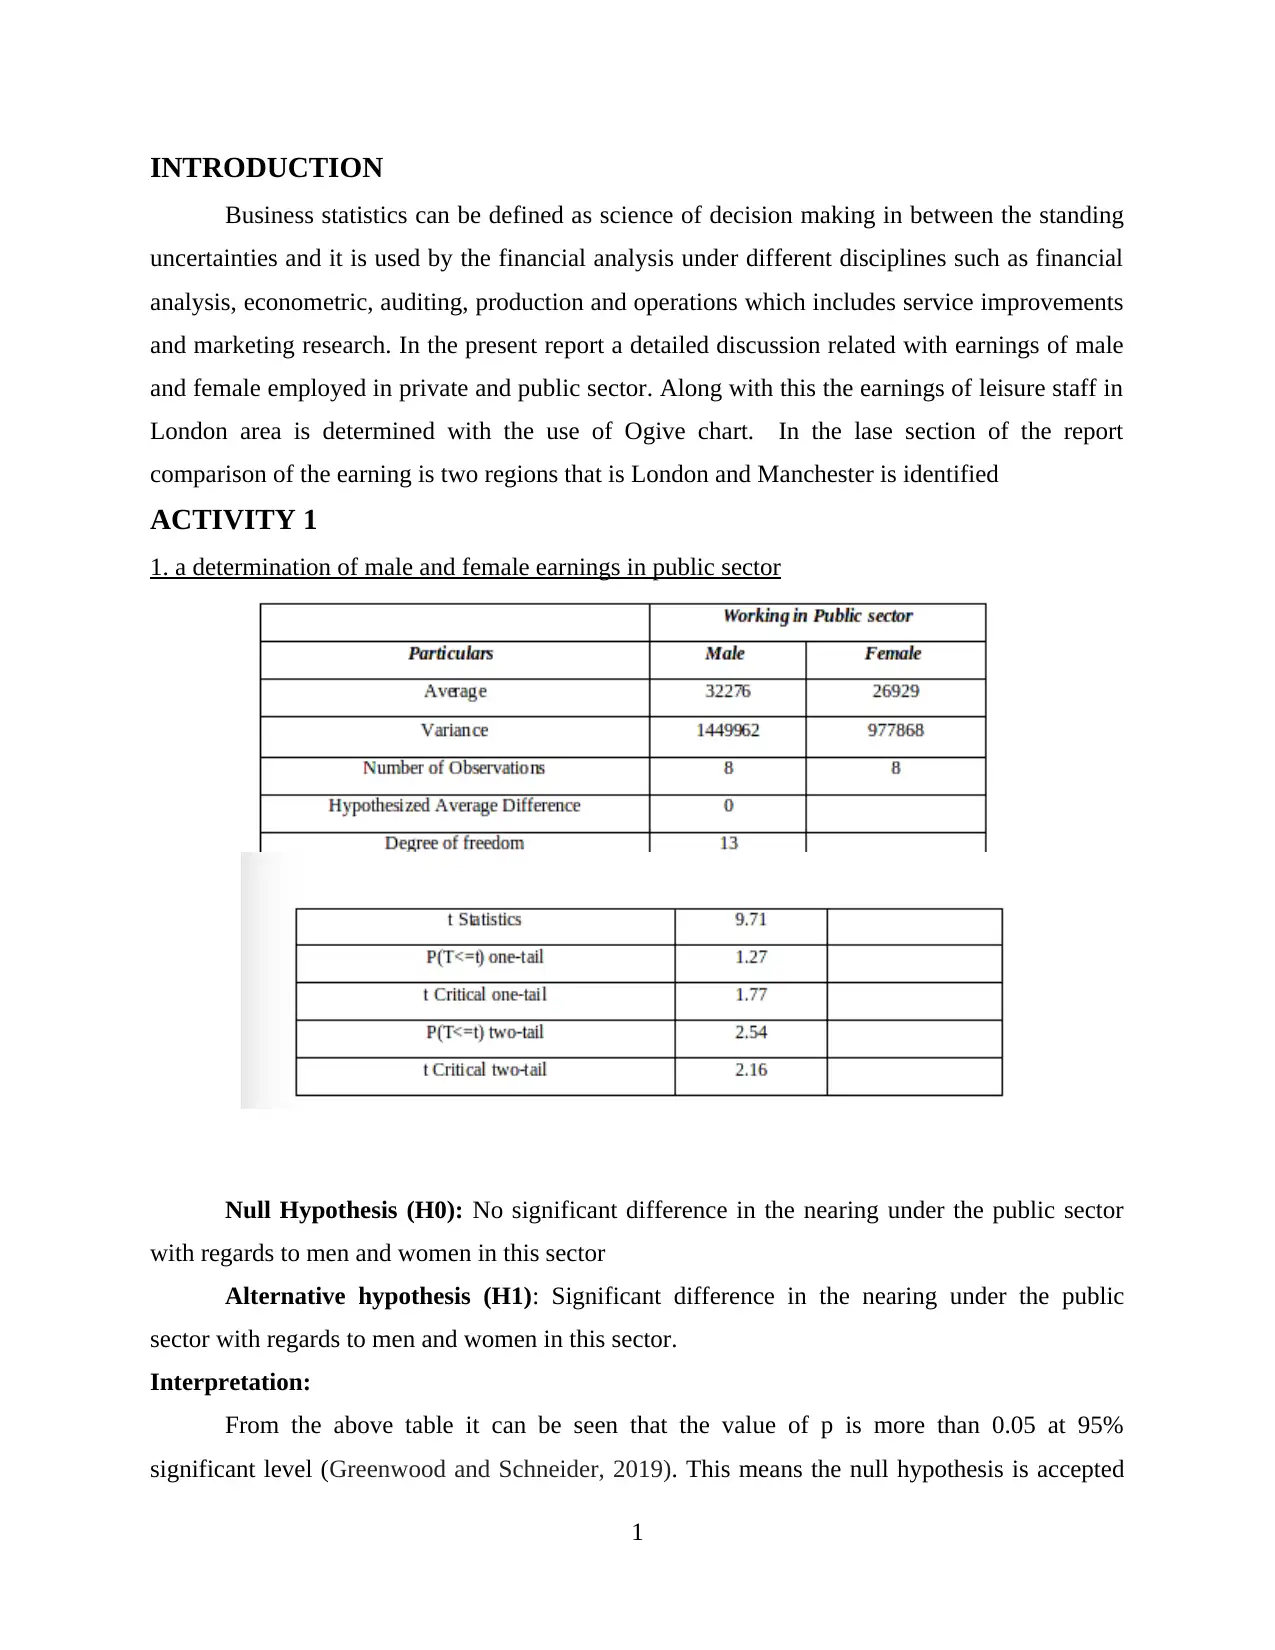
1. a determination of male and female earnings in public sector
Null Hypothesis (H0): No significant difference in the nearing under the public sector
with regards to men and women in this sector
Alternative hypothesis (H1): Significant difference in the nearing under the public
sector with regards to men and women in this sector.
Interpretation:
From the above table it can be seen that the value of p is more than 0.05 at 95%
significant level (Greenwood and Schneider, 2019). This means the null hypothesis is accepted
1
Business statistics can be defined as science of decision making in between the standing
uncertainties and it is used by the financial analysis under different disciplines such as financial
analysis, econometric, auditing, production and operations which includes service improvements
and marketing research. In the present report a detailed discussion related with earnings of male
and female employed in private and public sector. Along with this the earnings of leisure staff in
London area is determined with the use of Ogive chart. In the lase section of the report
comparison of the earning is two regions that is London and Manchester is identified
ACTIVITY 1
1. a determination of male and female earnings in public sector
Null Hypothesis (H0): No significant difference in the nearing under the public sector
with regards to men and women in this sector
Alternative hypothesis (H1): Significant difference in the nearing under the public
sector with regards to men and women in this sector.
Interpretation:
From the above table it can be seen that the value of p is more than 0.05 at 95%
significant level (Greenwood and Schneider, 2019). This means the null hypothesis is accepted
1
and it shows that there is no significant relation between the earnings of male and females in the
public sector.
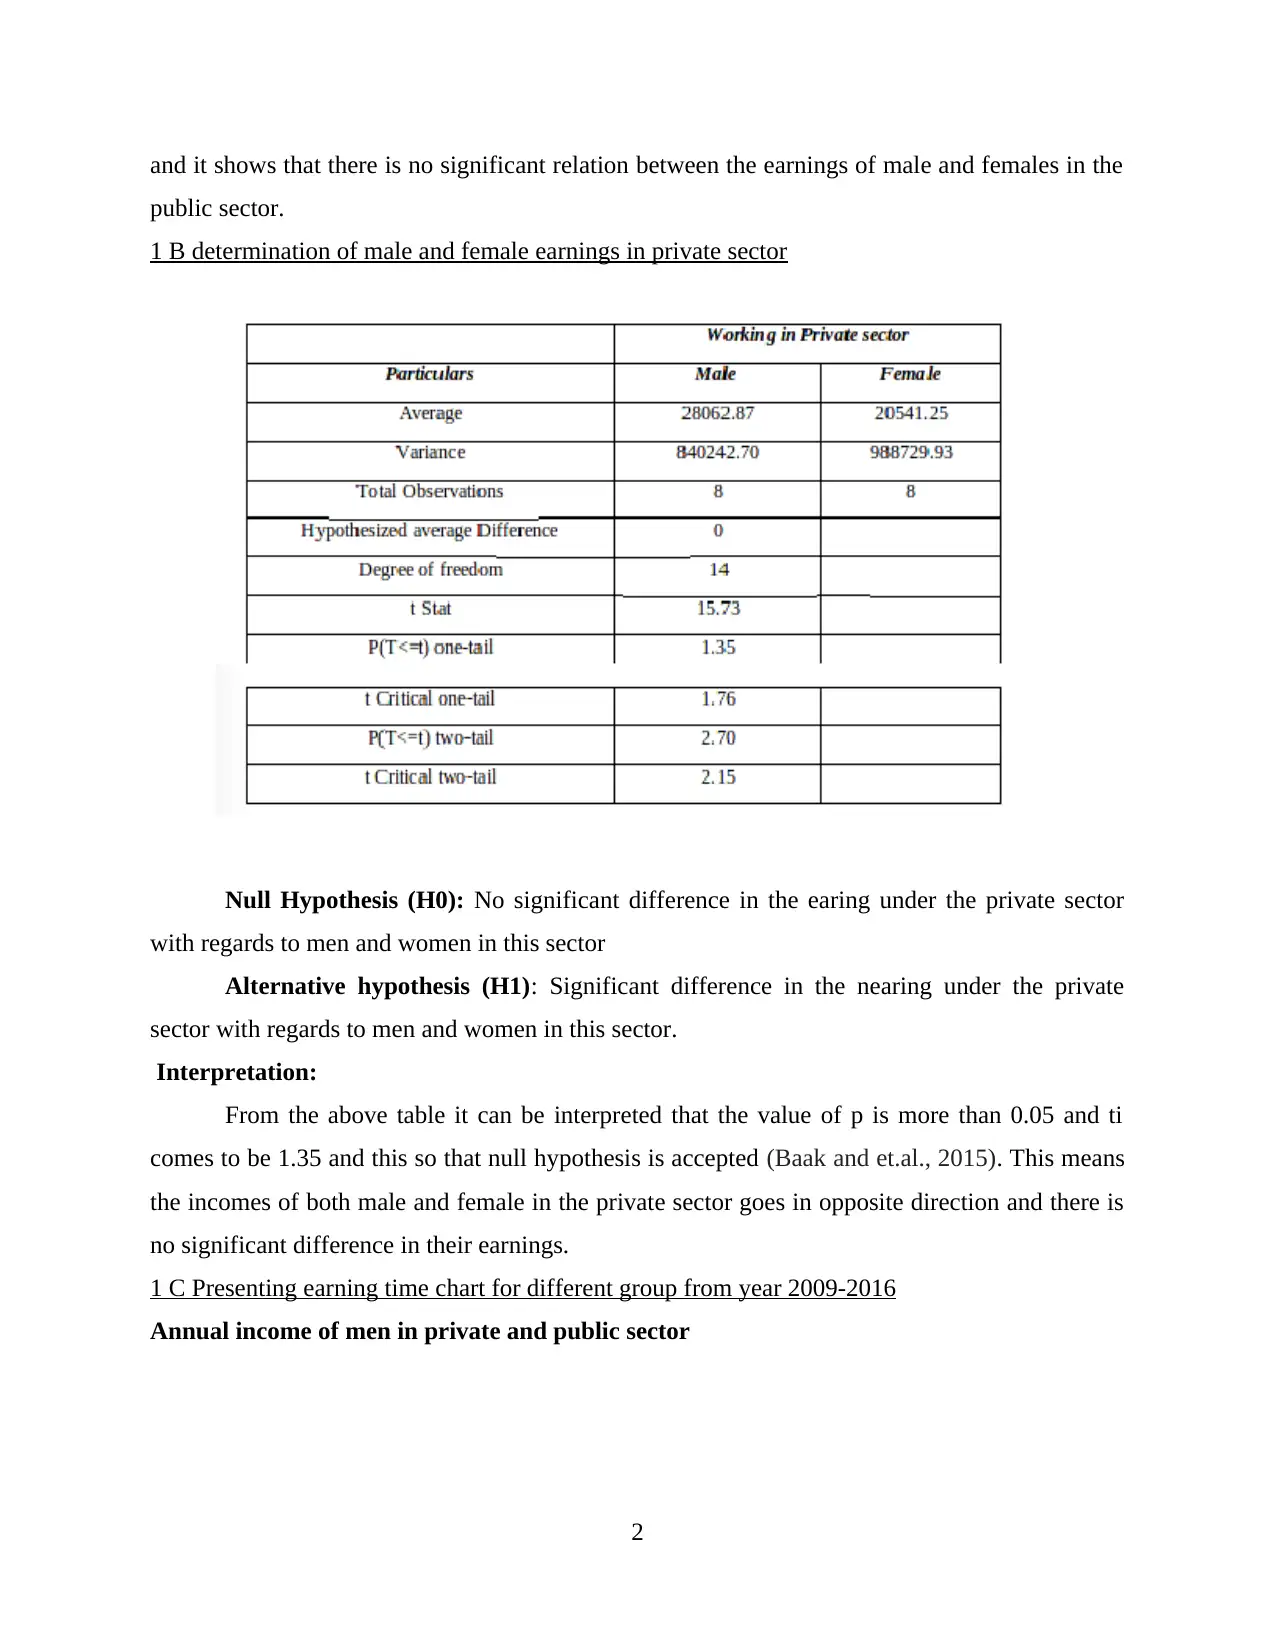
1 B determination of male and female earnings in private sector
Null Hypothesis (H0): No significant difference in the earing under the private sector
with regards to men and women in this sector
Alternative hypothesis (H1): Significant difference in the nearing under the private
sector with regards to men and women in this sector.
Interpretation:
From the above table it can be interpreted that the value of p is more than 0.05 and ti
comes to be 1.35 and this so that null hypothesis is accepted (Baak and et.al., 2015). This means
the incomes of both male and female in the private sector goes in opposite direction and there is
no significant difference in their earnings.
1 C Presenting earning time chart for different group from year 2009-2016
Annual income of men in private and public sector
2
public sector.
1 B determination of male and female earnings in private sector
Null Hypothesis (H0): No significant difference in the earing under the private sector
with regards to men and women in this sector
Alternative hypothesis (H1): Significant difference in the nearing under the private
sector with regards to men and women in this sector.
Interpretation:
From the above table it can be interpreted that the value of p is more than 0.05 and ti
comes to be 1.35 and this so that null hypothesis is accepted (Baak and et.al., 2015). This means
the incomes of both male and female in the private sector goes in opposite direction and there is
no significant difference in their earnings.
1 C Presenting earning time chart for different group from year 2009-2016
Annual income of men in private and public sector
2
Secure Best Marks with AI Grader
Need help grading? Try our AI Grader for instant feedback on your assignments.
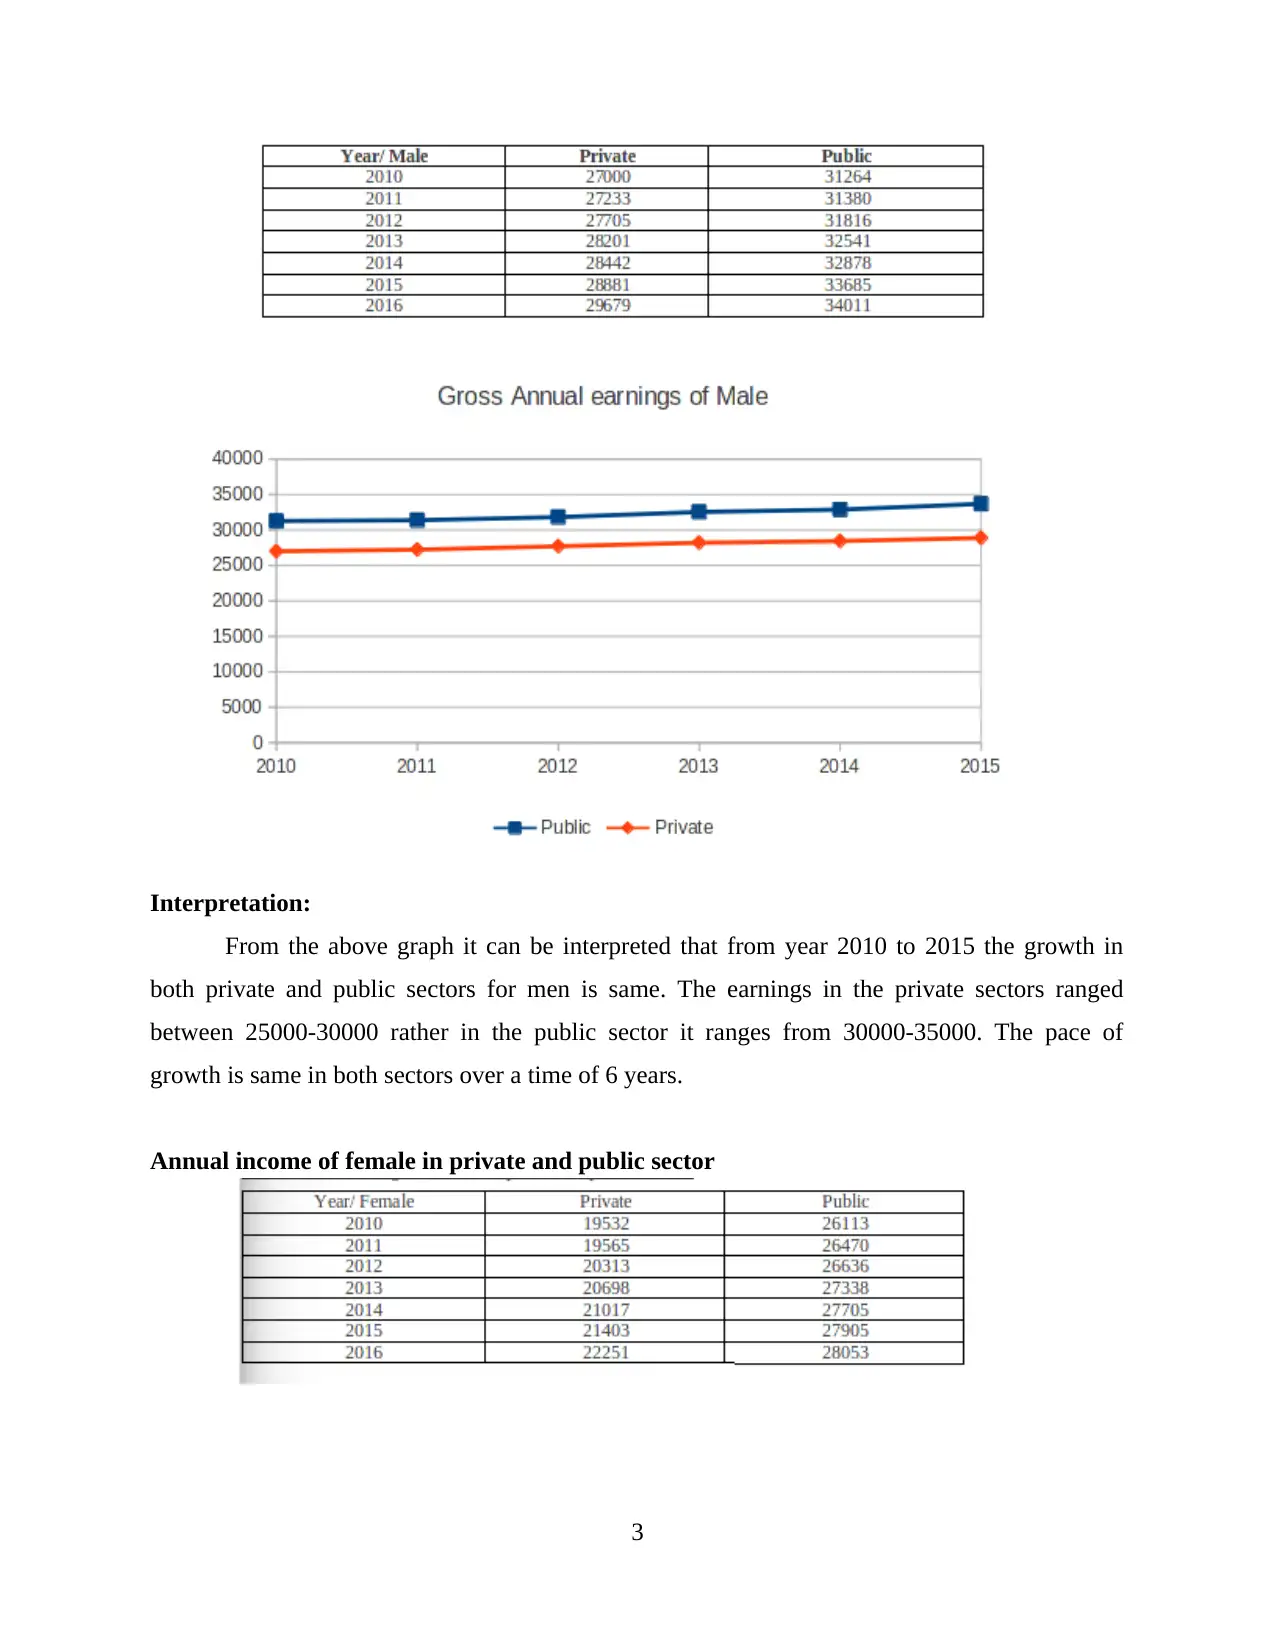
Interpretation:
From the above graph it can be interpreted that from year 2010 to 2015 the growth in
both private and public sectors for men is same. The earnings in the private sectors ranged
between 25000-30000 rather in the public sector it ranges from 30000-35000. The pace of
growth is same in both sectors over a time of 6 years.
Annual income of female in private and public sector
3
Interpretation:
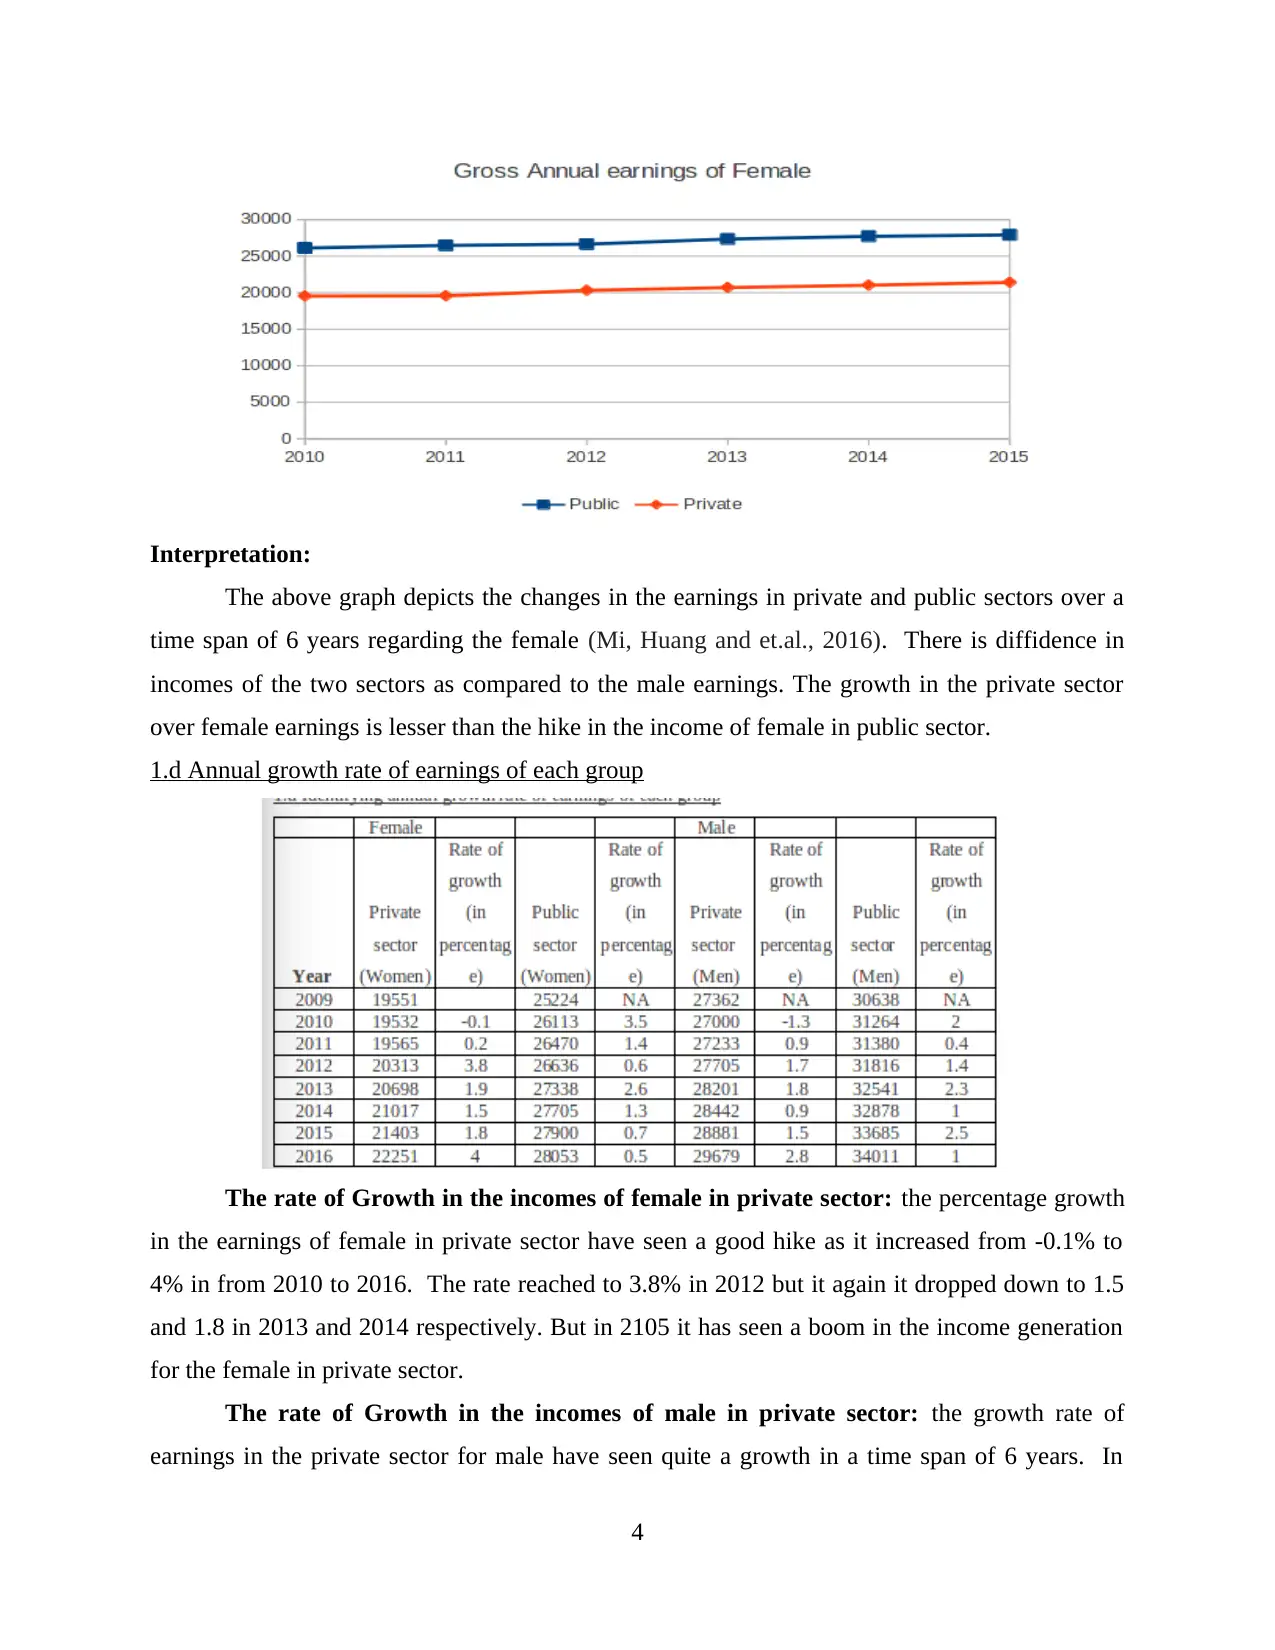
The above graph depicts the changes in the earnings in private and public sectors over a
time span of 6 years regarding the female (Mi, Huang and et.al., 2016). There is diffidence in
incomes of the two sectors as compared to the male earnings. The growth in the private sector
over female earnings is lesser than the hike in the income of female in public sector.
1.d Annual growth rate of earnings of each group
The rate of Growth in the incomes of female in private sector: the percentage growth
in the earnings of female in private sector have seen a good hike as it increased from -0.1% to
4% in from 2010 to 2016. The rate reached to 3.8% in 2012 but it again it dropped down to 1.5
and 1.8 in 2013 and 2014 respectively. But in 2105 it has seen a boom in the income generation
for the female in private sector.
The rate of Growth in the incomes of male in private sector: the growth rate of
earnings in the private sector for male have seen quite a growth in a time span of 6 years. In
4
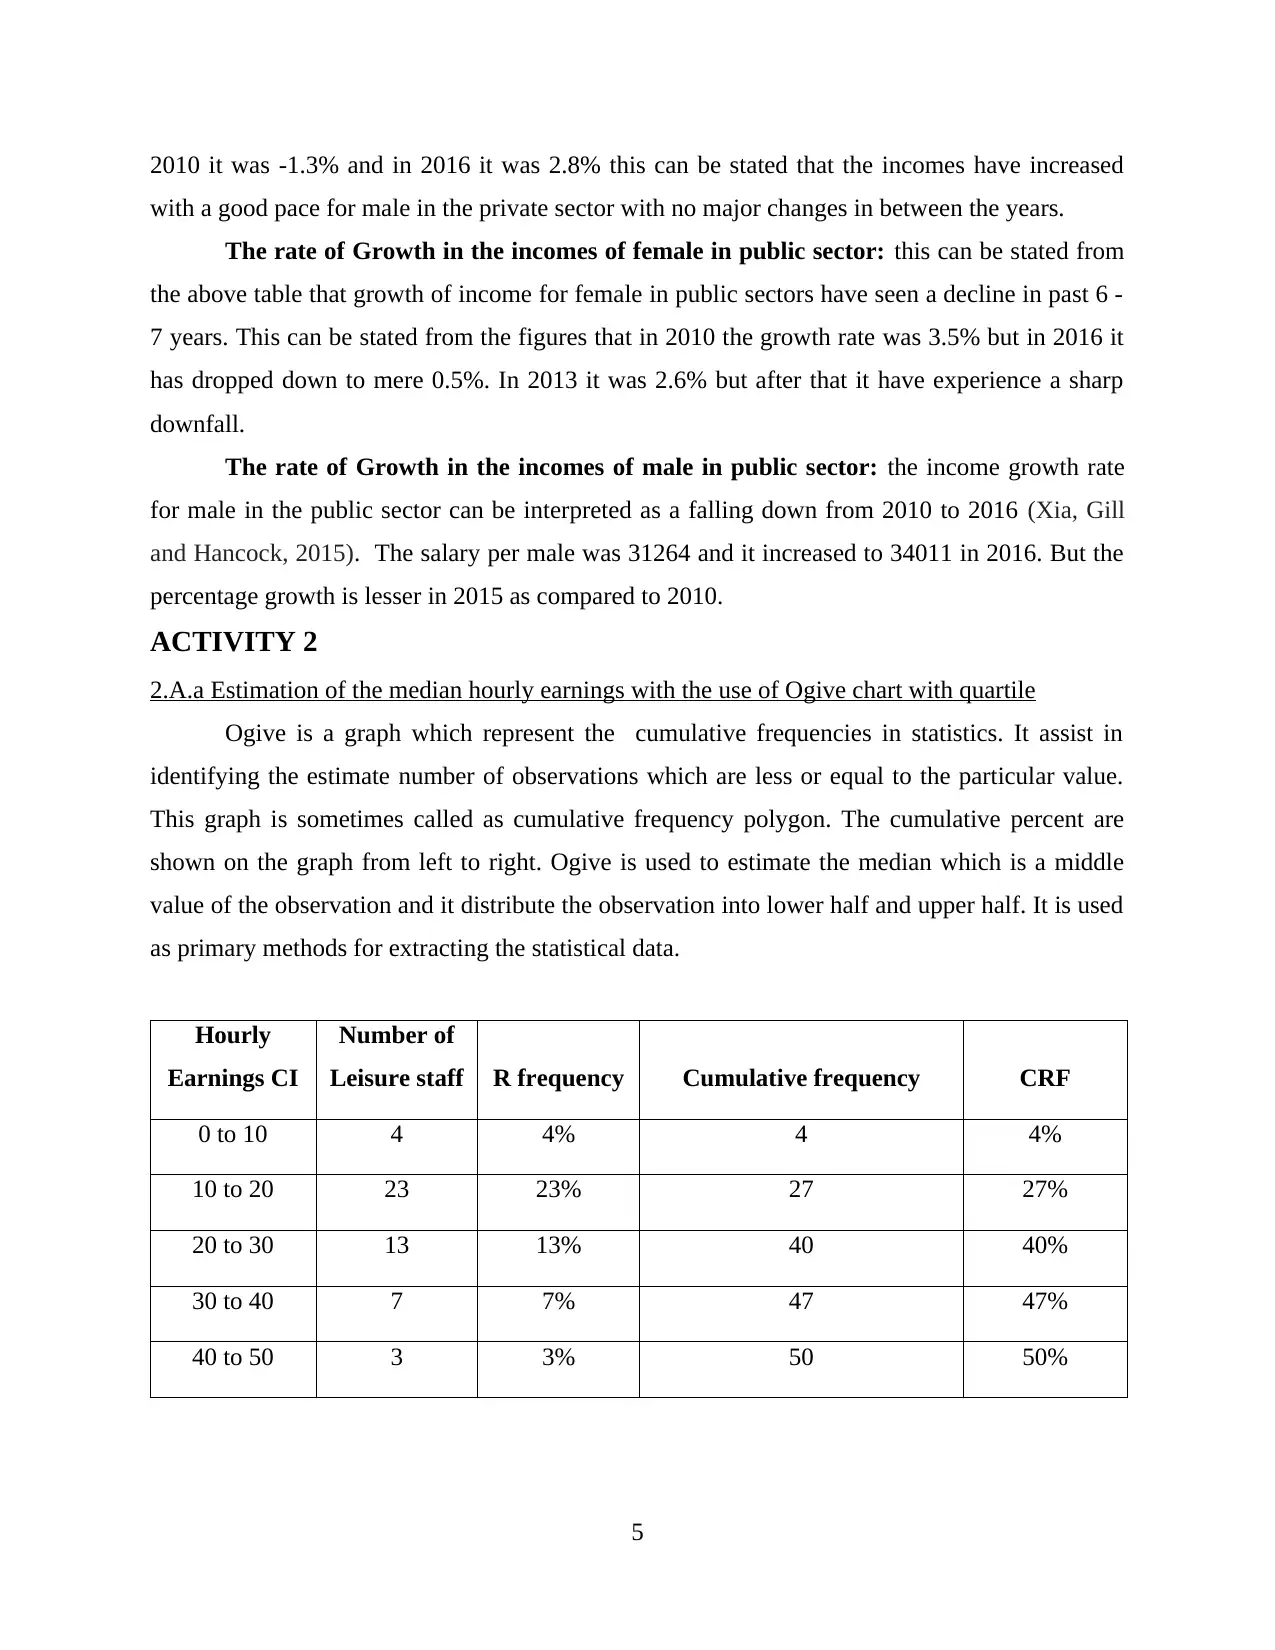
2010 it was -1.3% and in 2016 it was 2.8% this can be stated that the incomes have increased
with a good pace for male in the private sector with no major changes in between the years.
The rate of Growth in the incomes of female in public sector: this can be stated from
the above table that growth of income for female in public sectors have seen a decline in past 6 -
7 years. This can be stated from the figures that in 2010 the growth rate was 3.5% but in 2016 it
has dropped down to mere 0.5%. In 2013 it was 2.6% but after that it have experience a sharp
downfall.
The rate of Growth in the incomes of male in public sector: the income growth rate
for male in the public sector can be interpreted as a falling down from 2010 to 2016 (Xia, Gill
and Hancock, 2015). The salary per male was 31264 and it increased to 34011 in 2016. But the
percentage growth is lesser in 2015 as compared to 2010.
ACTIVITY 2
2.A.a Estimation of the median hourly earnings with the use of Ogive chart with quartile
Ogive is a graph which represent the cumulative frequencies in statistics. It assist in
identifying the estimate number of observations which are less or equal to the particular value.
This graph is sometimes called as cumulative frequency polygon. The cumulative percent are
shown on the graph from left to right. Ogive is used to estimate the median which is a middle
value of the observation and it distribute the observation into lower half and upper half. It is used
as primary methods for extracting the statistical data.
Hourly
Earnings CI
Number of
Leisure staff R frequency Cumulative frequency CRF
0 to 10 4 4% 4 4%
10 to 20 23 23% 27 27%
20 to 30 13 13% 40 40%
30 to 40 7 7% 47 47%
40 to 50 3 3% 50 50%
5
Paraphrase This Document
Need a fresh take? Get an instant paraphrase of this document with our AI Paraphraser
Hourly earnings Leisure staff (F) Cumulative Frequency (Cf)
0 to 10 4 4
10 to 20 23 27
20 to 30 13 40
30 to 40 7 47
40 to 50 3 50
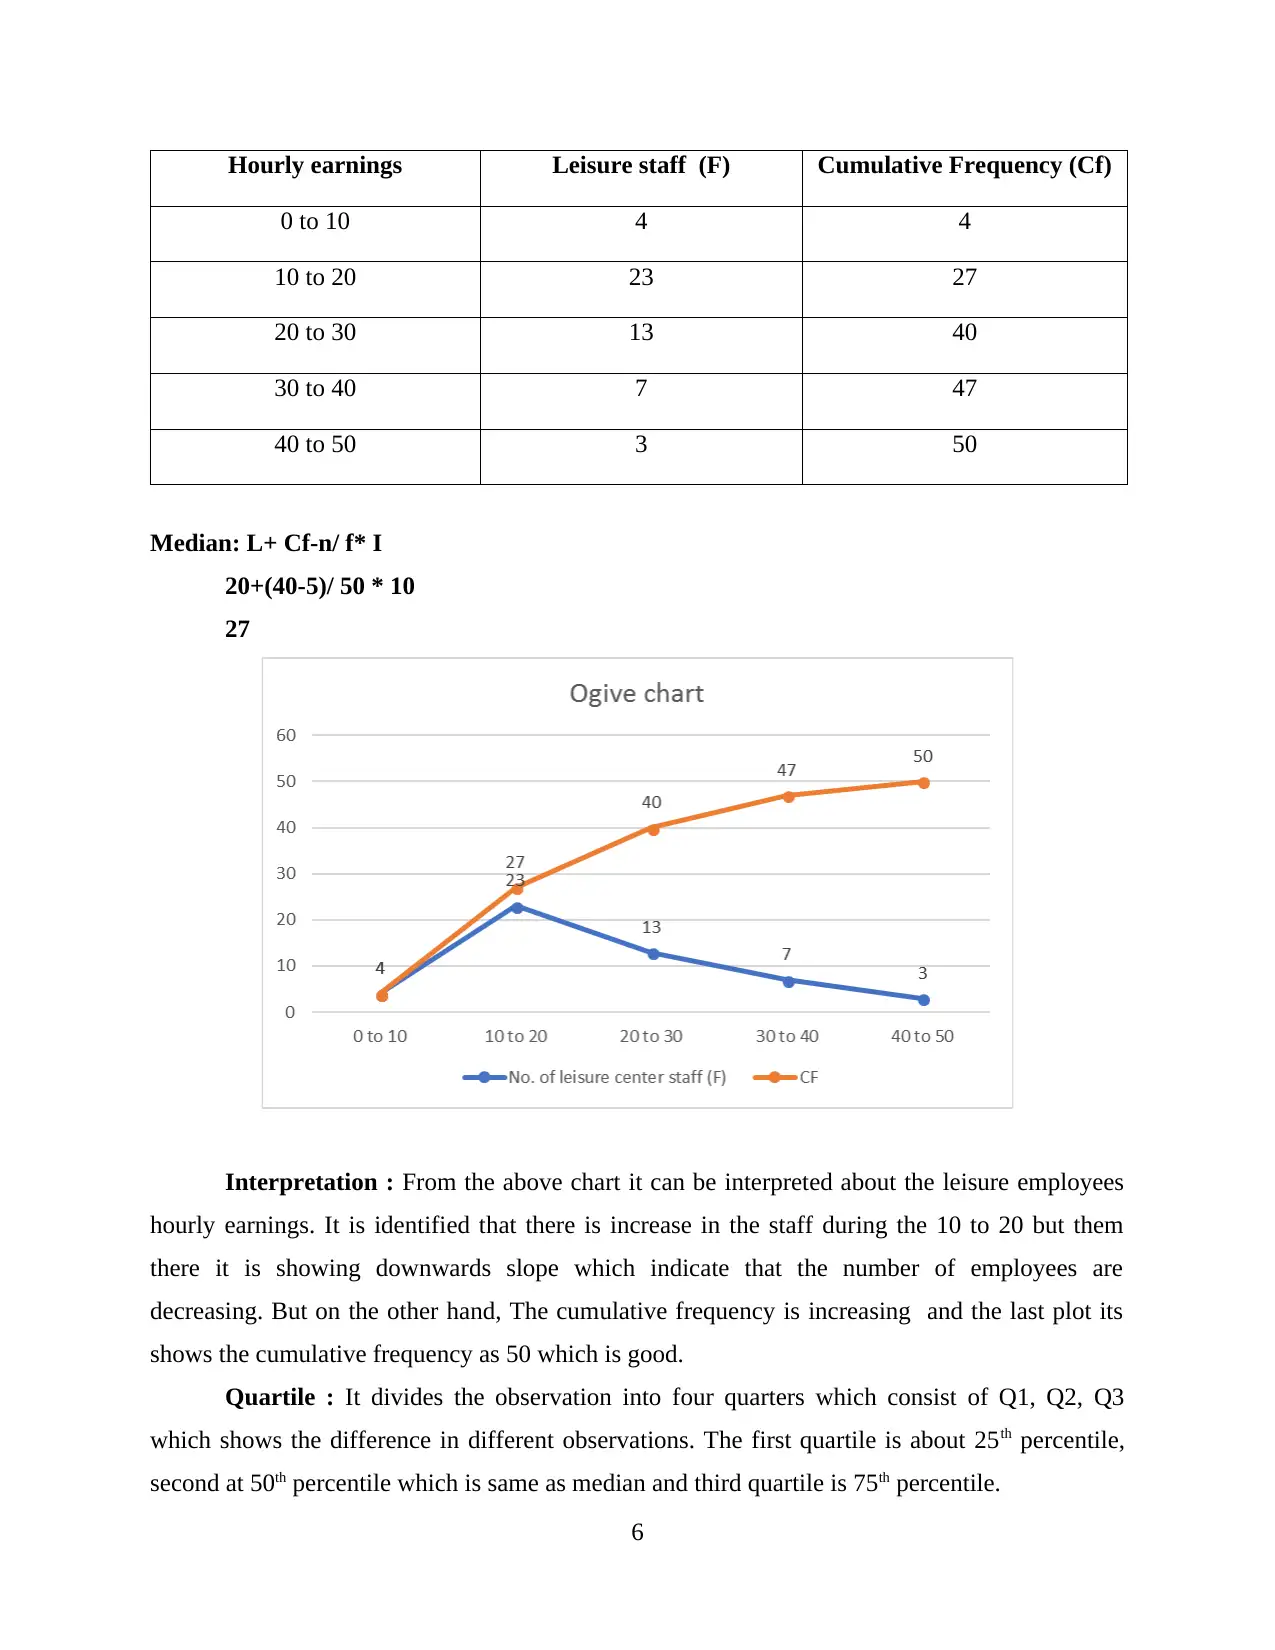
Median: L+ Cf-n/ f* I
20+(40-5)/ 50 * 10
27
Interpretation : From the above chart it can be interpreted about the leisure employees
hourly earnings. It is identified that there is increase in the staff during the 10 to 20 but them
there it is showing downwards slope which indicate that the number of employees are
decreasing. But on the other hand, The cumulative frequency is increasing and the last plot its
shows the cumulative frequency as 50 which is good.
Quartile : It divides the observation into four quarters which consist of Q1, Q2, Q3
which shows the difference in different observations. The first quartile is about 25th percentile,
second at 50th percentile which is same as median and third quartile is 75th percentile.
6
0 to 10 4 4
10 to 20 23 27
20 to 30 13 40
30 to 40 7 47
40 to 50 3 50
Median: L+ Cf-n/ f* I
20+(40-5)/ 50 * 10
27
Interpretation : From the above chart it can be interpreted about the leisure employees
hourly earnings. It is identified that there is increase in the staff during the 10 to 20 but them
there it is showing downwards slope which indicate that the number of employees are
decreasing. But on the other hand, The cumulative frequency is increasing and the last plot its
shows the cumulative frequency as 50 which is good.
Quartile : It divides the observation into four quarters which consist of Q1, Q2, Q3
which shows the difference in different observations. The first quartile is about 25th percentile,
second at 50th percentile which is same as median and third quartile is 75th percentile.
6
Range of Hourly Earnings (CI)
Number of Leisure staff
(Frequency)
0 to 10 4
10 to 20 23
20 to 30 13
30 to 40 7
40 to 50 3
Quartile result
1 4
2 7
3 13
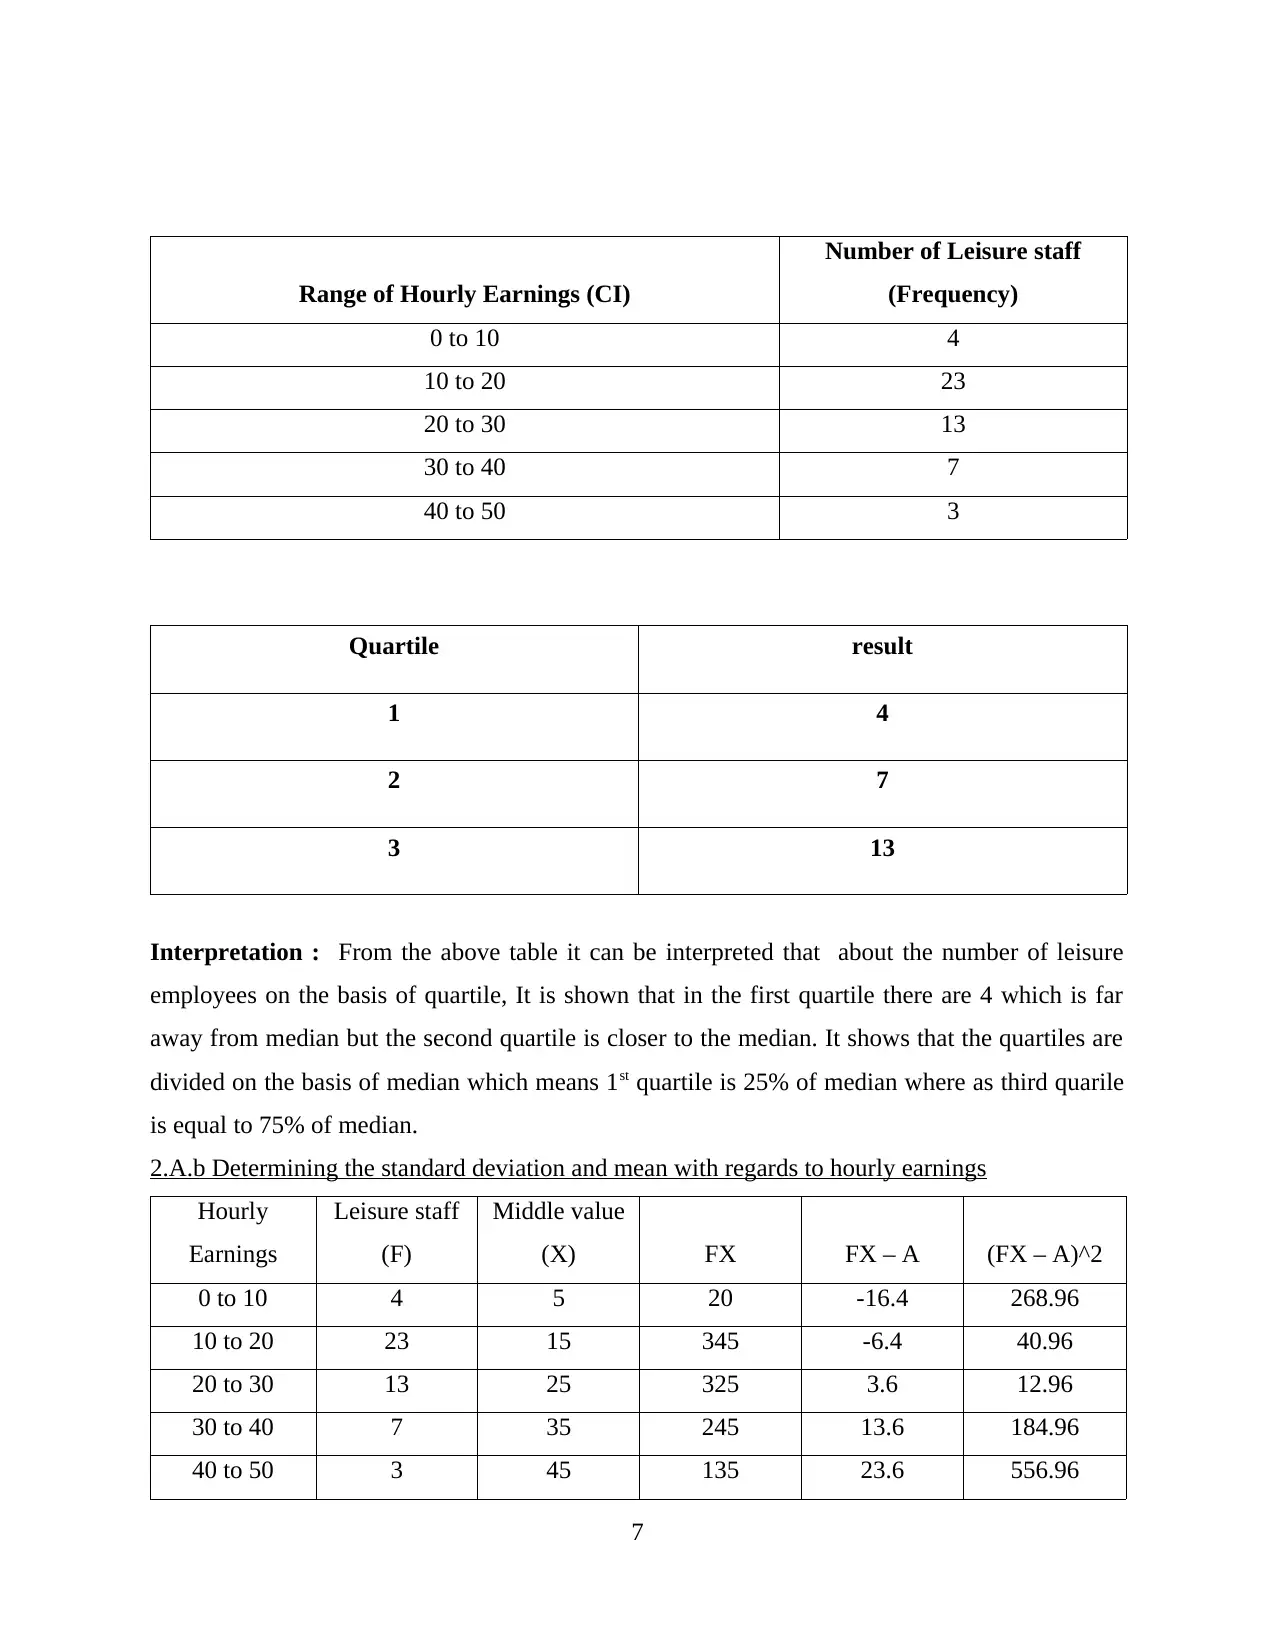
Interpretation : From the above table it can be interpreted that about the number of leisure
employees on the basis of quartile, It is shown that in the first quartile there are 4 which is far
away from median but the second quartile is closer to the median. It shows that the quartiles are
divided on the basis of median which means 1st quartile is 25% of median where as third quarile
is equal to 75% of median.
2.A.b Determining the standard deviation and mean with regards to hourly earnings
Hourly
Earnings
Leisure staff
(F)
Middle value
(X) FX FX – A (FX – A)^2
0 to 10 4 5 20 -16.4 268.96
10 to 20 23 15 345 -6.4 40.96
20 to 30 13 25 325 3.6 12.96
30 to 40 7 35 245 13.6 184.96
40 to 50 3 45 135 23.6 556.96
7
Number of Leisure staff
(Frequency)
0 to 10 4
10 to 20 23
20 to 30 13
30 to 40 7
40 to 50 3
Quartile result
1 4
2 7
3 13
Interpretation : From the above table it can be interpreted that about the number of leisure
employees on the basis of quartile, It is shown that in the first quartile there are 4 which is far
away from median but the second quartile is closer to the median. It shows that the quartiles are
divided on the basis of median which means 1st quartile is 25% of median where as third quarile
is equal to 75% of median.
2.A.b Determining the standard deviation and mean with regards to hourly earnings
Hourly
Earnings
Leisure staff
(F)
Middle value
(X) FX FX – A (FX – A)^2
0 to 10 4 5 20 -16.4 268.96
10 to 20 23 15 345 -6.4 40.96
20 to 30 13 25 325 3.6 12.96
30 to 40 7 35 245 13.6 184.96
40 to 50 3 45 135 23.6 556.96
7
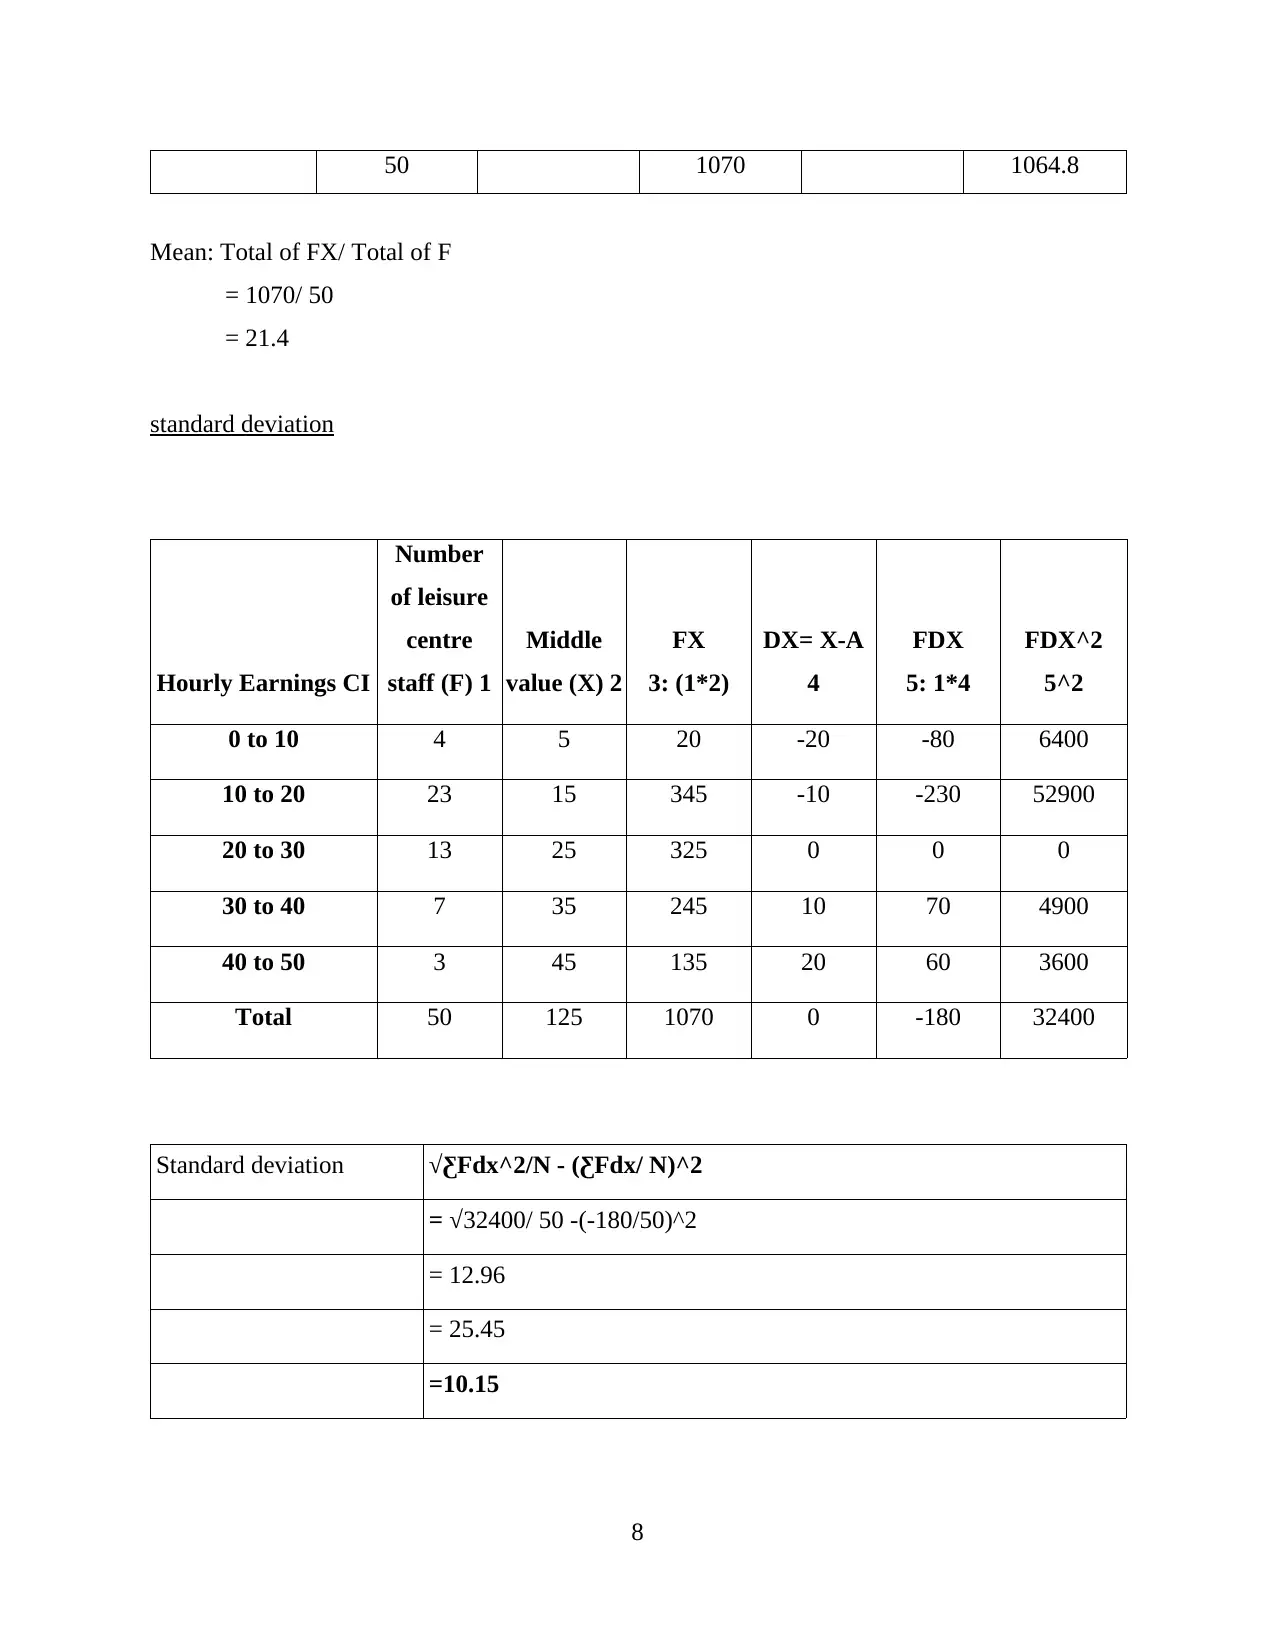
50 1070 1064.8
Mean: Total of FX/ Total of F
= 1070/ 50
= 21.4
standard deviation
Hourly Earnings CI
Number
of leisure
centre
staff (F) 1
Middle
value (X) 2
FX
3: (1*2)
DX= X-A
4
FDX
5: 1*4
FDX^2
5^2
0 to 10 4 5 20 -20 -80 6400
10 to 20 23 15 345 -10 -230 52900
20 to 30 13 25 325 0 0 0
30 to 40 7 35 245 10 70 4900
40 to 50 3 45 135 20 60 3600
Total 50 125 1070 0 -180 32400
Standard deviation √ƸFdx^2/N - (ƸFdx/ N)^2
= √32400/ 50 -(-180/50)^2
= 12.96
= 25.45
=10.15
8
Secure Best Marks with AI Grader
Need help grading? Try our AI Grader for instant feedback on your assignments.
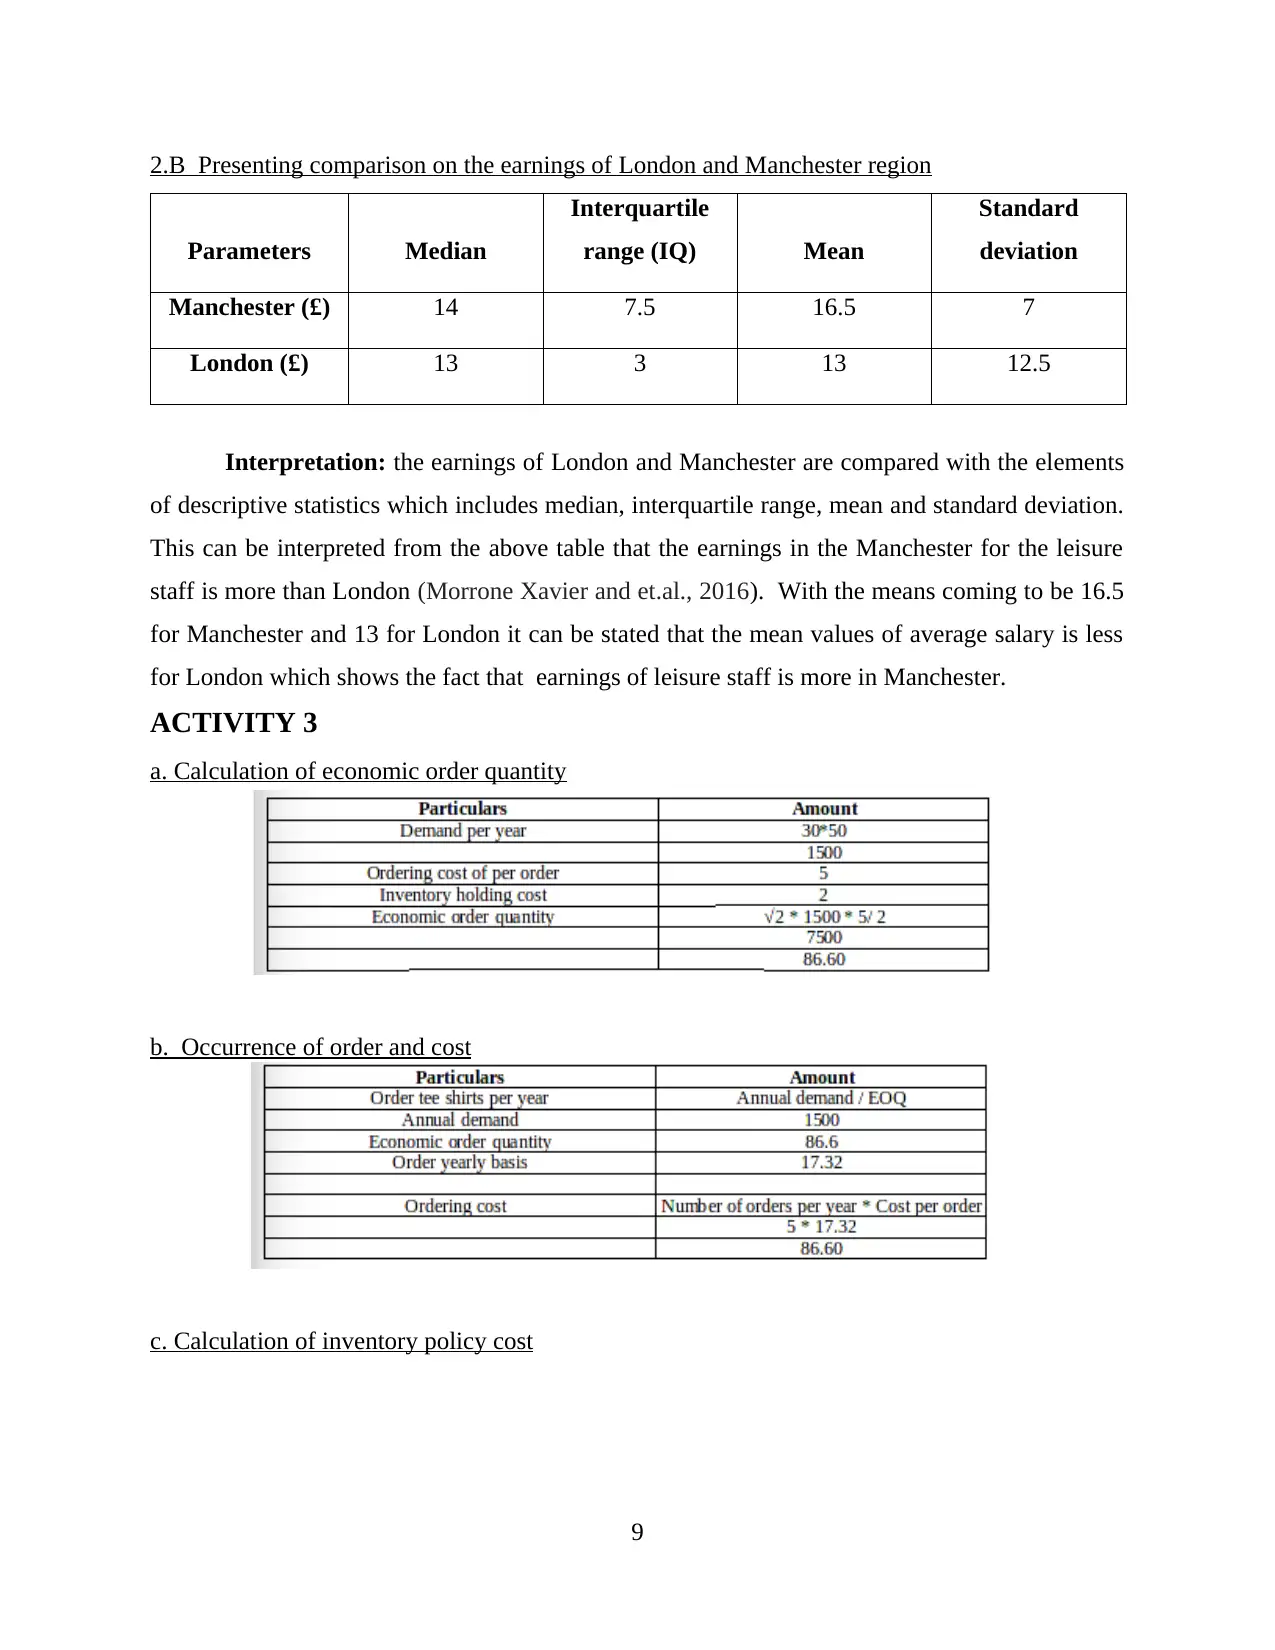
2.B Presenting comparison on the earnings of London and Manchester region
Parameters Median
Interquartile
range (IQ) Mean
Standard
deviation
Manchester (£) 14 7.5 16.5 7
London (£) 13 3 13 12.5
Interpretation: the earnings of London and Manchester are compared with the elements
of descriptive statistics which includes median, interquartile range, mean and standard deviation.
This can be interpreted from the above table that the earnings in the Manchester for the leisure
staff is more than London (Morrone Xavier and et.al., 2016). With the means coming to be 16.5
for Manchester and 13 for London it can be stated that the mean values of average salary is less
for London which shows the fact that earnings of leisure staff is more in Manchester.
ACTIVITY 3
a. Calculation of economic order quantity
b. Occurrence of order and cost
c. Calculation of inventory policy cost
9
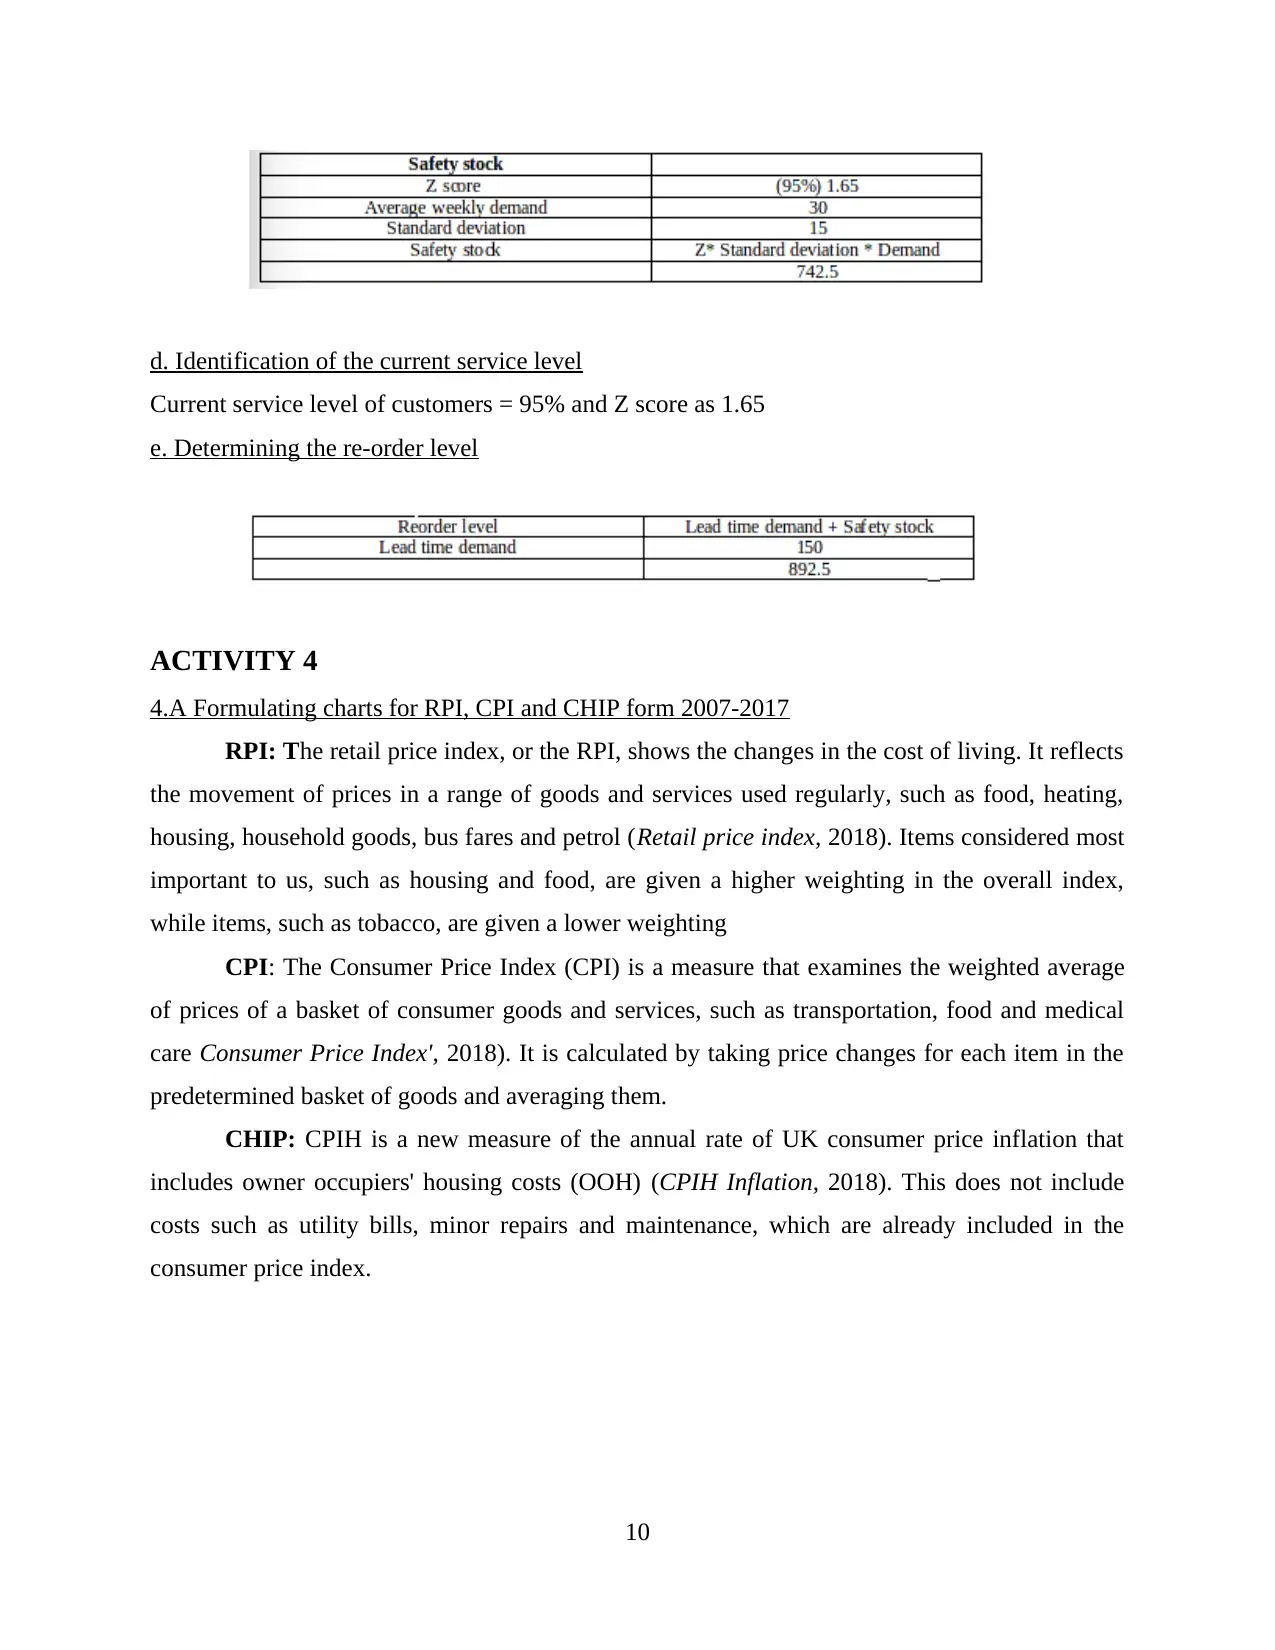
d. Identification of the current service level
Current service level of customers = 95% and Z score as 1.65
e. Determining the re-order level
ACTIVITY 4
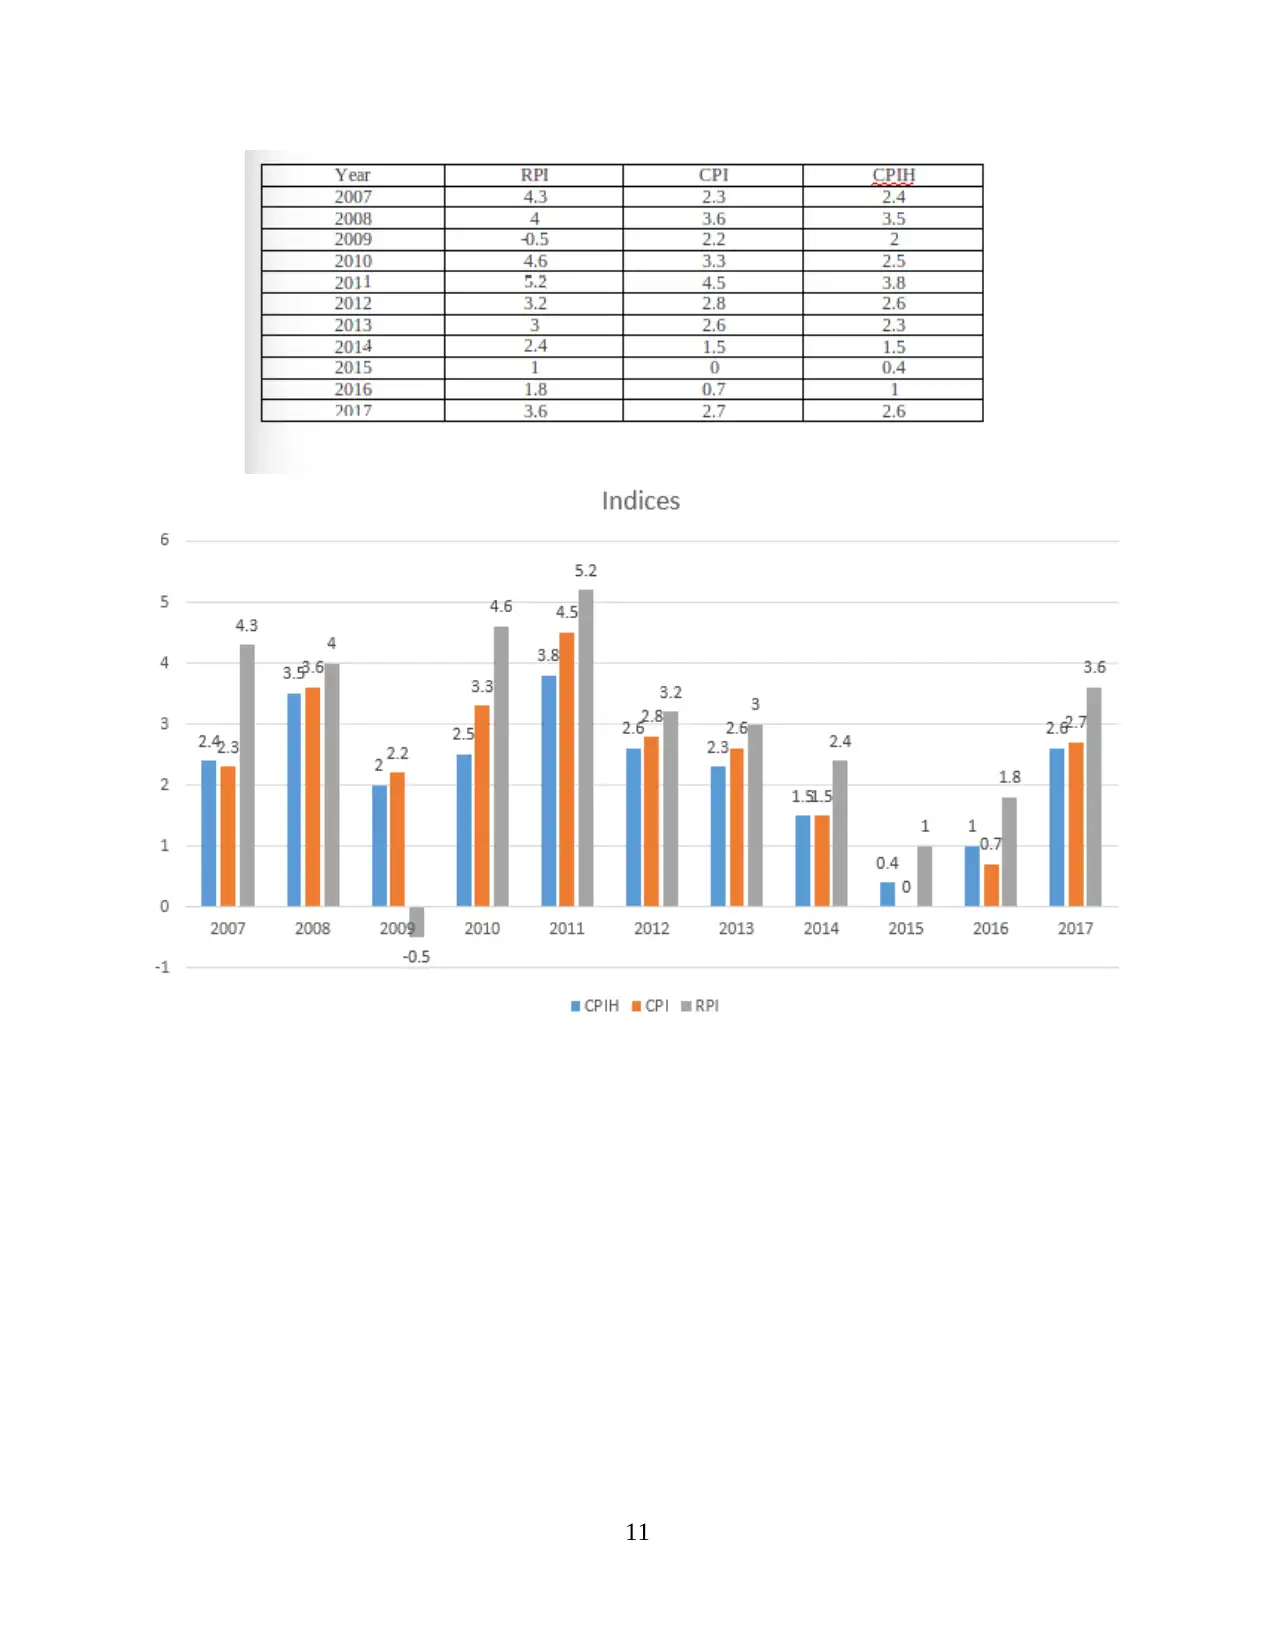
4.A Formulating charts for RPI, CPI and CHIP form 2007-2017
RPI: The retail price index, or the RPI, shows the changes in the cost of living. It reflects
the movement of prices in a range of goods and services used regularly, such as food, heating,
housing, household goods, bus fares and petrol (Retail price index, 2018). Items considered most
important to us, such as housing and food, are given a higher weighting in the overall index,
while items, such as tobacco, are given a lower weighting
CPI: The Consumer Price Index (CPI) is a measure that examines the weighted average
of prices of a basket of consumer goods and services, such as transportation, food and medical
care Consumer Price Index', 2018). It is calculated by taking price changes for each item in the
predetermined basket of goods and averaging them.
CHIP: CPIH is a new measure of the annual rate of UK consumer price inflation that
includes owner occupiers' housing costs (OOH) (CPIH Inflation, 2018). This does not include
costs such as utility bills, minor repairs and maintenance, which are already included in the
consumer price index.
10
Current service level of customers = 95% and Z score as 1.65
e. Determining the re-order level
ACTIVITY 4
4.A Formulating charts for RPI, CPI and CHIP form 2007-2017
RPI: The retail price index, or the RPI, shows the changes in the cost of living. It reflects
the movement of prices in a range of goods and services used regularly, such as food, heating,
housing, household goods, bus fares and petrol (Retail price index, 2018). Items considered most
important to us, such as housing and food, are given a higher weighting in the overall index,
while items, such as tobacco, are given a lower weighting
CPI: The Consumer Price Index (CPI) is a measure that examines the weighted average
of prices of a basket of consumer goods and services, such as transportation, food and medical
care Consumer Price Index', 2018). It is calculated by taking price changes for each item in the
predetermined basket of goods and averaging them.
CHIP: CPIH is a new measure of the annual rate of UK consumer price inflation that
includes owner occupiers' housing costs (OOH) (CPIH Inflation, 2018). This does not include
costs such as utility bills, minor repairs and maintenance, which are already included in the
consumer price index.
10
11
Paraphrase This Document
Need a fresh take? Get an instant paraphrase of this document with our AI Paraphraser
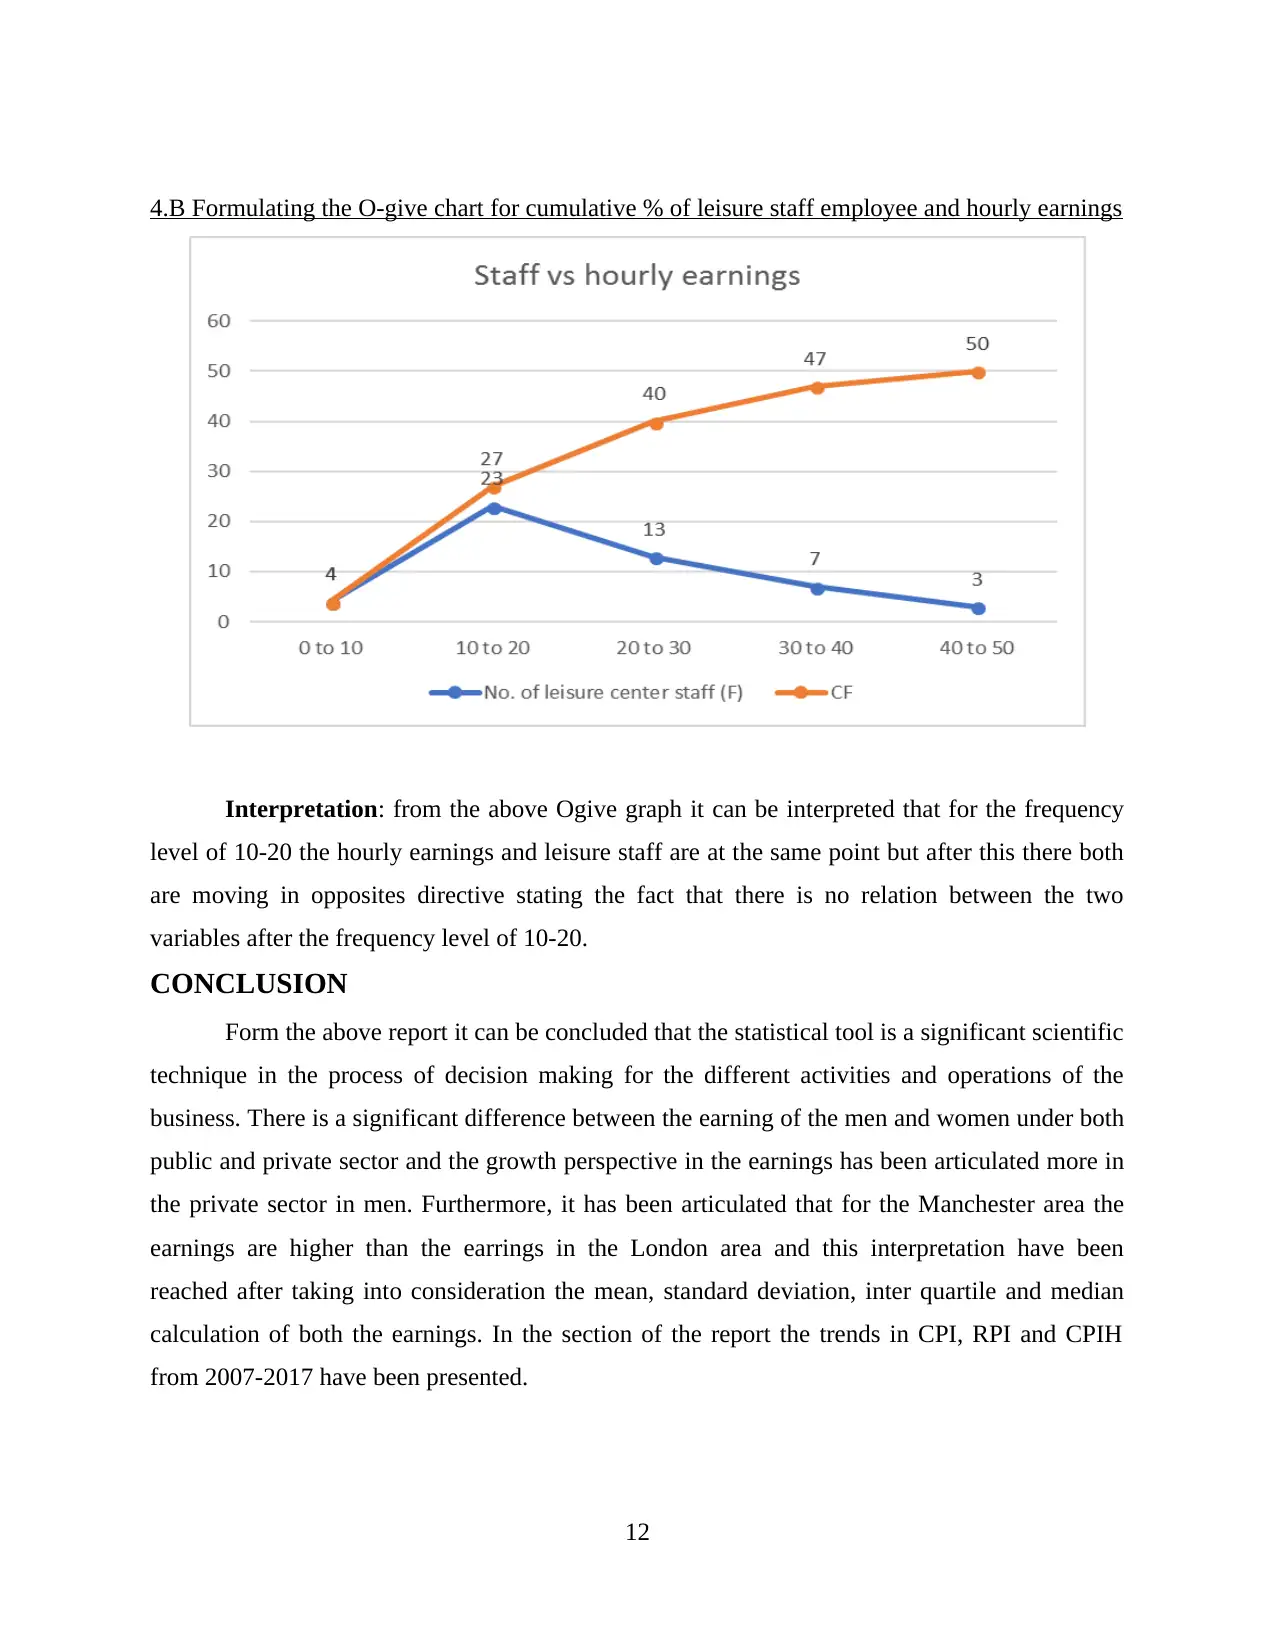
4.B Formulating the O-give chart for cumulative % of leisure staff employee and hourly earnings
Interpretation: from the above Ogive graph it can be interpreted that for the frequency
level of 10-20 the hourly earnings and leisure staff are at the same point but after this there both
are moving in opposites directive stating the fact that there is no relation between the two
variables after the frequency level of 10-20.
CONCLUSION
Form the above report it can be concluded that the statistical tool is a significant scientific
technique in the process of decision making for the different activities and operations of the
business. There is a significant difference between the earning of the men and women under both
public and private sector and the growth perspective in the earnings has been articulated more in
the private sector in men. Furthermore, it has been articulated that for the Manchester area the
earnings are higher than the earrings in the London area and this interpretation have been
reached after taking into consideration the mean, standard deviation, inter quartile and median
calculation of both the earnings. In the section of the report the trends in CPI, RPI and CPIH
from 2007-2017 have been presented.
12
1 out of 14
Related Documents


Your All-in-One AI-Powered Toolkit for Academic Success.
+13062052269
info@desklib.com
Available 24*7 on WhatsApp / Email
![[object Object]](/_next/static/media/star-bottom.7253800d.svg)
Unlock your academic potential
© 2024 | Zucol Services PVT LTD | All rights reserved.