Statistics for Management: Price Indices and Earnings
VerifiedAdded on 2021/01/02
|14
|2865
|79
Report
AI Summary
This report delves into statistical analysis relevant to management, focusing on consumer and retail price indices (CPI and RPI), inflation, and hourly earnings. The report begins by defining statistics and its applications in management, then proceeds to analyze CPI and RPI data from the Office ...

STATISTICS FOR
MANAGEMENT
MANAGEMENT
Paraphrase This Document
Need a fresh take? Get an instant paraphrase of this document with our AI Paraphraser
TABLE OF CONTENTS
INTRODUCTION
Statistics is referred in form of science of data as it helps to enable the analysis,
presentation, gathering and collecting data. In simple words, it is used for study of various other
fields like economics, marketing, psychology and medicine. The management use statistics for
purpose of quality assurance, production, financial analysis and operations along with various
other business areas. The confidence has been developed in manager for dealing with uncertainty
and to take quick and smart decisions to provide stable leadership to staff for high reliance. Its
basic need is to gain, analyse, condense and to relate numerical data as these methods are
supreme value with context of psychology and education. It helps in giving mode for measuring
and controlling process of production for minimizing differences as it will lead to waste and
error and it ensures consistency throughout whole process.
The present report will give brief discussion about Consumer and retail price index and
data will be gathered through Office of National Statistics website. It will reflect differences
among these Indices and importance of rate of inflation. This report would be analysing and
evaluating raw business data with application of different statistics method. In the similar aspect,
it will show statistical methods on basis of business planning further, its outcome and finding
will be presented in appropriate graphs and charts.
ACTIVITY 1
A. Using ONS, locating data on basis of Consumer price and Retail Price Index
Consumer price index: It is also referred as measure of change with context of price of
certain gathering services and goods bought through consumers with effort for measuring
inflation. In simple words, it is measuring basket of numerous consumer goods such as groceries,
transportation and medicine as benchmark for purpose of gauging cost of inflation and living. It
is significant metric which is directly used through institutions, economists and business entities.
They use CPI and CPIH for tracing changes in essentials for purpose of observing purchasing
power of consumer or to stay with same (Khalil, Noor-ul-Amin and Hanif, 2018).
Retail Price Index: It is also known as RPI as it represents costs of living along with
movement of price with specific range of goods and services which are used on regular aspect
like heating, food, bus fares, household goods and petrols. These items are very important like
housing and food will provide high weight in overall indices whereas items like tobacco are
lower weighting. The RPI Consider Vat along with other taxes as it alters outcome of alteration
1
You're viewing a preview
Unlock full access by subscribing today!


in level of tax along with various other components which are not evaluated in CPI like owner
occupied housing like payments of mortgage interest.
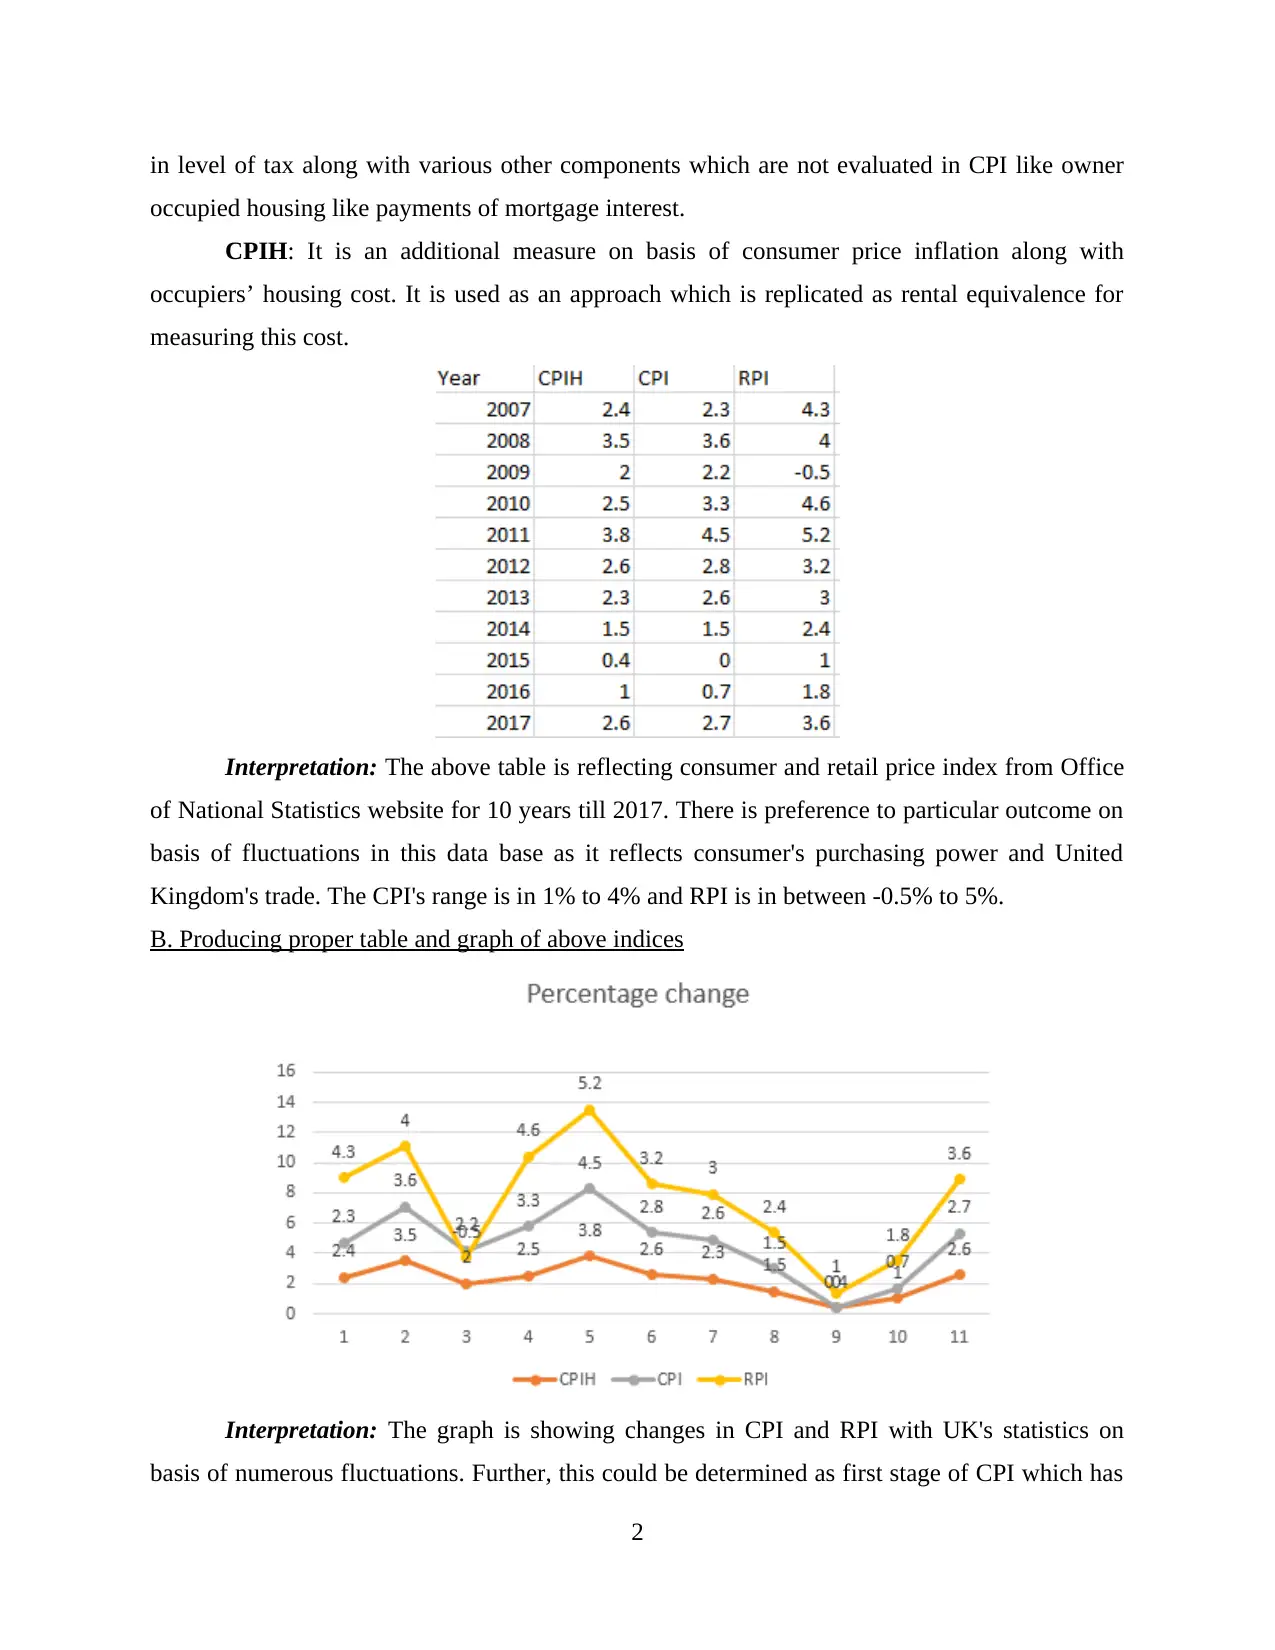
CPIH: It is an additional measure on basis of consumer price inflation along with
occupiers’ housing cost. It is used as an approach which is replicated as rental equivalence for
measuring this cost.
Interpretation: The above table is reflecting consumer and retail price index from Office
of National Statistics website for 10 years till 2017. There is preference to particular outcome on
basis of fluctuations in this data base as it reflects consumer's purchasing power and United
Kingdom's trade. The CPI's range is in 1% to 4% and RPI is in between -0.5% to 5%.
B. Producing proper table and graph of above indices
Interpretation: The graph is showing changes in CPI and RPI with UK's statistics on
basis of numerous fluctuations. Further, this could be determined as first stage of CPI which has
2
occupied housing like payments of mortgage interest.
CPIH: It is an additional measure on basis of consumer price inflation along with
occupiers’ housing cost. It is used as an approach which is replicated as rental equivalence for
measuring this cost.
Interpretation: The above table is reflecting consumer and retail price index from Office
of National Statistics website for 10 years till 2017. There is preference to particular outcome on
basis of fluctuations in this data base as it reflects consumer's purchasing power and United
Kingdom's trade. The CPI's range is in 1% to 4% and RPI is in between -0.5% to 5%.
B. Producing proper table and graph of above indices
Interpretation: The graph is showing changes in CPI and RPI with UK's statistics on
basis of numerous fluctuations. Further, this could be determined as first stage of CPI which has
2
Paraphrase This Document
Need a fresh take? Get an instant paraphrase of this document with our AI Paraphraser
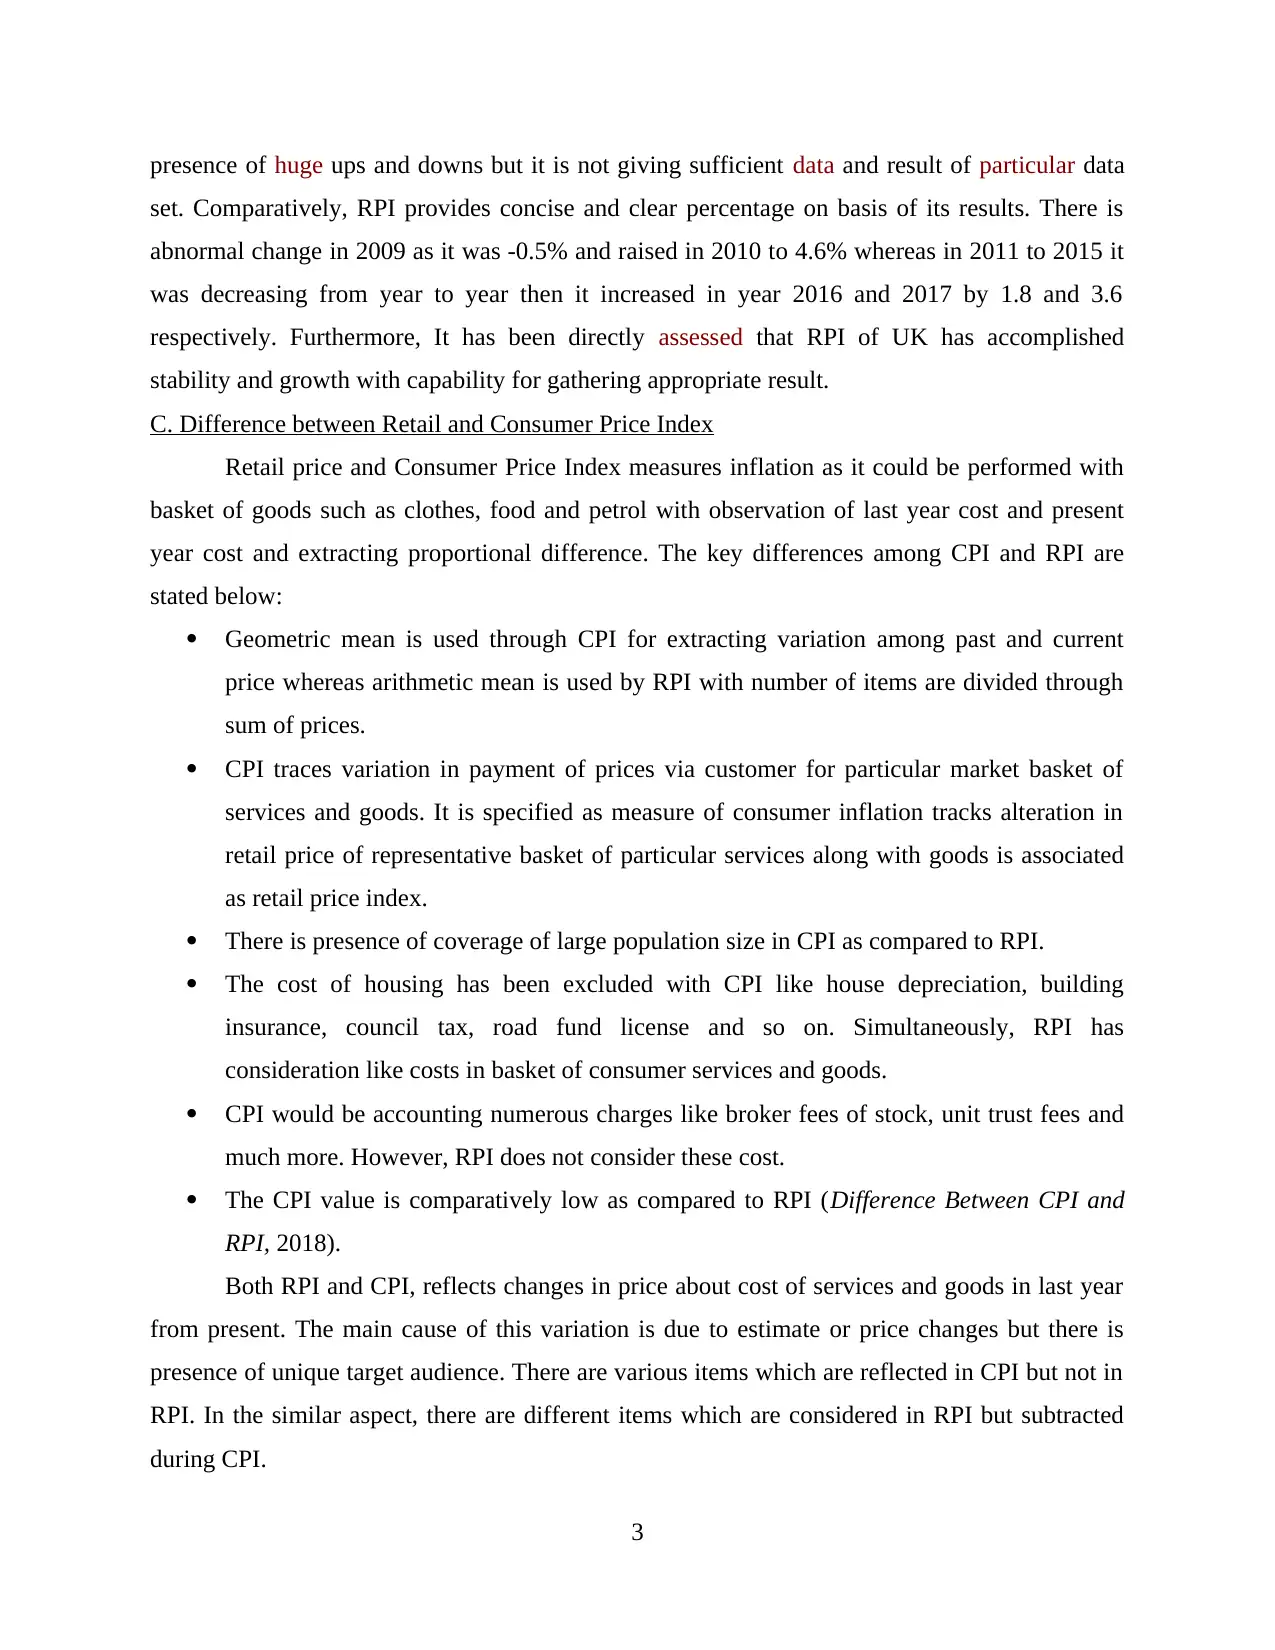
presence of huge ups and downs but it is not giving sufficient data and result of particular data
set. Comparatively, RPI provides concise and clear percentage on basis of its results. There is
abnormal change in 2009 as it was -0.5% and raised in 2010 to 4.6% whereas in 2011 to 2015 it
was decreasing from year to year then it increased in year 2016 and 2017 by 1.8 and 3.6
respectively. Furthermore, It has been directly assessed that RPI of UK has accomplished
stability and growth with capability for gathering appropriate result.
C. Difference between Retail and Consumer Price Index
Retail price and Consumer Price Index measures inflation as it could be performed with
basket of goods such as clothes, food and petrol with observation of last year cost and present
year cost and extracting proportional difference. The key differences among CPI and RPI are
stated below:
Geometric mean is used through CPI for extracting variation among past and current
price whereas arithmetic mean is used by RPI with number of items are divided through
sum of prices.
CPI traces variation in payment of prices via customer for particular market basket of
services and goods. It is specified as measure of consumer inflation tracks alteration in
retail price of representative basket of particular services along with goods is associated
as retail price index.
There is presence of coverage of large population size in CPI as compared to RPI.
The cost of housing has been excluded with CPI like house depreciation, building
insurance, council tax, road fund license and so on. Simultaneously, RPI has
consideration like costs in basket of consumer services and goods.
CPI would be accounting numerous charges like broker fees of stock, unit trust fees and
much more. However, RPI does not consider these cost.
The CPI value is comparatively low as compared to RPI (Difference Between CPI and
RPI, 2018).
Both RPI and CPI, reflects changes in price about cost of services and goods in last year
from present. The main cause of this variation is due to estimate or price changes but there is
presence of unique target audience. There are various items which are reflected in CPI but not in
RPI. In the similar aspect, there are different items which are considered in RPI but subtracted
during CPI.
3
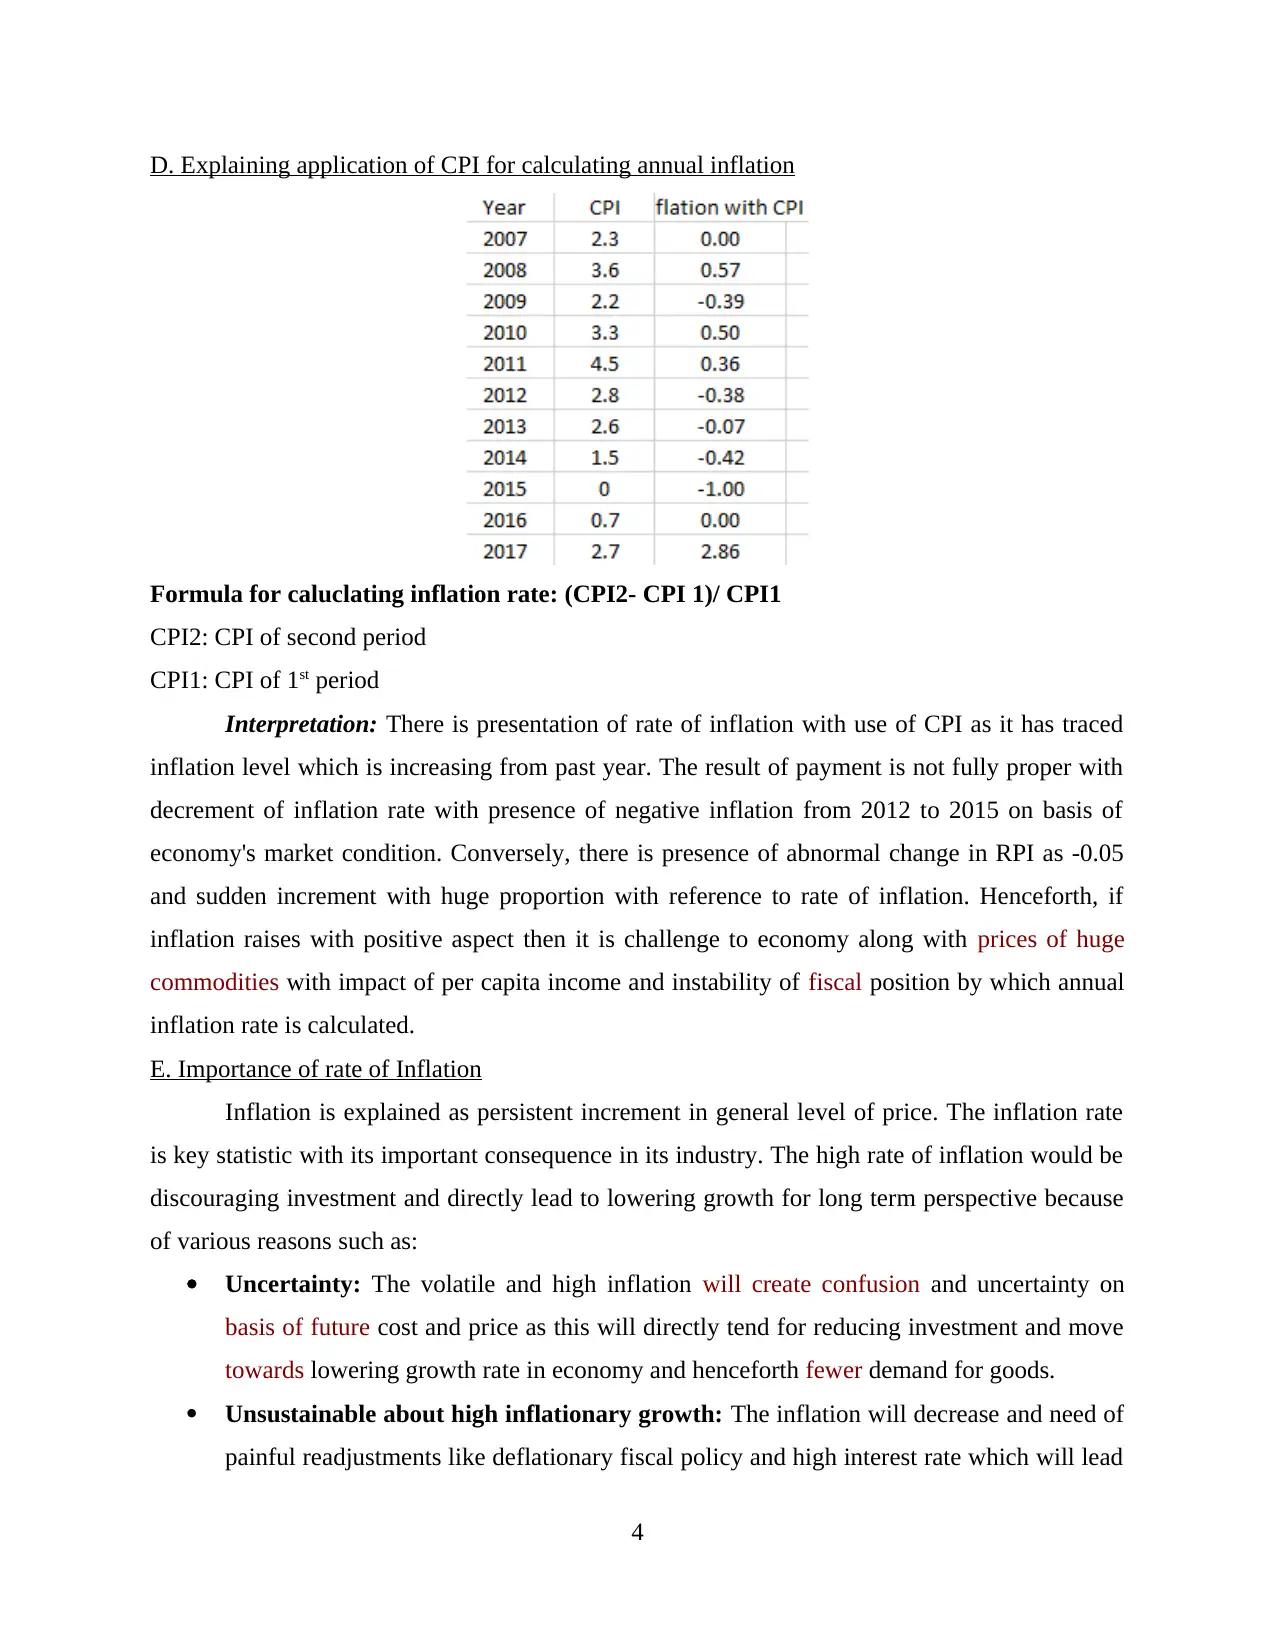
D. Explaining application of CPI for calculating annual inflation
Formula for caluclating inflation rate: (CPI2- CPI 1)/ CPI1
CPI2: CPI of second period
CPI1: CPI of 1st period
Interpretation: There is presentation of rate of inflation with use of CPI as it has traced
inflation level which is increasing from past year. The result of payment is not fully proper with
decrement of inflation rate with presence of negative inflation from 2012 to 2015 on basis of
economy's market condition. Conversely, there is presence of abnormal change in RPI as -0.05
and sudden increment with huge proportion with reference to rate of inflation. Henceforth, if
inflation raises with positive aspect then it is challenge to economy along with prices of huge
commodities with impact of per capita income and instability of fiscal position by which annual
inflation rate is calculated.
E. Importance of rate of Inflation
Inflation is explained as persistent increment in general level of price. The inflation rate
is key statistic with its important consequence in its industry. The high rate of inflation would be
discouraging investment and directly lead to lowering growth for long term perspective because
of various reasons such as:
Uncertainty: The volatile and high inflation will create confusion and uncertainty on
basis of future cost and price as this will directly tend for reducing investment and move
towards lowering growth rate in economy and henceforth fewer demand for goods.
Unsustainable about high inflationary growth: The inflation will decrease and need of
painful readjustments like deflationary fiscal policy and high interest rate which will lead
4
You're viewing a preview
Unlock full access by subscribing today!
to decrease the growth. The countries with high inflation might be directly susceptible for
recession in near future.
If there is high inflation, prices should be changed on frequent way as it will be incurring
cost. Similarly, high inflation rate might be incurring negotiations about wage with
context of trade unions for maintaining real wage which is expensive for manufacturing
organization. On the contrary, business entities could mitigate menu cost with technology
and be cheaper for updating price.
Inflation would be creating ease with perspective of debtors for repaying loan amount
with money which is not valuable comparatively to borrowed amount. It encourages activities of
borrowing and lending which will be increasing spending on every level. As per various
economists, there is presence of inverse relationship with context of inflation and unemployment
as it not favouring increment in inflation. Furthermore, the supply level of money will be raised
through government as it will be gathering funds with context of reserve with aim of multiple
future developments (Importance of Inflation for Industry, 2016).
ACTIVITY 2 [CLIENT B]
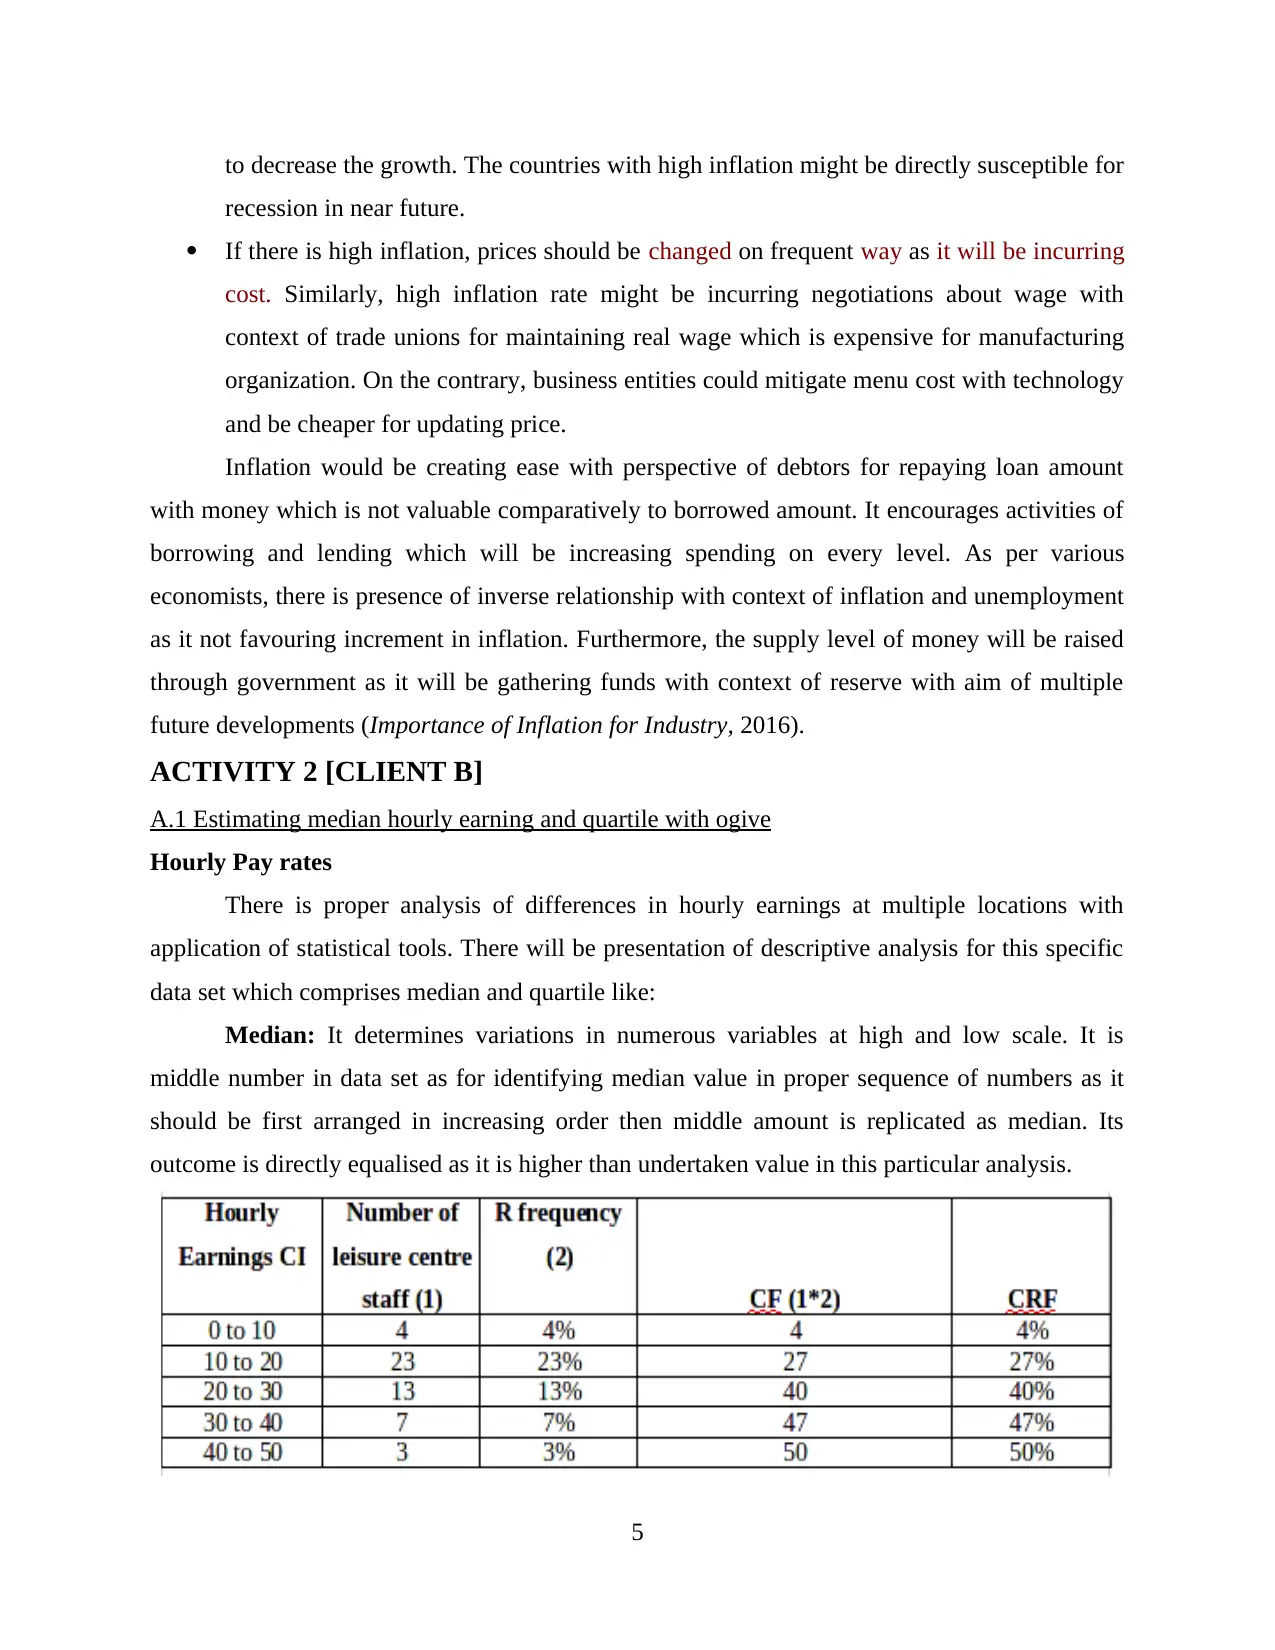
A.1 Estimating median hourly earning and quartile with ogive
Hourly Pay rates
There is proper analysis of differences in hourly earnings at multiple locations with
application of statistical tools. There will be presentation of descriptive analysis for this specific
data set which comprises median and quartile like:
Median: It determines variations in numerous variables at high and low scale. It is
middle number in data set as for identifying median value in proper sequence of numbers as it
should be first arranged in increasing order then middle amount is replicated as median. Its
outcome is directly equalised as it is higher than undertaken value in this particular analysis.
5
recession in near future.
If there is high inflation, prices should be changed on frequent way as it will be incurring
cost. Similarly, high inflation rate might be incurring negotiations about wage with
context of trade unions for maintaining real wage which is expensive for manufacturing
organization. On the contrary, business entities could mitigate menu cost with technology
and be cheaper for updating price.
Inflation would be creating ease with perspective of debtors for repaying loan amount
with money which is not valuable comparatively to borrowed amount. It encourages activities of
borrowing and lending which will be increasing spending on every level. As per various
economists, there is presence of inverse relationship with context of inflation and unemployment
as it not favouring increment in inflation. Furthermore, the supply level of money will be raised
through government as it will be gathering funds with context of reserve with aim of multiple
future developments (Importance of Inflation for Industry, 2016).
ACTIVITY 2 [CLIENT B]
A.1 Estimating median hourly earning and quartile with ogive
Hourly Pay rates
There is proper analysis of differences in hourly earnings at multiple locations with
application of statistical tools. There will be presentation of descriptive analysis for this specific
data set which comprises median and quartile like:
Median: It determines variations in numerous variables at high and low scale. It is
middle number in data set as for identifying median value in proper sequence of numbers as it
should be first arranged in increasing order then middle amount is replicated as median. Its
outcome is directly equalised as it is higher than undertaken value in this particular analysis.
5
Paraphrase This Document
Need a fresh take? Get an instant paraphrase of this document with our AI Paraphraser
6
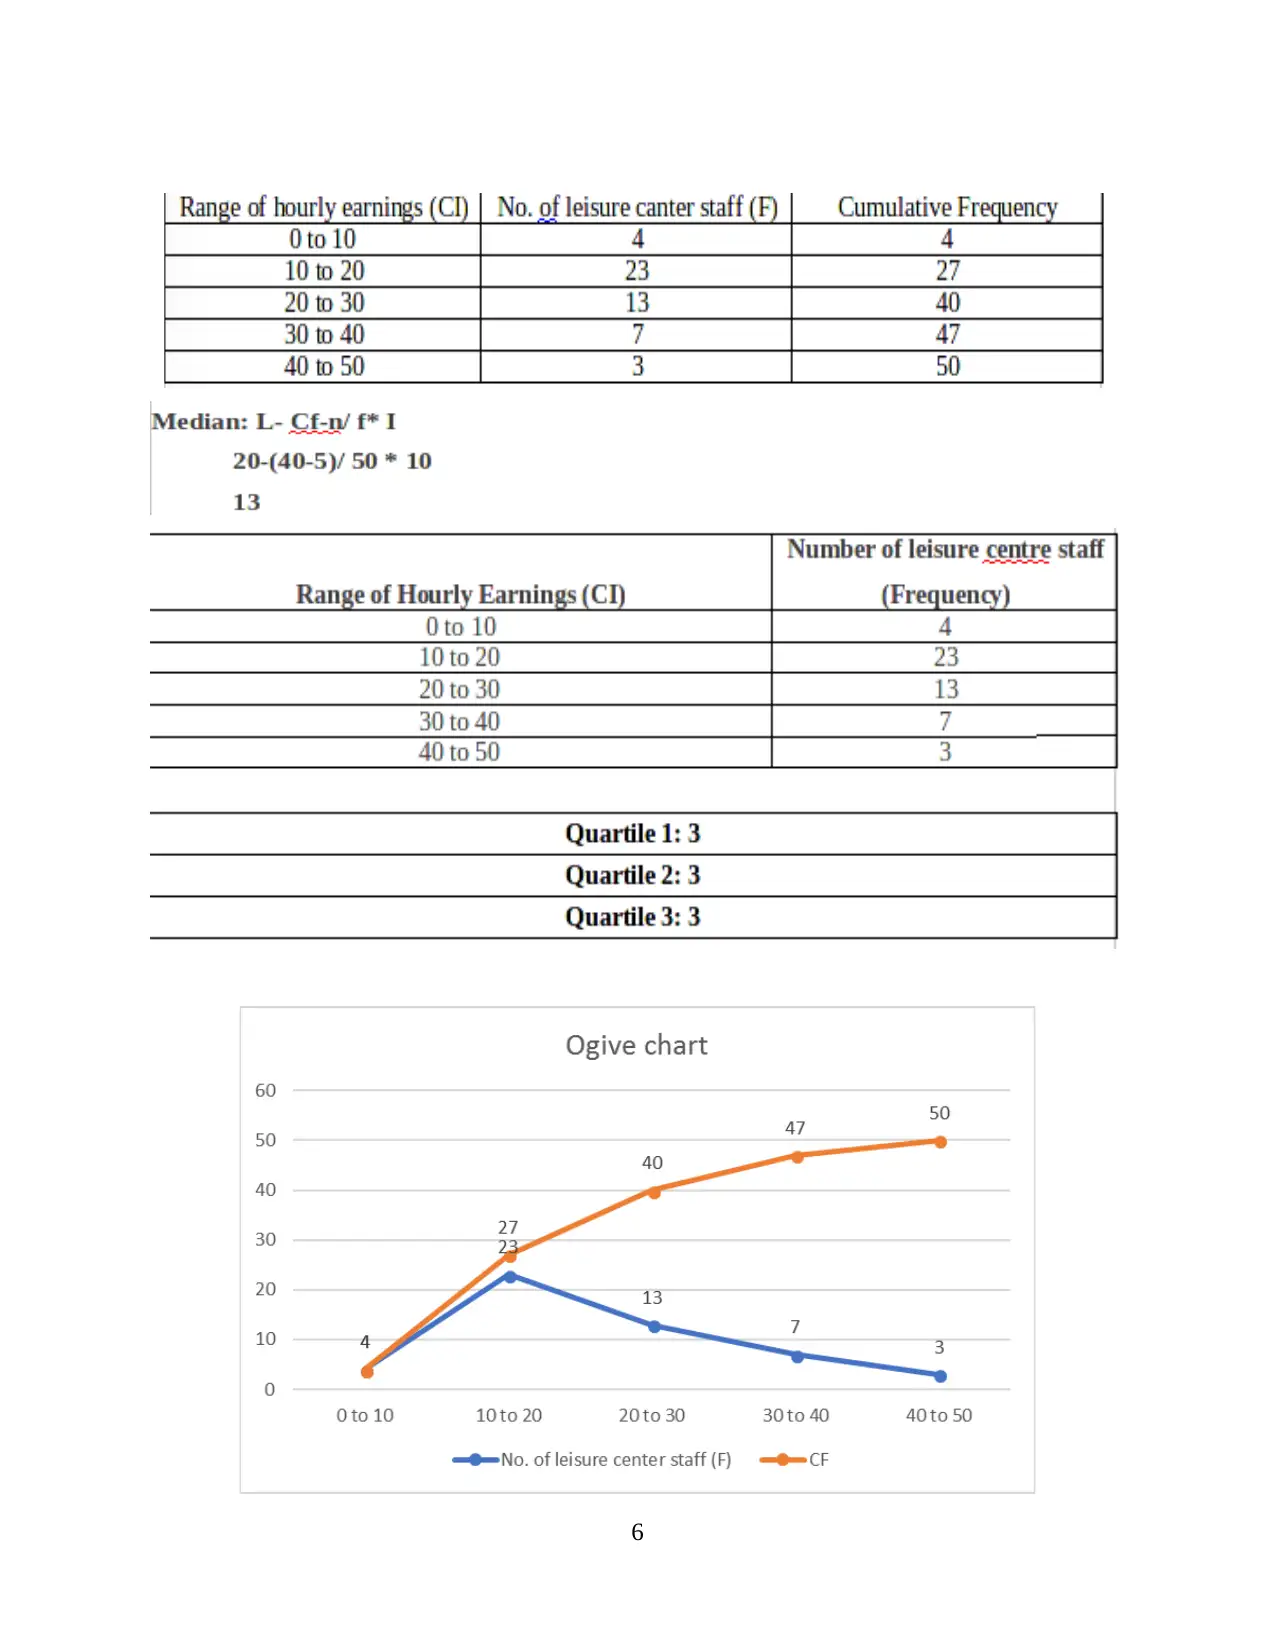
Interpretation: On basis of graph and table is reflecting median and quartile with context
of various techniques. There is extraction of median as 13 selected with range of team hours is
about 10 to 20. Henceforth, it could be elaborated that 13 as median value as while analysing
quartile, it outcome is same in all quartile as 3.
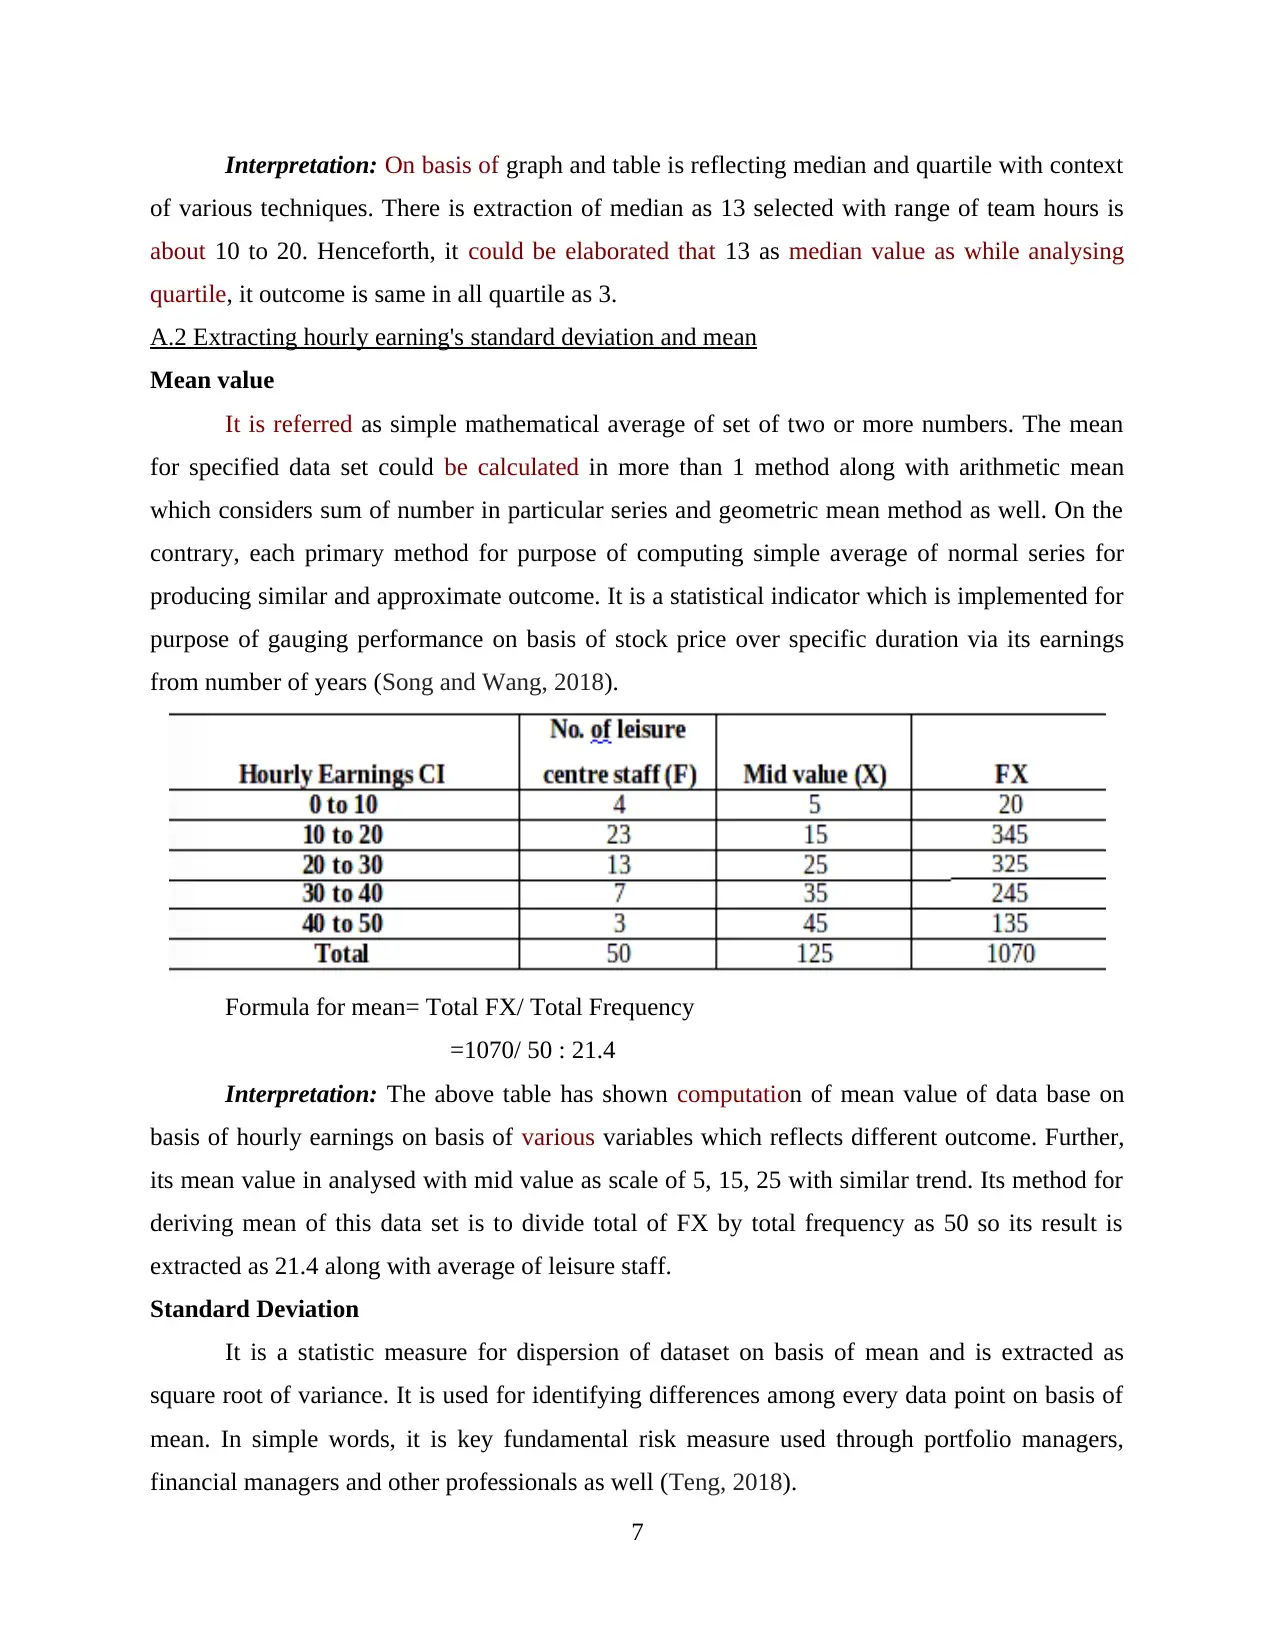
A.2 Extracting hourly earning's standard deviation and mean
Mean value
It is referred as simple mathematical average of set of two or more numbers. The mean
for specified data set could be calculated in more than 1 method along with arithmetic mean
which considers sum of number in particular series and geometric mean method as well. On the
contrary, each primary method for purpose of computing simple average of normal series for
producing similar and approximate outcome. It is a statistical indicator which is implemented for
purpose of gauging performance on basis of stock price over specific duration via its earnings
from number of years (Song and Wang, 2018).
Formula for mean= Total FX/ Total Frequency
=1070/ 50 : 21.4
Interpretation: The above table has shown computation of mean value of data base on
basis of hourly earnings on basis of various variables which reflects different outcome. Further,
its mean value in analysed with mid value as scale of 5, 15, 25 with similar trend. Its method for
deriving mean of this data set is to divide total of FX by total frequency as 50 so its result is
extracted as 21.4 along with average of leisure staff.
Standard Deviation
It is a statistic measure for dispersion of dataset on basis of mean and is extracted as
square root of variance. It is used for identifying differences among every data point on basis of
mean. In simple words, it is key fundamental risk measure used through portfolio managers,
financial managers and other professionals as well (Teng, 2018).
7
of various techniques. There is extraction of median as 13 selected with range of team hours is
about 10 to 20. Henceforth, it could be elaborated that 13 as median value as while analysing
quartile, it outcome is same in all quartile as 3.
A.2 Extracting hourly earning's standard deviation and mean
Mean value
It is referred as simple mathematical average of set of two or more numbers. The mean
for specified data set could be calculated in more than 1 method along with arithmetic mean
which considers sum of number in particular series and geometric mean method as well. On the
contrary, each primary method for purpose of computing simple average of normal series for
producing similar and approximate outcome. It is a statistical indicator which is implemented for
purpose of gauging performance on basis of stock price over specific duration via its earnings
from number of years (Song and Wang, 2018).
Formula for mean= Total FX/ Total Frequency
=1070/ 50 : 21.4
Interpretation: The above table has shown computation of mean value of data base on
basis of hourly earnings on basis of various variables which reflects different outcome. Further,
its mean value in analysed with mid value as scale of 5, 15, 25 with similar trend. Its method for
deriving mean of this data set is to divide total of FX by total frequency as 50 so its result is
extracted as 21.4 along with average of leisure staff.
Standard Deviation
It is a statistic measure for dispersion of dataset on basis of mean and is extracted as
square root of variance. It is used for identifying differences among every data point on basis of
mean. In simple words, it is key fundamental risk measure used through portfolio managers,
financial managers and other professionals as well (Teng, 2018).
7
You're viewing a preview
Unlock full access by subscribing today!
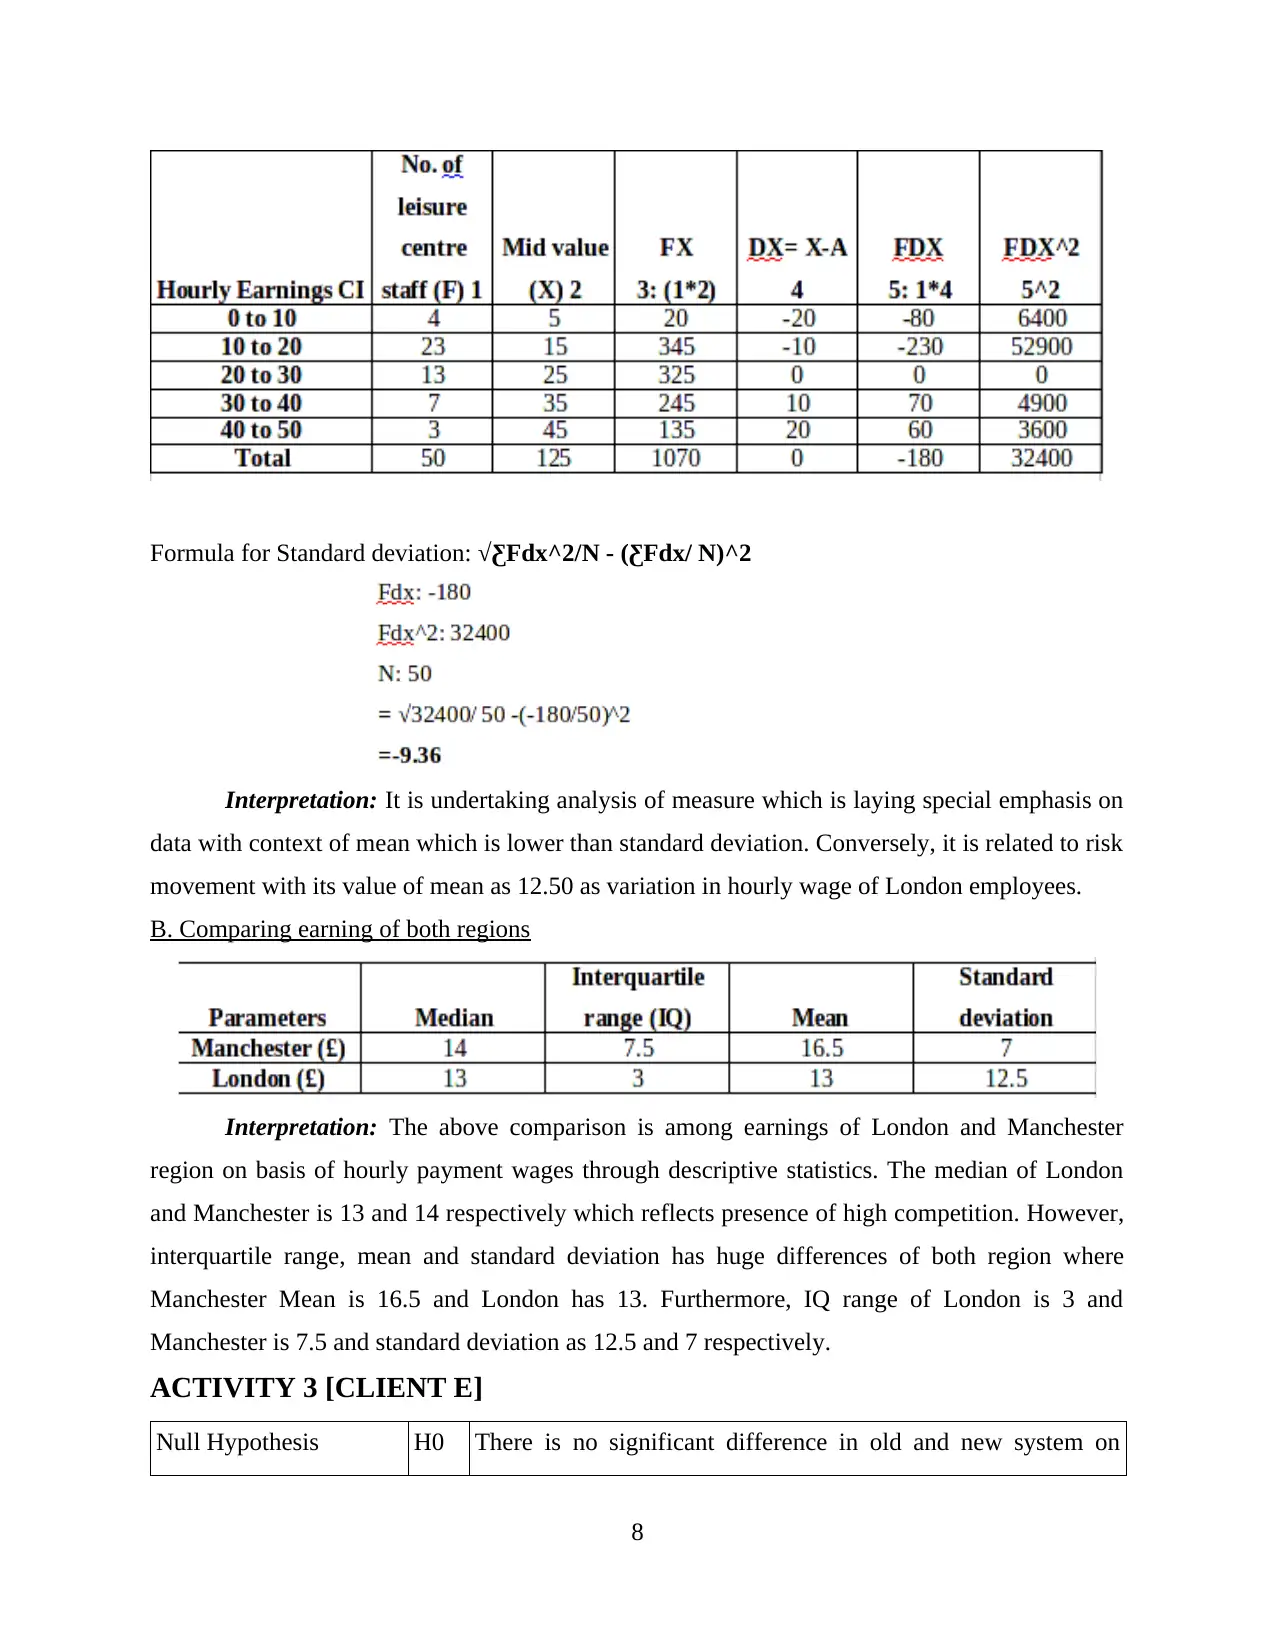
Formula for Standard deviation: √ƸFdx^2/N - (ƸFdx/ N)^2
Interpretation: It is undertaking analysis of measure which is laying special emphasis on
data with context of mean which is lower than standard deviation. Conversely, it is related to risk
movement with its value of mean as 12.50 as variation in hourly wage of London employees.
B. Comparing earning of both regions
Interpretation: The above comparison is among earnings of London and Manchester
region on basis of hourly payment wages through descriptive statistics. The median of London
and Manchester is 13 and 14 respectively which reflects presence of high competition. However,
interquartile range, mean and standard deviation has huge differences of both region where
Manchester Mean is 16.5 and London has 13. Furthermore, IQ range of London is 3 and
Manchester is 7.5 and standard deviation as 12.5 and 7 respectively.
ACTIVITY 3 [CLIENT E]
Null Hypothesis H0 There is no significant difference in old and new system on
8
Paraphrase This Document
Need a fresh take? Get an instant paraphrase of this document with our AI Paraphraser
basis on mean value.
Alternative Hypothesis H1 There is significant difference in old and new system on basis
on mean value.
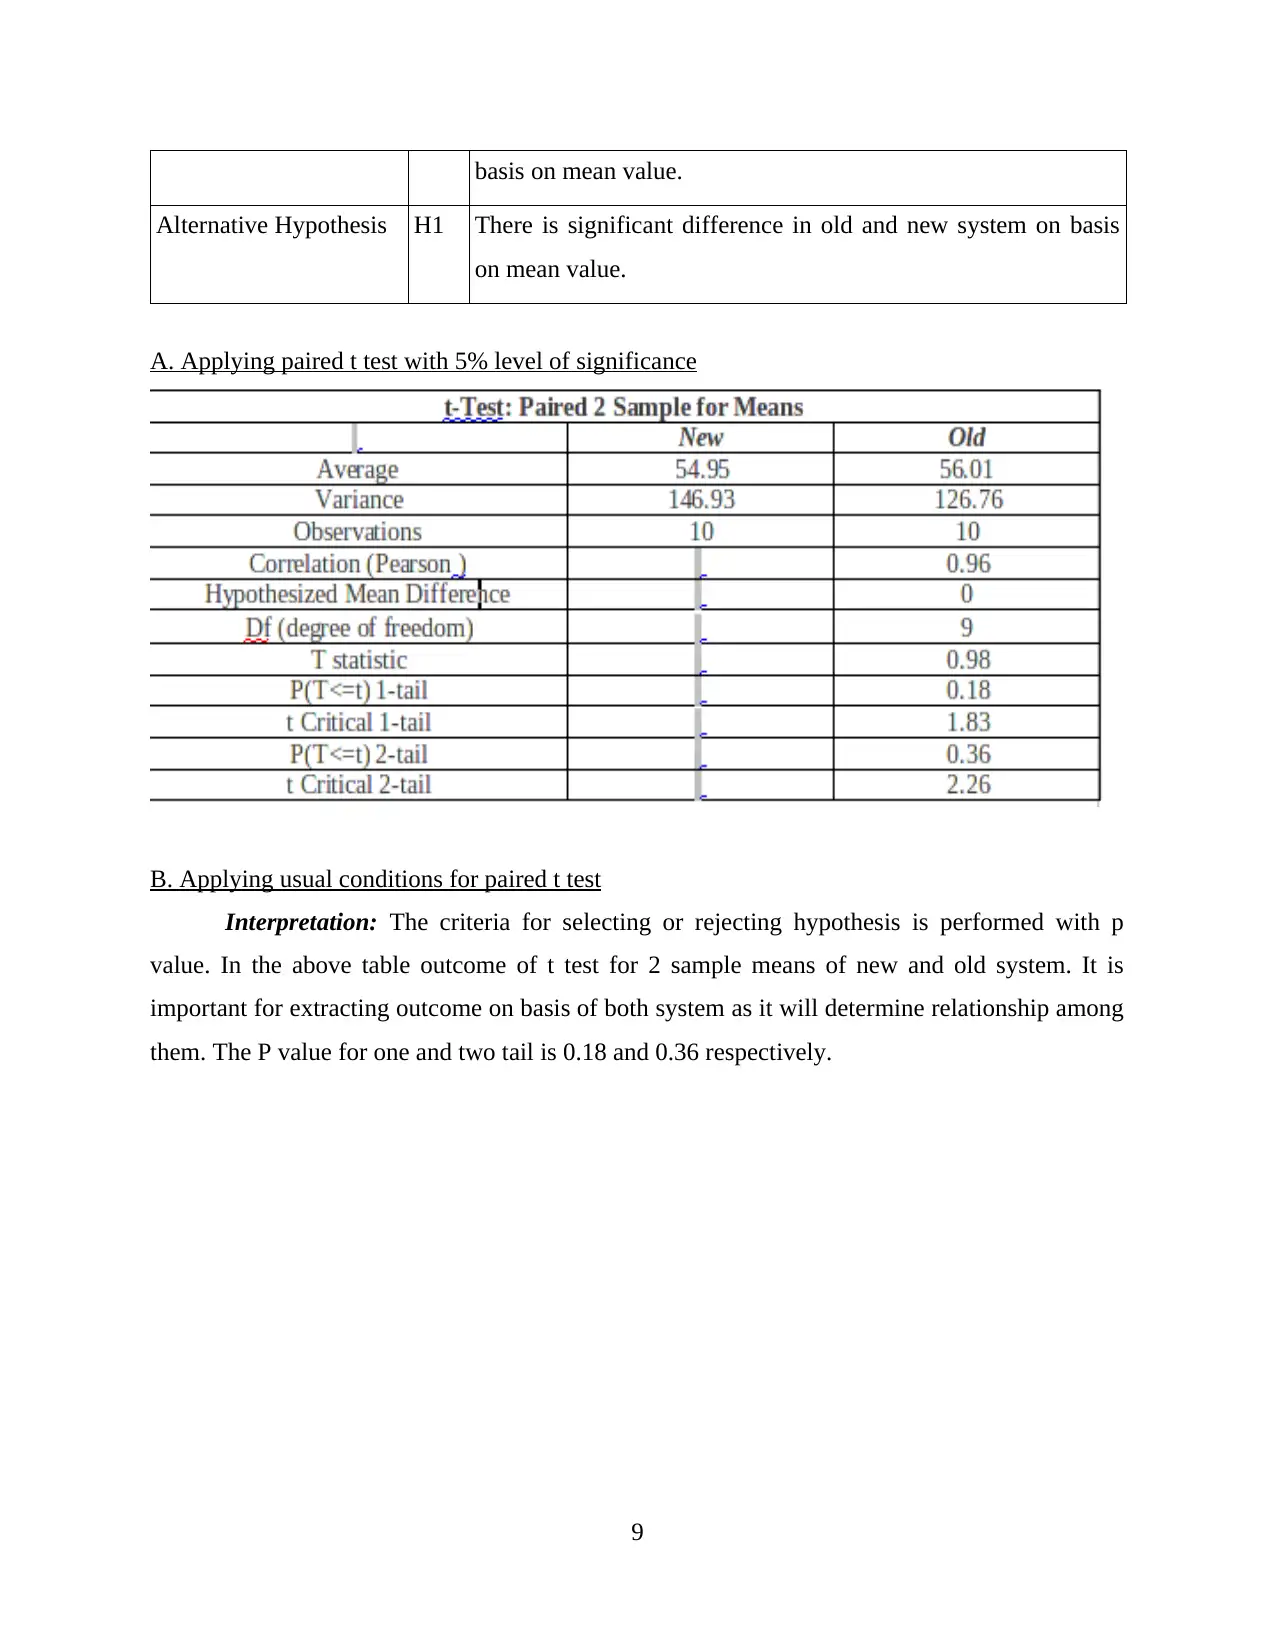
A. Applying paired t test with 5% level of significance
B. Applying usual conditions for paired t test
Interpretation: The criteria for selecting or rejecting hypothesis is performed with p
value. In the above table outcome of t test for 2 sample means of new and old system. It is
important for extracting outcome on basis of both system as it will determine relationship among
them. The P value for one and two tail is 0.18 and 0.36 respectively.
9
Alternative Hypothesis H1 There is significant difference in old and new system on basis
on mean value.
A. Applying paired t test with 5% level of significance
B. Applying usual conditions for paired t test
Interpretation: The criteria for selecting or rejecting hypothesis is performed with p
value. In the above table outcome of t test for 2 sample means of new and old system. It is
important for extracting outcome on basis of both system as it will determine relationship among
them. The P value for one and two tail is 0.18 and 0.36 respectively.
9
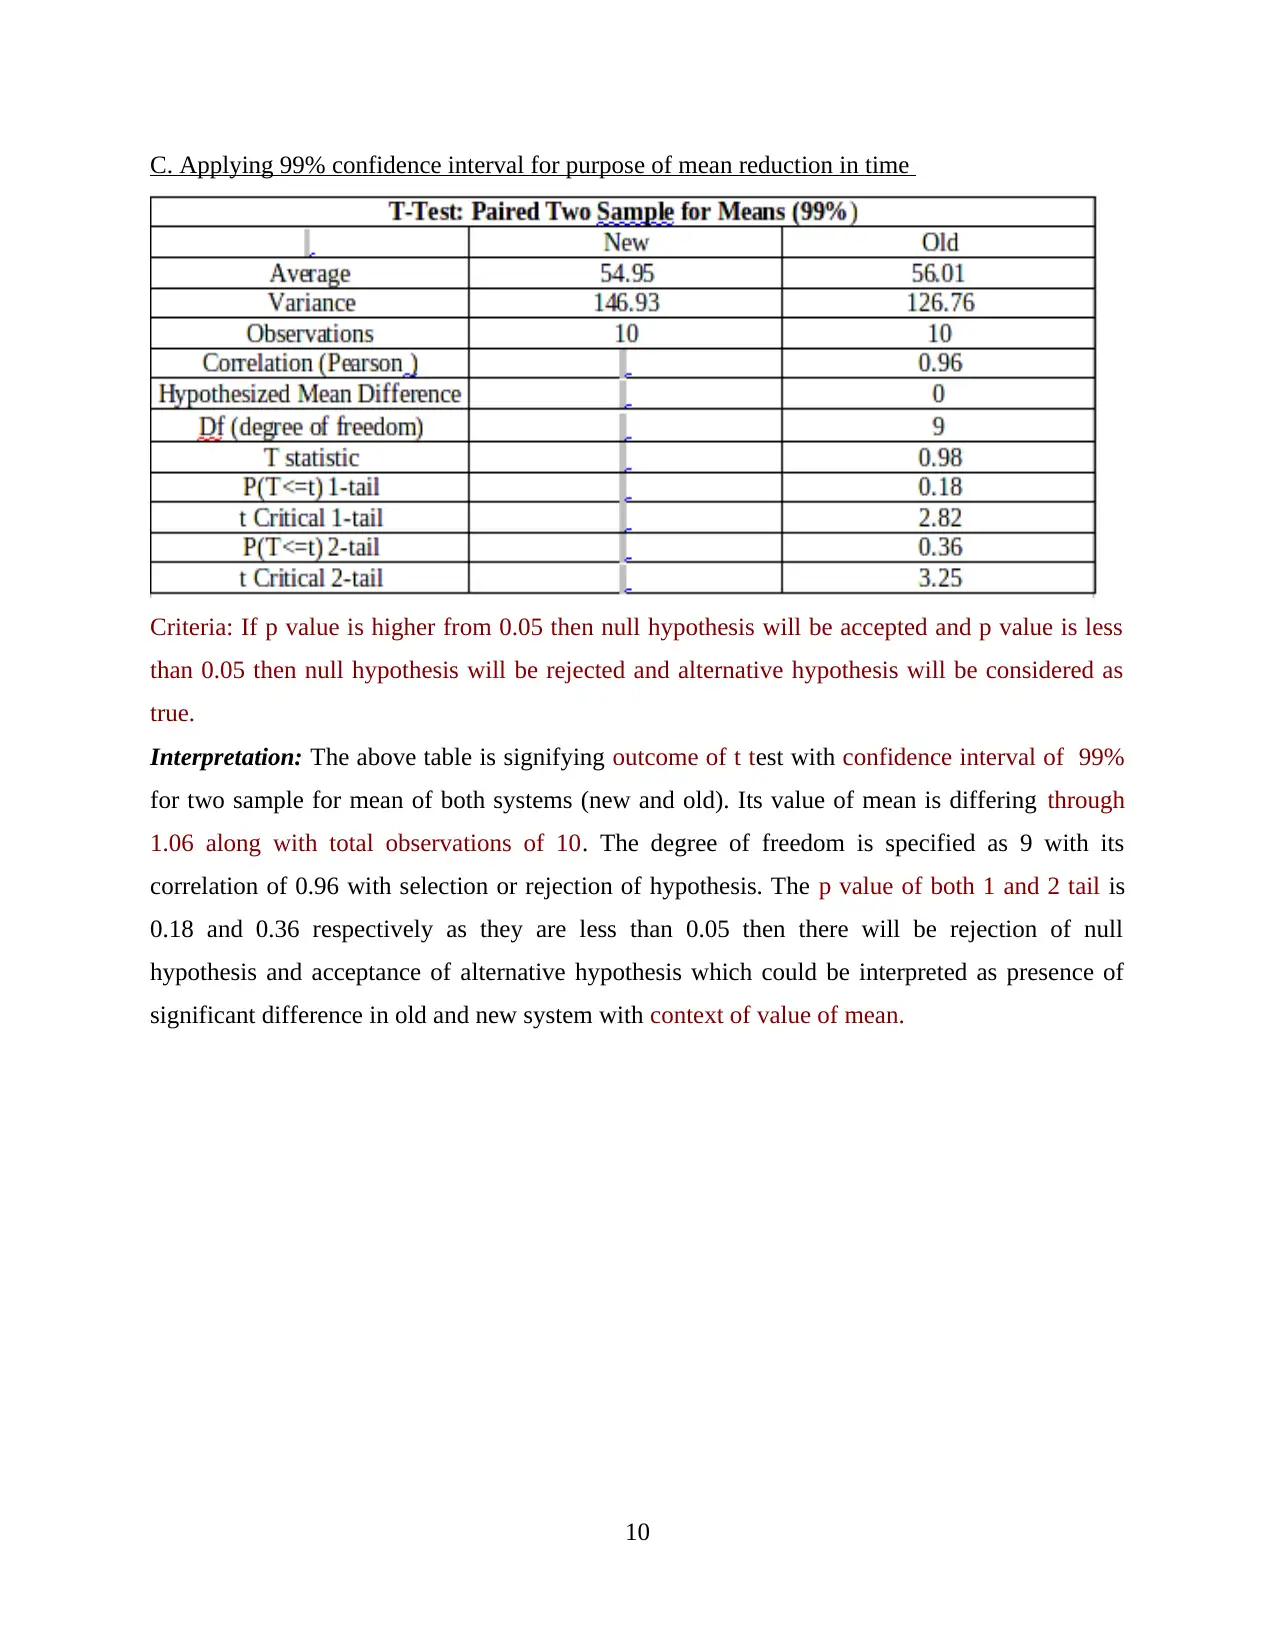
C. Applying 99% confidence interval for purpose of mean reduction in time
Criteria: If p value is higher from 0.05 then null hypothesis will be accepted and p value is less
than 0.05 then null hypothesis will be rejected and alternative hypothesis will be considered as
true.
Interpretation: The above table is signifying outcome of t test with confidence interval of 99%
for two sample for mean of both systems (new and old). Its value of mean is differing through
1.06 along with total observations of 10. The degree of freedom is specified as 9 with its
correlation of 0.96 with selection or rejection of hypothesis. The p value of both 1 and 2 tail is
0.18 and 0.36 respectively as they are less than 0.05 then there will be rejection of null
hypothesis and acceptance of alternative hypothesis which could be interpreted as presence of
significant difference in old and new system with context of value of mean.
10
You're viewing a preview
Unlock full access by subscribing today!
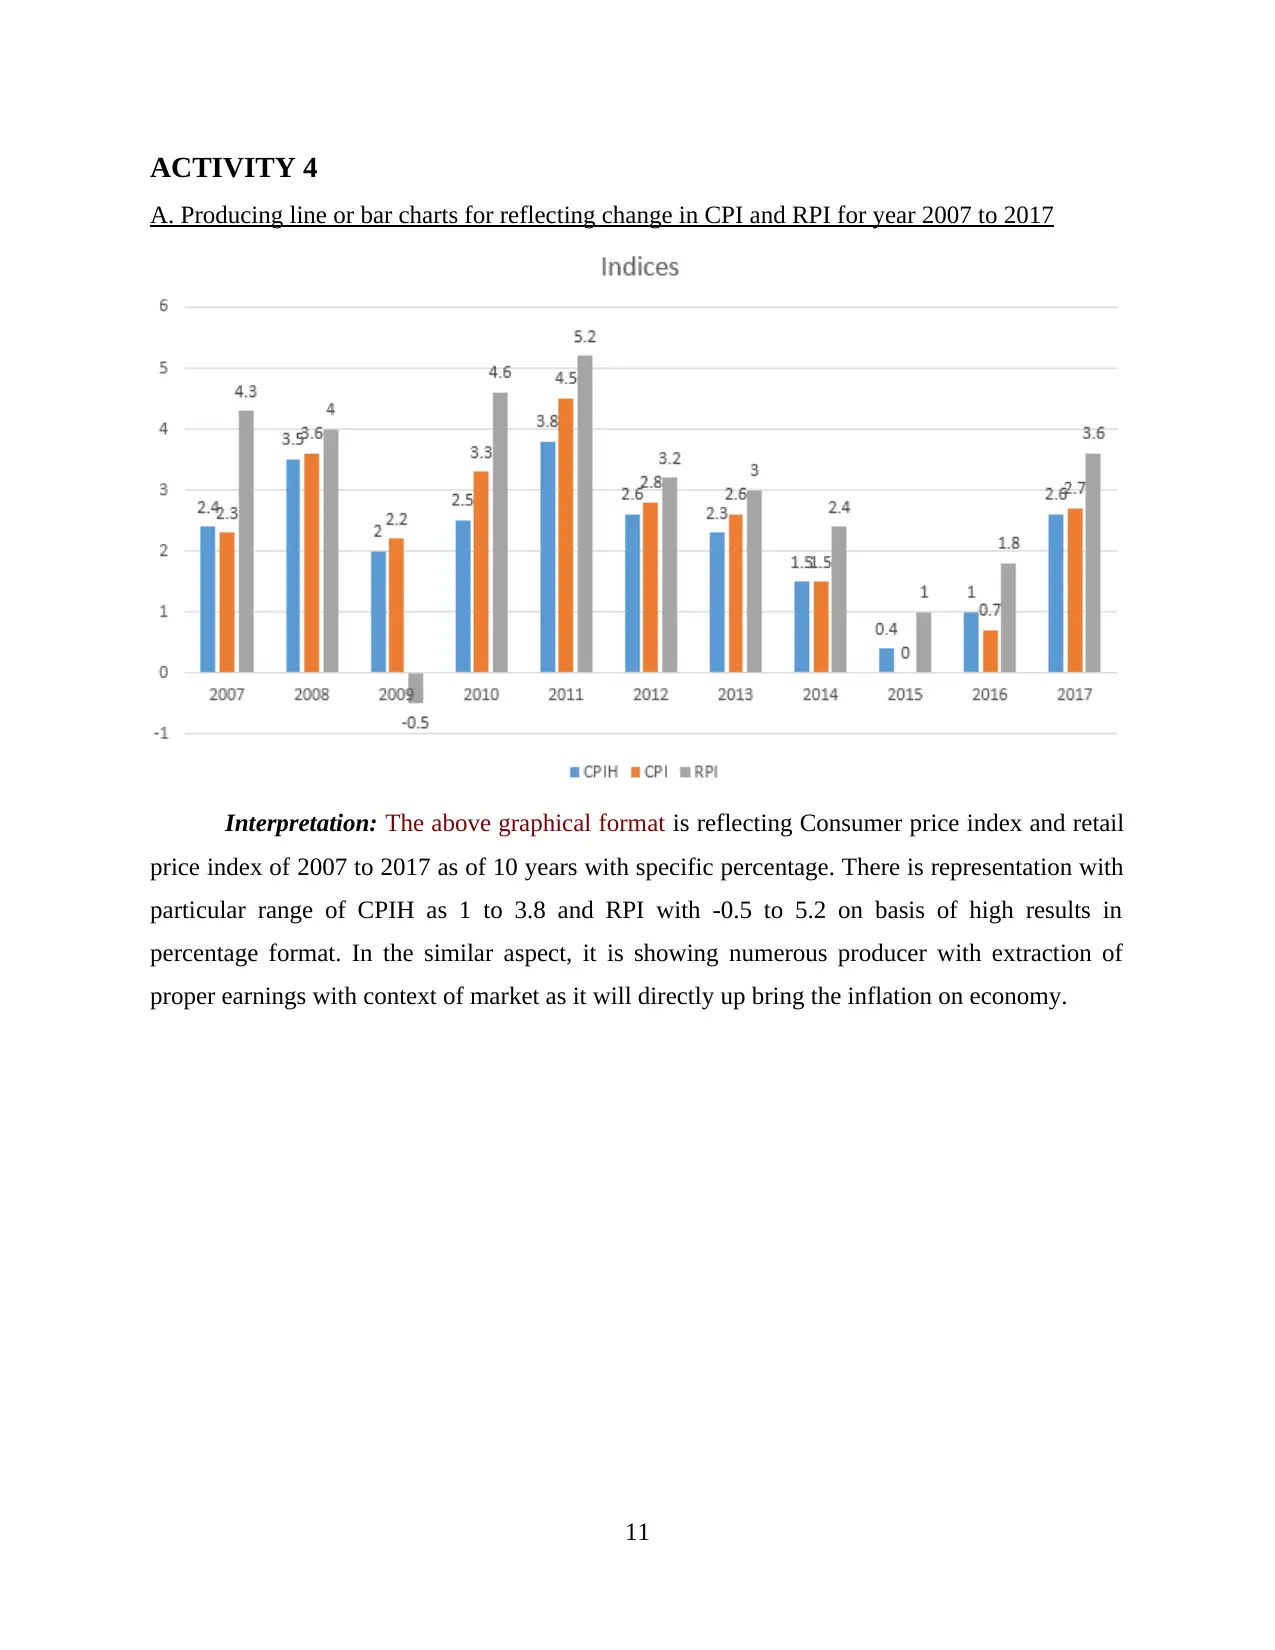
ACTIVITY 4
A. Producing line or bar charts for reflecting change in CPI and RPI for year 2007 to 2017
Interpretation: The above graphical format is reflecting Consumer price index and retail
price index of 2007 to 2017 as of 10 years with specific percentage. There is representation with
particular range of CPIH as 1 to 3.8 and RPI with -0.5 to 5.2 on basis of high results in
percentage format. In the similar aspect, it is showing numerous producer with extraction of
proper earnings with context of market as it will directly up bring the inflation on economy.
11
Paraphrase This Document
Need a fresh take? Get an instant paraphrase of this document with our AI Paraphraser
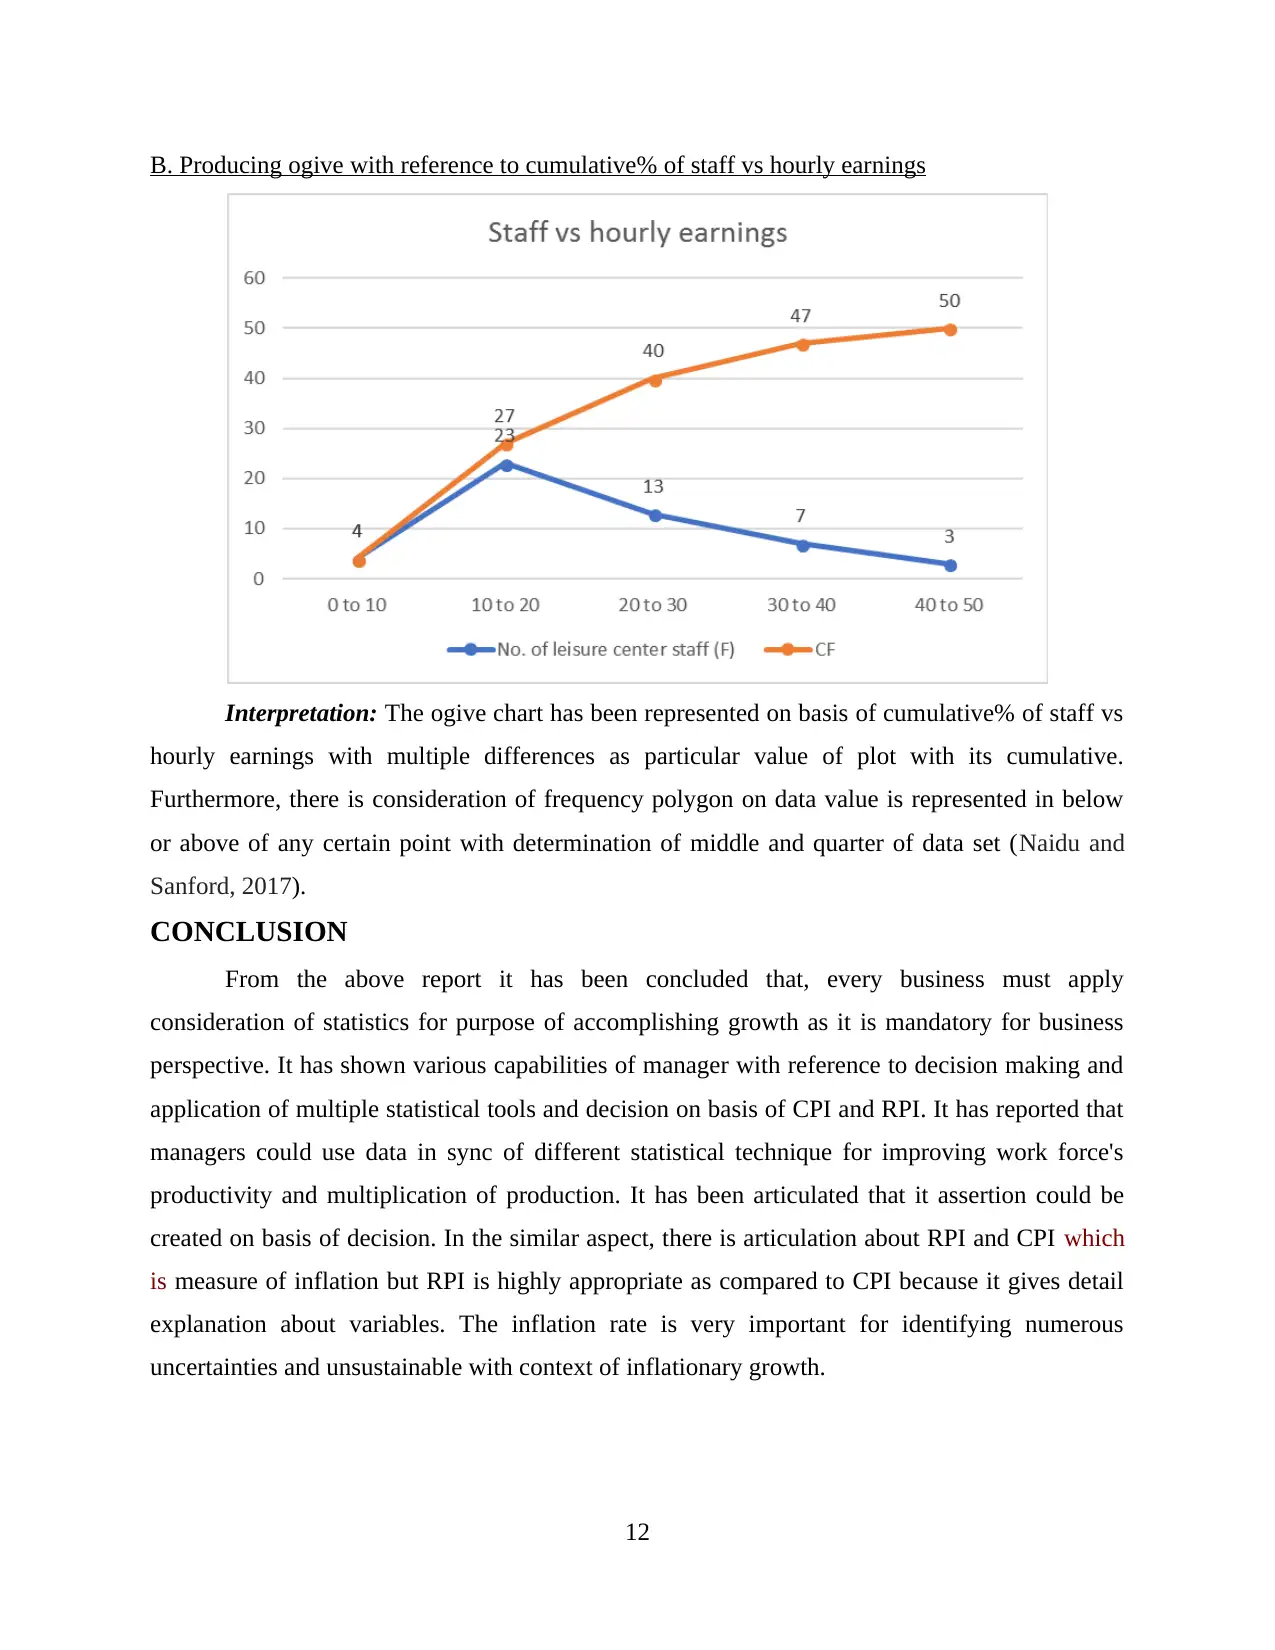
B. Producing ogive with reference to cumulative% of staff vs hourly earnings
Interpretation: The ogive chart has been represented on basis of cumulative% of staff vs
hourly earnings with multiple differences as particular value of plot with its cumulative.
Furthermore, there is consideration of frequency polygon on data value is represented in below
or above of any certain point with determination of middle and quarter of data set (Naidu and
Sanford, 2017).
CONCLUSION
From the above report it has been concluded that, every business must apply
consideration of statistics for purpose of accomplishing growth as it is mandatory for business
perspective. It has shown various capabilities of manager with reference to decision making and
application of multiple statistical tools and decision on basis of CPI and RPI. It has reported that
managers could use data in sync of different statistical technique for improving work force's
productivity and multiplication of production. It has been articulated that it assertion could be
created on basis of decision. In the similar aspect, there is articulation about RPI and CPI which
is measure of inflation but RPI is highly appropriate as compared to CPI because it gives detail
explanation about variables. The inflation rate is very important for identifying numerous
uncertainties and unsustainable with context of inflationary growth.
12
1 out of 14
Related Documents


Your All-in-One AI-Powered Toolkit for Academic Success.
+13062052269
info@desklib.com
Available 24*7 on WhatsApp / Email
![[object Object]](/_next/static/media/star-bottom.7253800d.svg)
Unlock your academic potential
© 2024 | Zucol Services PVT LTD | All rights reserved.