Statistics for Management Report: Business and Economic Data Analysis
VerifiedAdded on 2020/12/18
|22
|3705
|474
Report
AI Summary
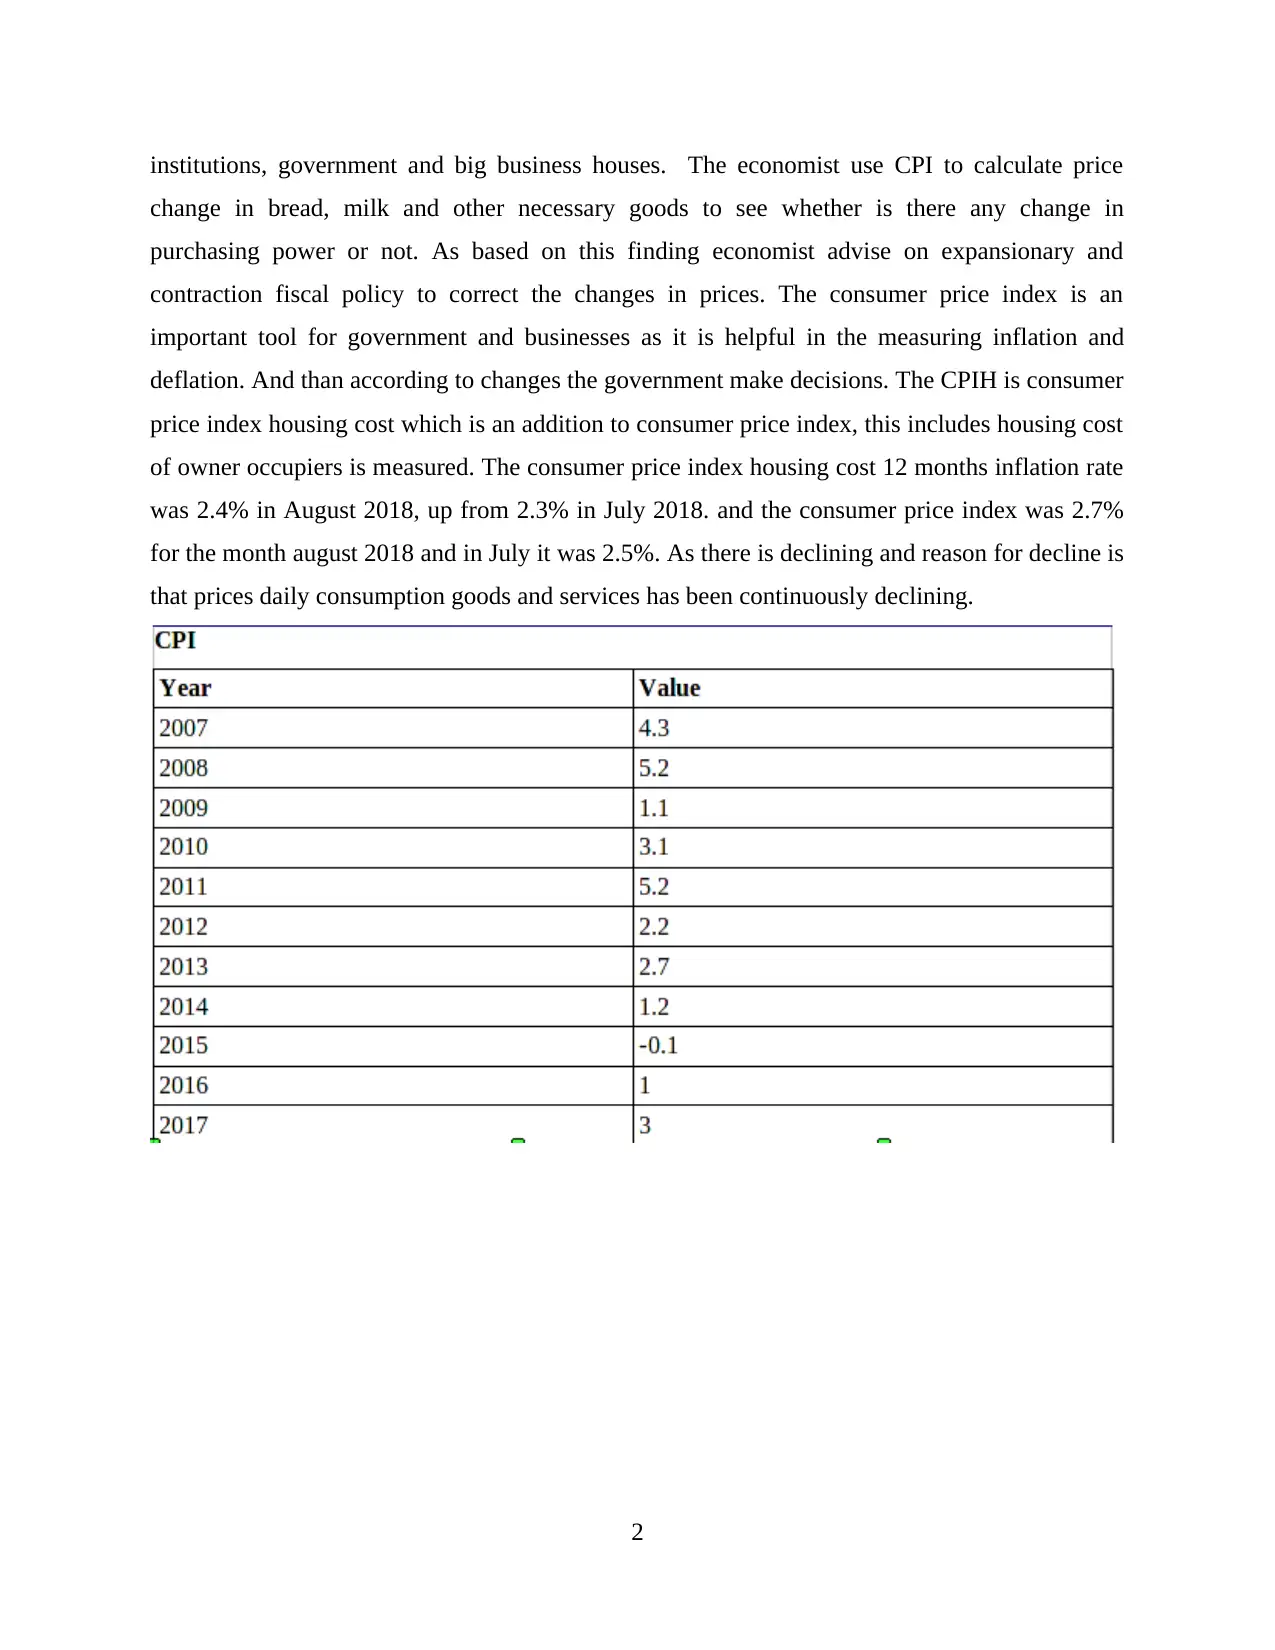
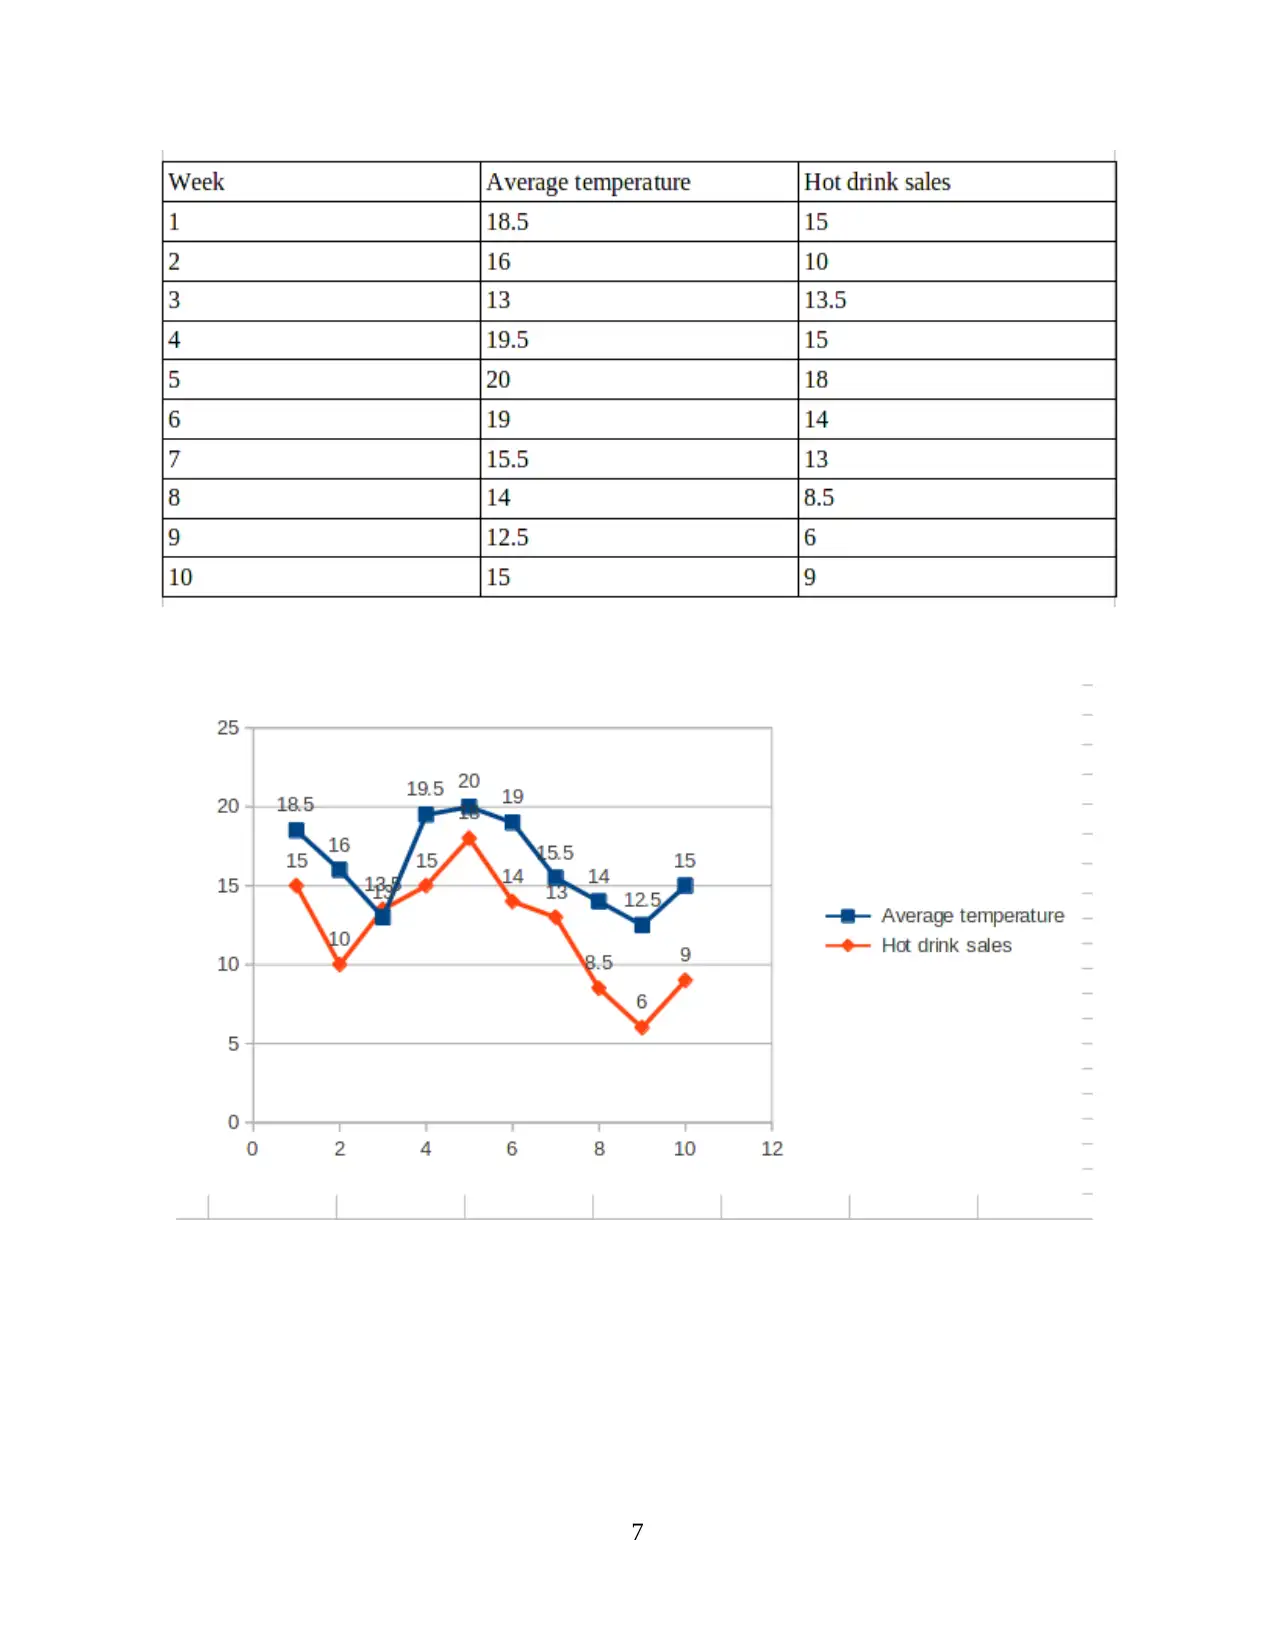
This report provides an analysis of business and economic data, focusing on statistical methods for evaluating situations and making effective decisions. It explores the Consumer Price Index (CPI) and Retail Price Index (RPI), explaining their significance in measuring inflation and the cost of living. The report also delves into scatter diagrams and correlation coefficients, demonstrating their use in analyzing relationships between variables, such as hot drink sales and temperature. Furthermore, it covers equations for predicting future sales, equipping businesses with tools for maximizing profits through accurate forecasting. The report emphasizes the importance of data in business planning and decision-making, offering valuable insights for understanding economic trends and making informed strategic choices. The report is a valuable resource for students studying statistics for management, providing a clear understanding of key concepts and practical applications.
1 out of 22
Related Documents


Your All-in-One AI-Powered Toolkit for Academic Success.
+13062052269
info@desklib.com
Available 24*7 on WhatsApp / Email
![[object Object]](/_next/static/media/star-bottom.7253800d.svg)
Copyright © 2020–2026 A2Z Services. All Rights Reserved. Developed and managed by ZUCOL.