Statistics for Managerial Decisions
VerifiedAdded on 2022/11/15
|13
|914
|170
AI Summary
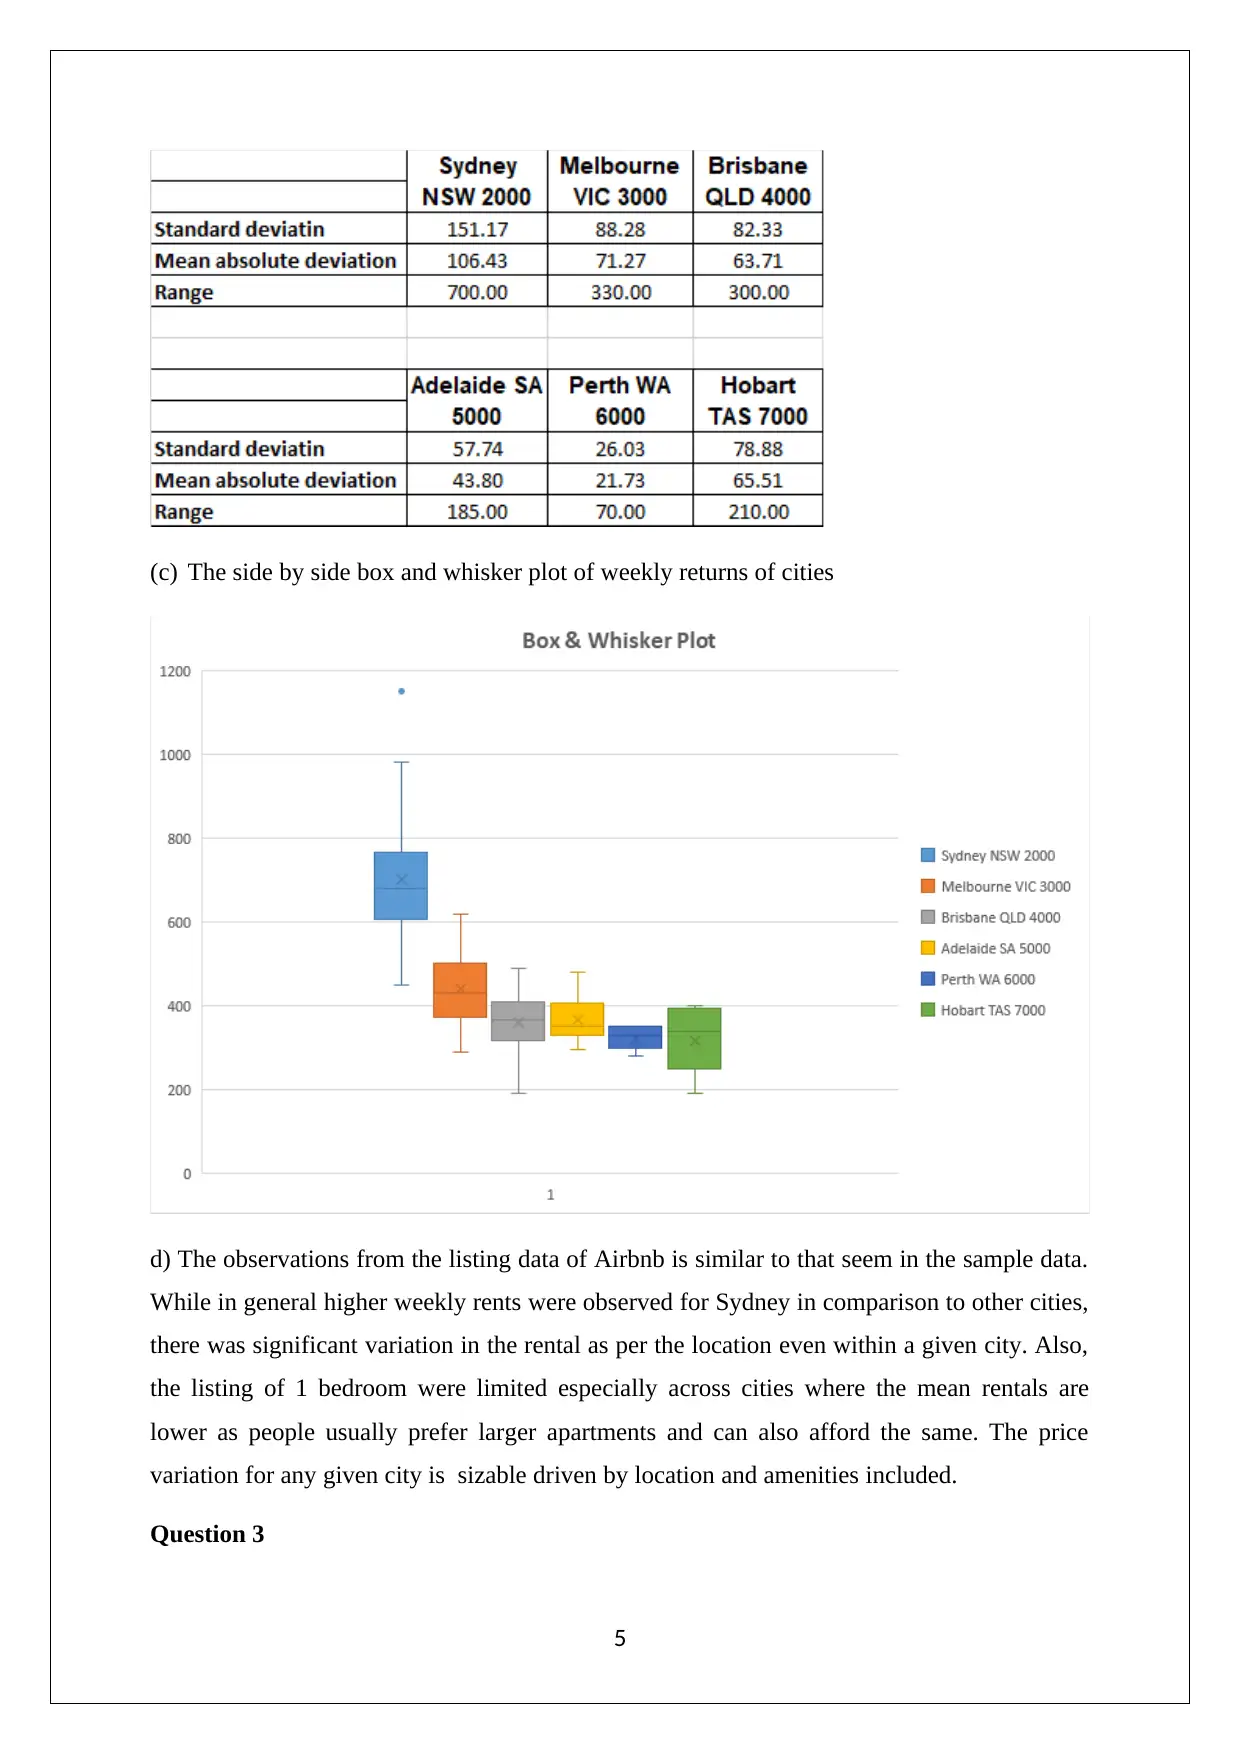
The document covers various statistical concepts such as stem-and-leaf plot, constructed histogram, bar chart, probability, normal distribution, and confidence interval. It also provides solutions to questions related to investment stock, weekly returns of cities, Airbnb listing data, and variables contributing to heart disease.
Contribute Materials
Your contribution can guide someone’s learning journey. Share your
documents today.
![Document Page](https://desklib.com/media/document/docfile/pages/statistics-for-managerial-decisions-my1i/2024/09/26/d84a5ac2-3e0a-469d-8e04-f27681f4b848-page-1.webp)
STATISTICS FOR MANAGERIAL DECISIONS
STUDENT ID:
[Pick the date]
STUDENT ID:
[Pick the date]
Secure Best Marks with AI Grader
Need help grading? Try our AI Grader for instant feedback on your assignments.
![Document Page](https://desklib.com/media/document/docfile/pages/statistics-for-managerial-decisions-my1i/2024/09/26/3ea5b63e-dd72-4c75-9062-d5c9fae0595f-page-2.webp)
Question 1
(a) The list of quarterly stock prices (opening)FPHand RMD in two different tables is shown
below.
January April July October
2009 2.63 2.53 2.52 2.58
2010 2.93 3.48 3.61 3.43
2011 3.41 2.91 2.91 2.85
2012 2.49 3 3.06 3.89
2013 3.96 4.42 4.9 5.7
2014 5.31 4.81 5.4 5.63
2015 6.91 9.42 7.3 7.3
2016 7.4 7.52 8.41 8.48
2017 8.59 9.39 10.07 9.76
2018 10.89 12.47 14.18 15.91
Res Med Inc
January April July October
2009 2.72 2.55 2.35 2.63
2010 2.76 2.54 2.57 2.28
2011 2.33 2.33 2.13 1.99
2012 1.86 1.75 1.52 1.83
2013 1.99 2.11 2.89 3.22
2014 3.59 3.98 4.43 4.65
2015 5.85 6.42 6.09 6.47
2016 8.36 8.93 9.65 9.51
2017 8.19 8.91 10.89 11.72
2018 12.83 12.28 13.75 13.71
Fisher and Paykel Healthcare
Stem-and leaf plot
2
![Document Page](https://desklib.com/media/document/docfile/pages/statistics-for-managerial-decisions-my1i/2024/09/26/bed5e759-5aa9-4351-b230-0bd95dc41e21-page-3.webp)
(b) Constructed histogram for the relative frequency of RMD and FPH polygon for
cumulative frequency
(c) Bar chart of market capitals in 2018 of ASX listed companies in (million Australian
dollars)
(d) For determining the better investment stock between the choice of the two stocks
provided, it is imperative to consider the following parameters related to the stocks as
obtained from Yahoo finance.
3
![Document Page](https://desklib.com/media/document/docfile/pages/statistics-for-managerial-decisions-my1i/2024/09/26/81a07e91-0389-4c6d-af59-c9aa6d98b049-page-4.webp)
Clearly the systematic risk associated with FPH stock is significantly more in comparison
with RMD which has a lower beta value. Also, the dividend yield expected on RMD stock is
superior to that of FPH. Finally, despite both stocks having shown comparable growth in
topline and profits during the last year, the P/E ratio is higher for FPH which may indicate
that the stock is potentially overvalued. As a result, the better choice for investment is RMD
stock.
Question 2
(a) Relevant table for “(mean, median, first quartile, third quartile of the weekly return of
city)”
(b) Relevant table for “(standard deviation, range and mean absolute deviation of the weekly
return of city)”
4
Secure Best Marks with AI Grader
Need help grading? Try our AI Grader for instant feedback on your assignments.
![Document Page](https://desklib.com/media/document/docfile/pages/statistics-for-managerial-decisions-my1i/2024/09/26/b4aab9a3-2cfa-4bb5-8fc7-8ac47ba66682-page-5.webp)
(c) The side by side box and whisker plot of weekly returns of cities
d) The observations from the listing data of Airbnb is similar to that seem in the sample data.
While in general higher weekly rents were observed for Sydney in comparison to other cities,
there was significant variation in the rental as per the location even within a given city. Also,
the listing of 1 bedroom were limited especially across cities where the mean rentals are
lower as people usually prefer larger apartments and can also afford the same. The price
variation for any given city is sizable driven by location and amenities included.
Question 3
5
![Document Page](https://desklib.com/media/document/docfile/pages/statistics-for-managerial-decisions-my1i/2024/09/26/1b7ea12a-175e-47c2-b668-56be993b2636-page-6.webp)
(a) “Probability that a tourist from oversees picks canola crop filed while visiting Australia”
P =2538678/ (4623527+2538678+371339+955321+11720277)=0.1256
(b) “Probability that a randomly selected truckcarries wheatwhich is grown in New South
Wales(NSW)”
= 9556517/ ((2755310+1201045+403121+483081+9556517)) =0.6637
(c) “Probability that barley was grown in SA (conspiring that barley does not grow in WA
and Tas)”
Barley Yield
Required probability can be computed in the manner indicated as follows.
(d) The unreliable estimate is for grain sorghum grown in South Australia state. As per ABS,
these estimates contain a relative standard error that well goes beyond 50% that make this
data unsuitable for general use.
Question 4
(a) Weekly rainfall event follows a Poissondistribution.
6
![Document Page](https://desklib.com/media/document/docfile/pages/statistics-for-managerial-decisions-my1i/2024/09/26/d7e68e1d-b53d-4f9c-bd70-121a46684184-page-7.webp)
(b) Weekly rainfall event follows a Normal distribution.
(i) Probability that in a week there is rainfall between 10 mm and 50 mm
(ii
)
7
(i) Probability that in a week there is rainfall between 10 mm and 50 mm
(ii
)
7
Paraphrase This Document
Need a fresh take? Get an instant paraphrase of this document with our AI Paraphraser
![Document Page](https://desklib.com/media/document/docfile/pages/statistics-for-managerial-decisions-my1i/2024/09/26/87d66114-5fcb-4500-99d4-ca0fd91b3b98-page-8.webp)
Question 5
(a) Test of normality of variables through normal probability plot
The above normal probability plot has a linear trend. Also, the effect of outliers seems to be
minimal on the linear trend observed. Hence, the resting blood pressure can be deemed to be
normally distributed.
8
(a) Test of normality of variables through normal probability plot
The above normal probability plot has a linear trend. Also, the effect of outliers seems to be
minimal on the linear trend observed. Hence, the resting blood pressure can be deemed to be
normally distributed.
8
![Document Page](https://desklib.com/media/document/docfile/pages/statistics-for-managerial-decisions-my1i/2024/09/26/45983175-5efb-46f5-bcf4-1fb82b7b3a17-page-9.webp)
The above normal probability plot has a linear trend which is distorted by one outlier on the
upper end. If this value is discarded, then the remaining data seems to fit broadly in a linear
trend. Thus, the serum cholesterol can be deemed to be normally distributed.
9
upper end. If this value is discarded, then the remaining data seems to fit broadly in a linear
trend. Thus, the serum cholesterol can be deemed to be normally distributed.
9
![Document Page](https://desklib.com/media/document/docfile/pages/statistics-for-managerial-decisions-my1i/2024/09/26/bd663e6c-1dc1-449b-91e6-67c1f49b7275-page-10.webp)
The above normal probability plot has a linear trend. Also, the effect of outliers seems to be
minimal on the linear trend observed. Hence, the maximum heart rate achieved can be
deemed to be normally distributed.
The key impediment in the linear trend are some of the values on the lower end which
production distortion and cause a vertical decline. However, if these observations can be
ignored, then the remaining points fit a linear trend. This would imply that the given variable
can be approximately considered as normally distributed.
(b) 90% confidence interval for the normally distributed variables with and without heart
disease
Absence Heart Disease
10
Secure Best Marks with AI Grader
Need help grading? Try our AI Grader for instant feedback on your assignments.
![Document Page](https://desklib.com/media/document/docfile/pages/statistics-for-managerial-decisions-my1i/2024/09/26/99b9e207-b53a-4a5d-aa7d-80bca742869e-page-11.webp)
11
![Document Page](https://desklib.com/media/document/docfile/pages/statistics-for-managerial-decisions-my1i/2024/09/26/2a719872-0641-45eb-a9bc-4563f8eb9a2c-page-12.webp)
Presence Heart Disease
Conclusion
12
Conclusion
12
![Document Page](https://desklib.com/media/document/docfile/pages/statistics-for-managerial-decisions-my1i/2024/09/26/a9e2ee5f-cc08-4757-b872-4dc34a0a8637-page-13.webp)
Out of the given four variables, suitable variables need to be found which can be of help in
determining the variables which can contribute in segregating patients suffering from heart
disease from other patients who do not suffer from the same. The key is that the confidence
intervals for the presence of heart disease and absence of heart disease for a variable must not
overlap. This would indicate that based on the identified value of the parameter, it can be
determined if the patient is suffering from heart disease or not. The observation for the four
variables is indicated below.
1) Resting blood pressure – NO overlapping between confidence intervals and hence can
be used to determine if the patient is suffering from heart disease or not.
2) Oldpeak - NO overlapping between confidence intervals and hence can be used to
determine if the patient is suffering from heart disease or not.
3) Maximum heart rate achieved - NO overlapping between confidence intervals and
hence can be used to determine if the patient is suffering from heart disease or not.
4) Serum Cholesterol – Overlapping is visible between confidence intervals and hence
cannot be used to determine if the patient is suffering from heart disease or not.
13
1 out of 13
Related Documents
![[object Object]](/_next/image/?url=%2F_next%2Fstatic%2Fmedia%2Flogo.6d15ce61.png&w=640&q=75)
Your All-in-One AI-Powered Toolkit for Academic Success.
+13062052269
info@desklib.com
Available 24*7 on WhatsApp / Email
Unlock your academic potential
© 2024 | Zucol Services PVT LTD | All rights reserved.