Interval Estimation Assignment: Statistics for Management Decisions
VerifiedAdded on 2021/05/31
|11
|757
|17
Homework Assignment
AI Summary
This document presents a comprehensive solution to an interval estimation assignment, likely for a statistics course. It covers various problems involving the calculation of confidence intervals using both t-distributions and z-scores. The solution includes detailed calculations for different confidence lev...
STATISTICS FOR MGMT DECISIONS
Assignment
[Pick the date]
Student Name
Assignment
[Pick the date]
Student Name
Paraphrase This Document
Need a fresh take? Get an instant paraphrase of this document with our AI Paraphraser
SECTION A
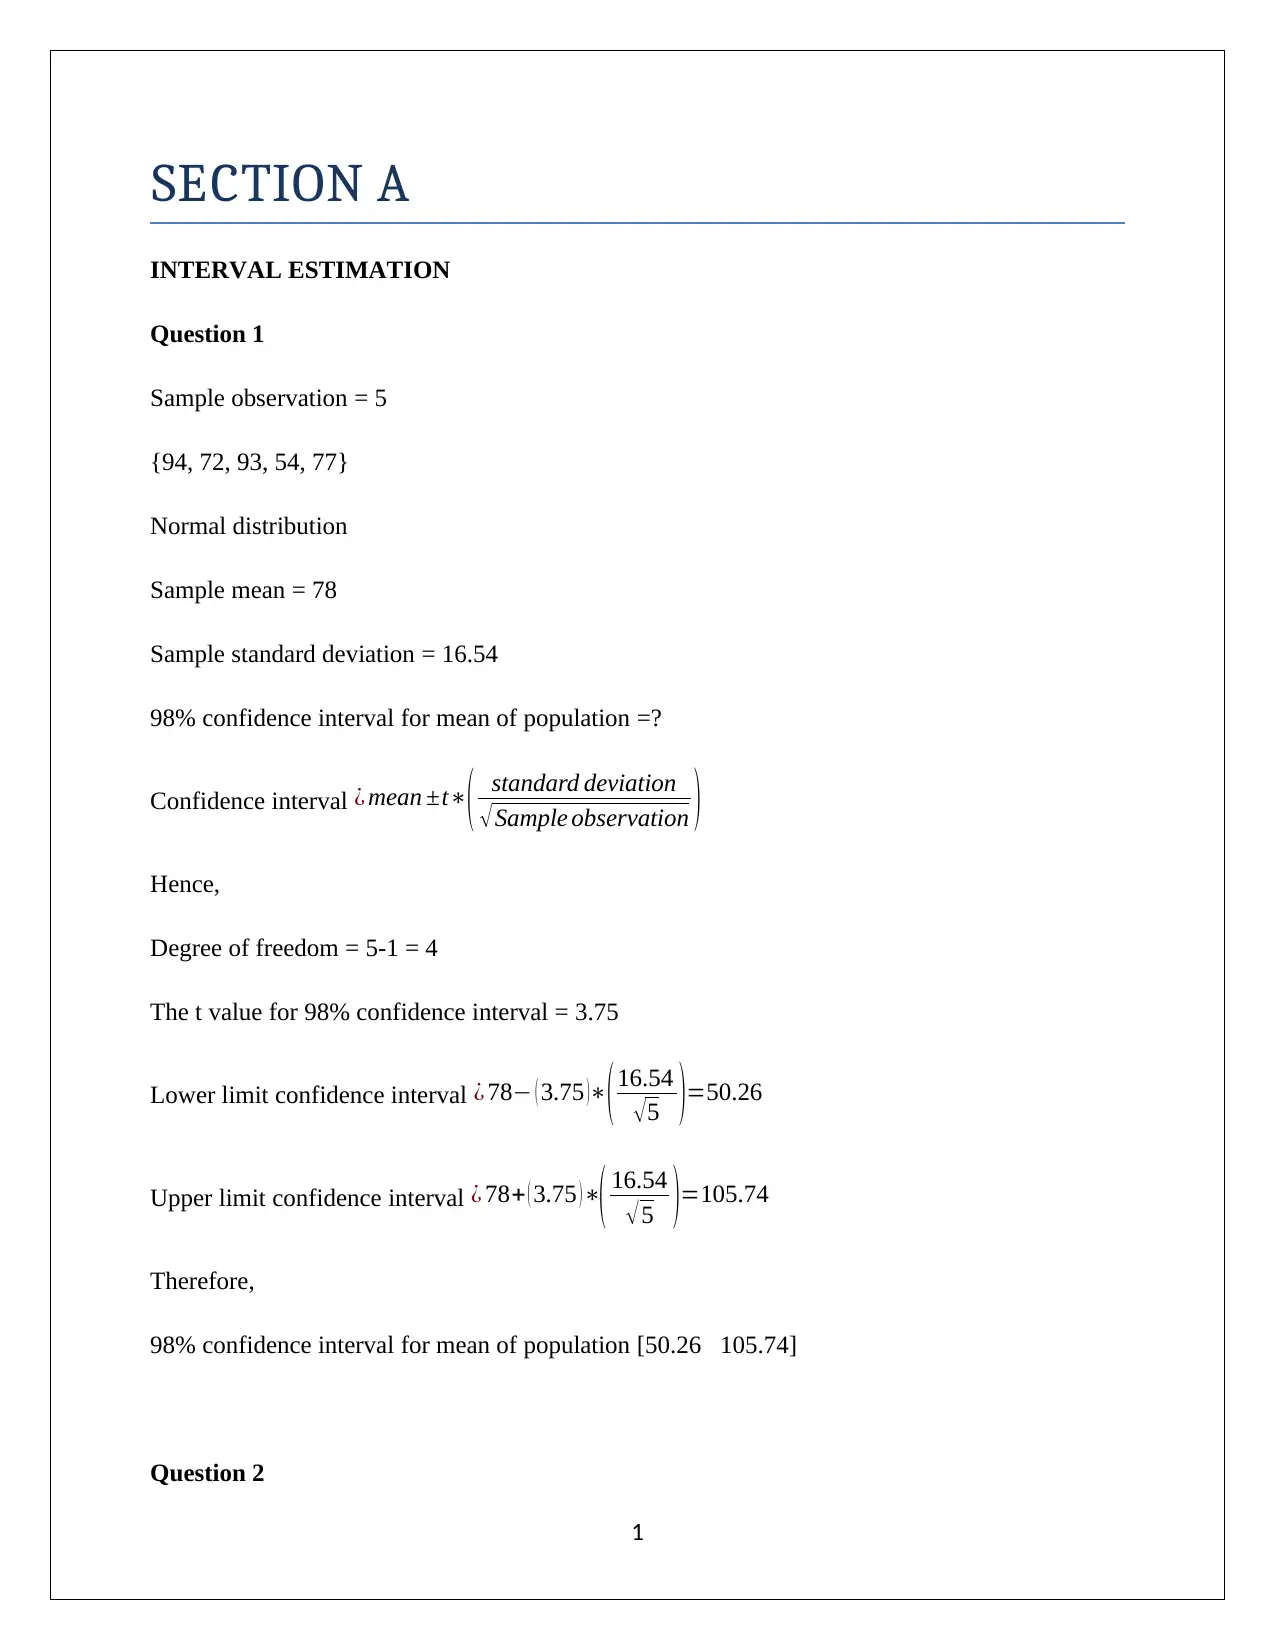
INTERVAL ESTIMATION
Question 1
Sample observation = 5
{94, 72, 93, 54, 77}
Normal distribution
Sample mean = 78
Sample standard deviation = 16.54
98% confidence interval for mean of population =?
Confidence interval ¿ mean ±t∗
( standard deviation
√Sample observation )
Hence,
Degree of freedom = 5-1 = 4
The t value for 98% confidence interval = 3.75
Lower limit confidence interval ¿ 78− ( 3.75 )∗(16.54
√5 )=50.26
Upper limit confidence interval ¿ 78+ ( 3.75 )∗
( 16.54
√ 5 )=105.74
Therefore,
98% confidence interval for mean of population [50.26 105.74]
Question 2
1
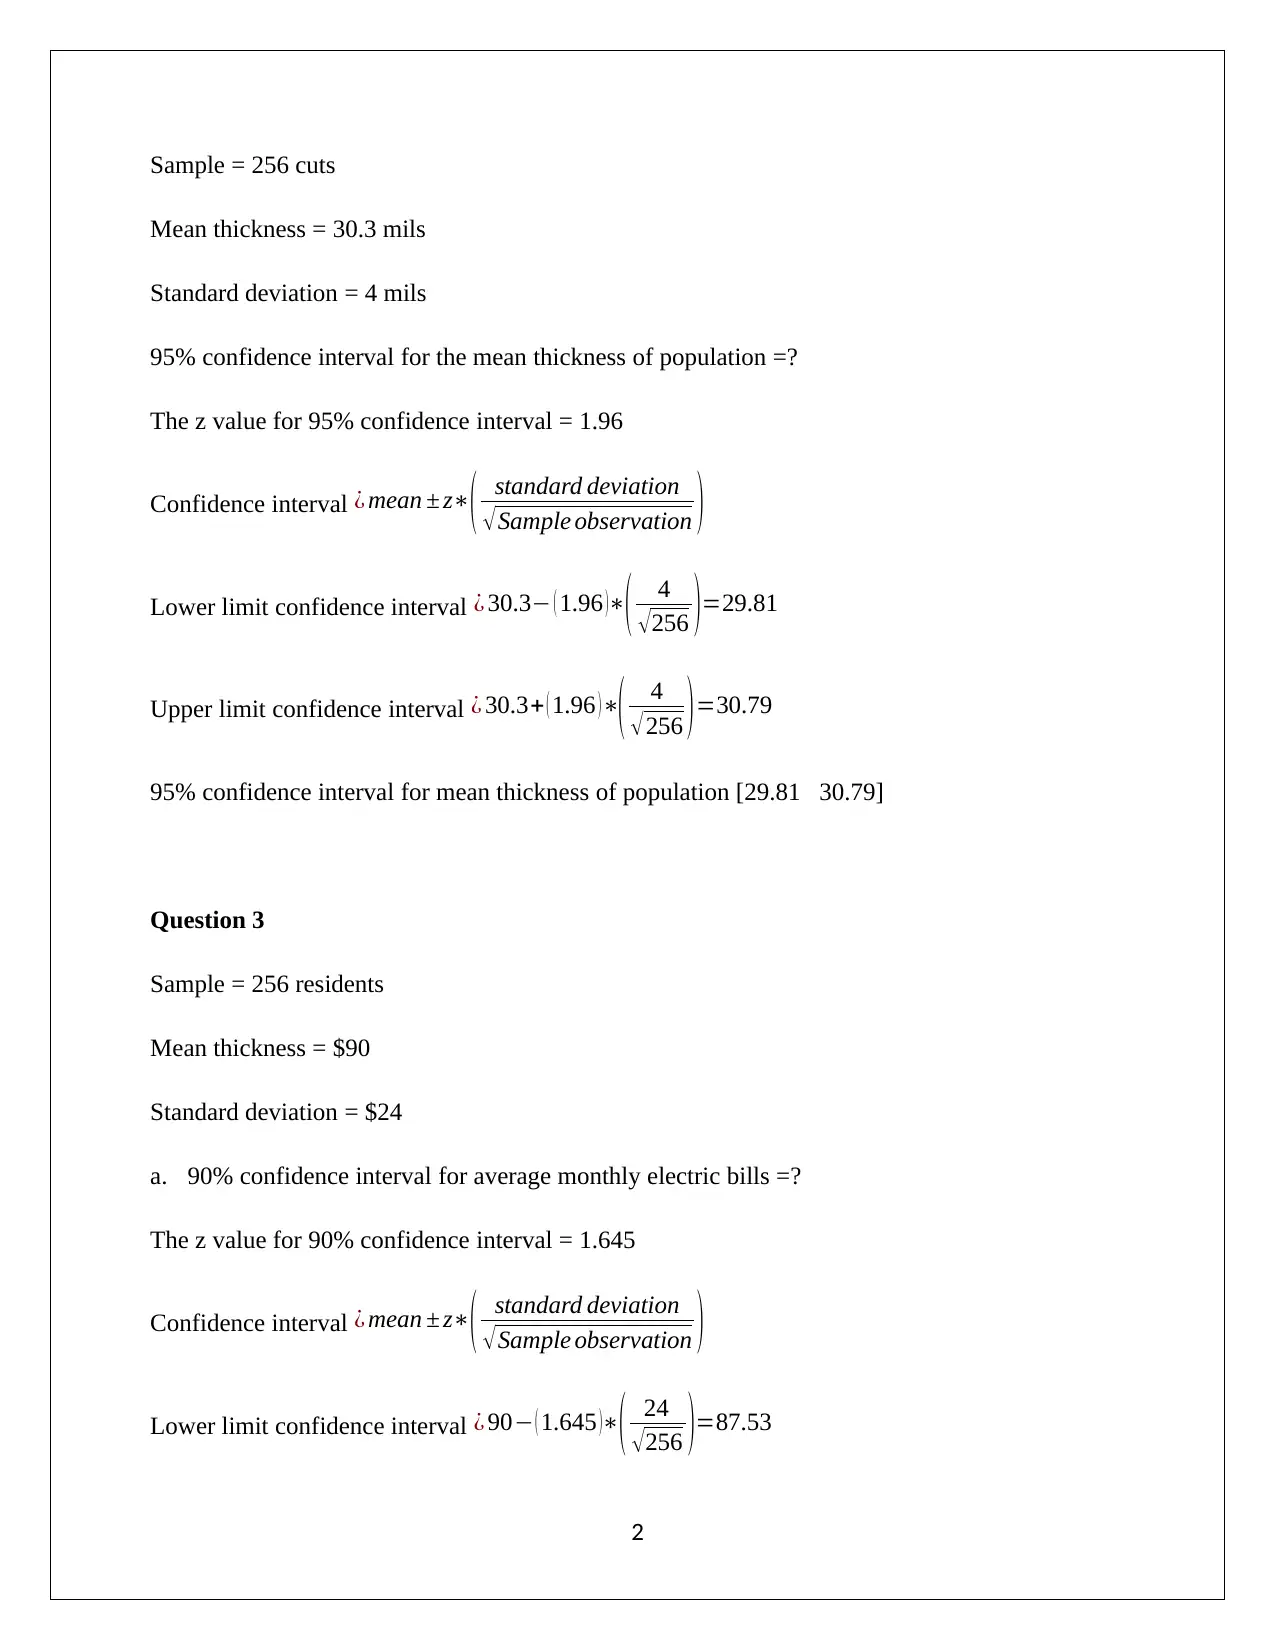
Sample = 256 cuts
Mean thickness = 30.3 mils
Standard deviation = 4 mils
95% confidence interval for the mean thickness of population =?
The z value for 95% confidence interval = 1.96
Confidence interval ¿ mean ± z∗
( standard deviation
√Sample observation )
Lower limit confidence interval ¿ 30.3− ( 1.96 )∗
( 4
√256 )=29.81
Upper limit confidence interval ¿ 30.3+ ( 1.96 )∗
( 4
√256 )=30.79
95% confidence interval for mean thickness of population [29.81 30.79]
Question 3
Sample = 256 residents
Mean thickness = $90
Standard deviation = $24
a. 90% confidence interval for average monthly electric bills =?
The z value for 90% confidence interval = 1.645
Confidence interval ¿ mean ± z∗
( standard deviation
√Sample observation )
Lower limit confidence interval ¿ 90− ( 1.645 )∗( 24
√256 )=87.53
2
⊘ This is a preview!⊘
Do you want full access?
Subscribe today to unlock all pages.
Trusted by 1+ million students worldwide
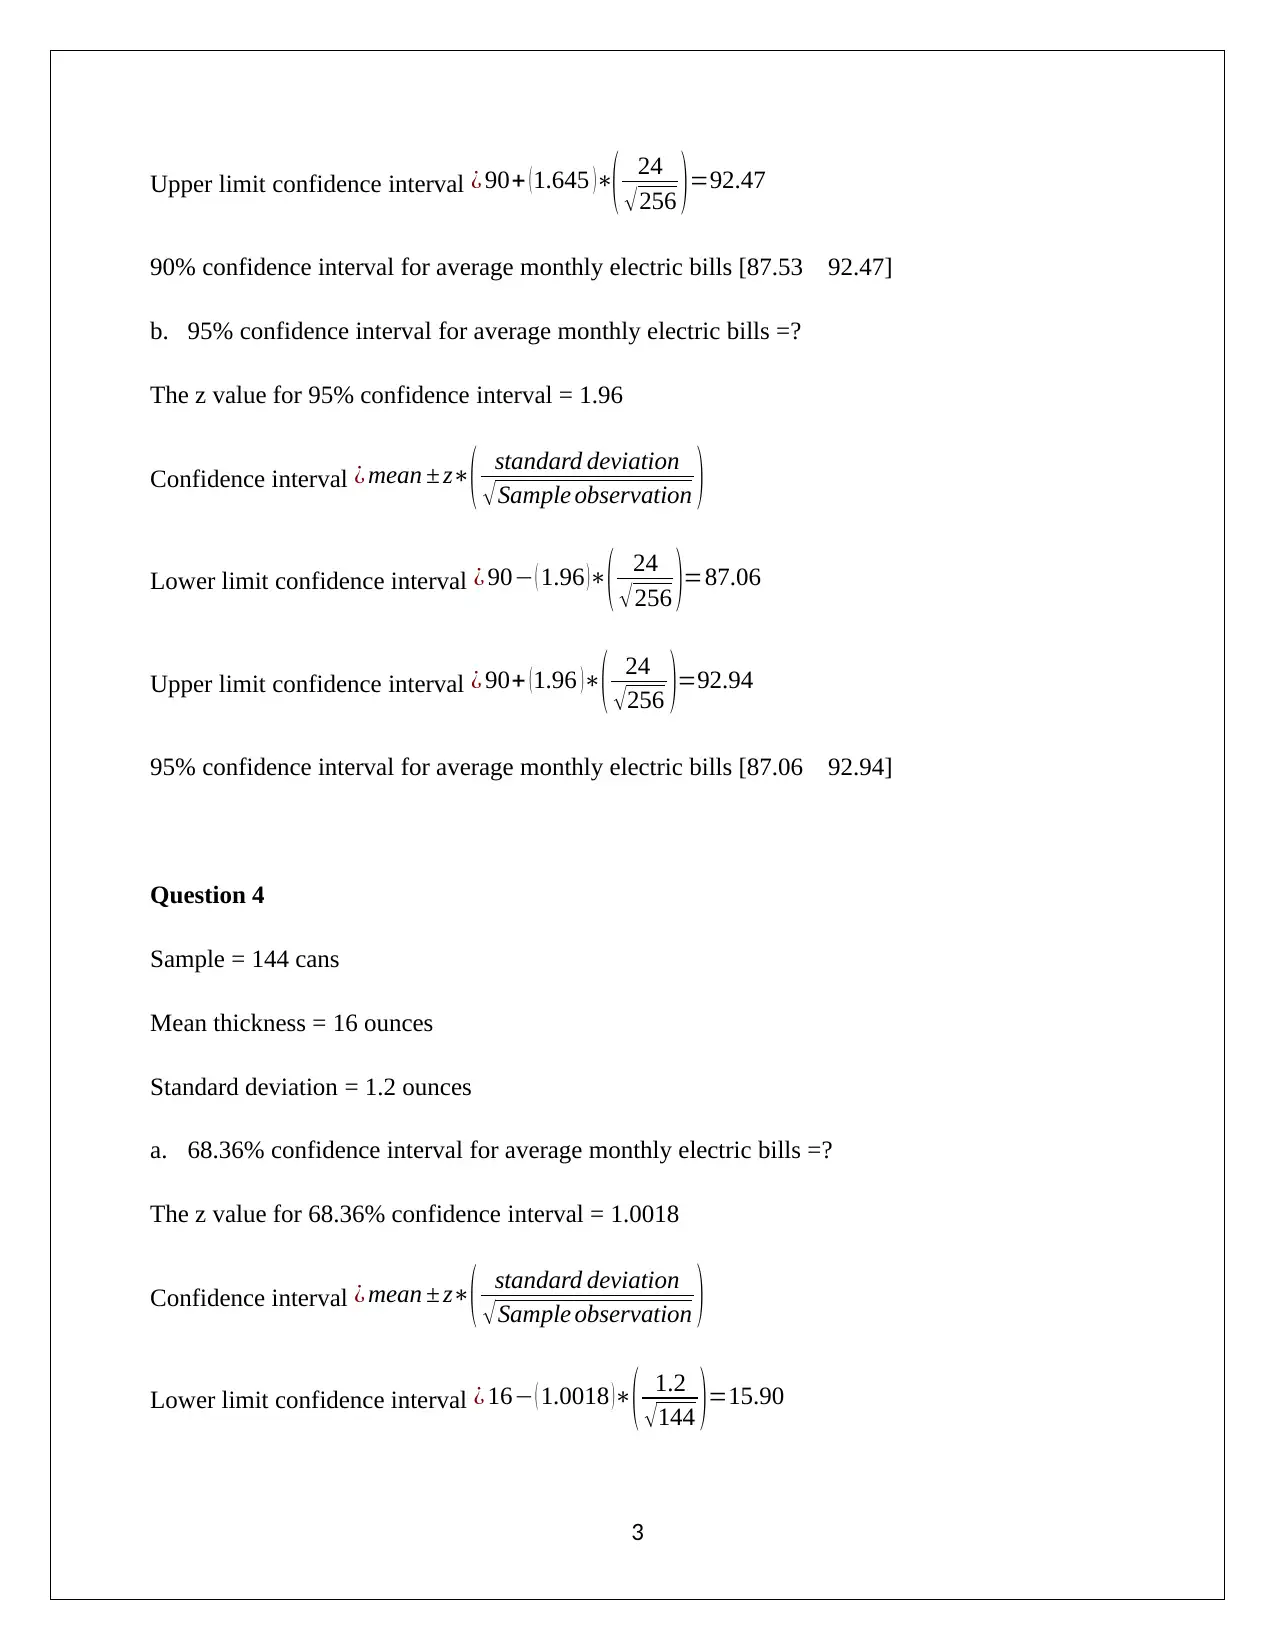
Upper limit confidence interval ¿ 90+ ( 1.645 )∗( 24
√ 256 ) =92.47
90% confidence interval for average monthly electric bills [87.53 92.47]
b. 95% confidence interval for average monthly electric bills =?
The z value for 95% confidence interval = 1.96
Confidence interval ¿ mean ± z∗
( standard deviation
√Sample observation )
Lower limit confidence interval ¿ 90− ( 1.96 )∗
( 24
√ 256 )=87.06
Upper limit confidence interval ¿ 90+ (1.96 )∗( 24
√256 )=92.94
95% confidence interval for average monthly electric bills [87.06 92.94]
Question 4
Sample = 144 cans
Mean thickness = 16 ounces
Standard deviation = 1.2 ounces
a. 68.36% confidence interval for average monthly electric bills =?
The z value for 68.36% confidence interval = 1.0018
Confidence interval ¿ mean ± z∗( standard deviation
√Sample observation )
Lower limit confidence interval ¿ 16− ( 1.0018 )∗
( 1.2
√144 )=15.90
3
Paraphrase This Document
Need a fresh take? Get an instant paraphrase of this document with our AI Paraphraser
Upper limit confidence interval ¿ 16+ ( 1.0018 )∗( 1.2
√144 )=16.10
68.36% confidence interval [5.90 16.10]
b. 95% confidence interval for average monthly electric bills =?
The z value for 95% confidence interval = 1.96
Lower limit confidence interval ¿ 16− ( 1.96 )∗
( 1.2
√ 144 )=15.80
Upper limit confidence interval ¿ 16+ ( 1.96 )∗
( 1.2
√144 )=16.20
95% confidence interval [15.80 16.20]
PART B
Area under the Standard Normal Curve
(a) Area between z =0 and z = 2.5
Area ¿ P ( 0<Z<2.5 )
From standard normal table:
P ( z ≤ 2.5 )=0.99379
P ( z ≤ 0 )=0.5
Area ¿ P ( 0<Z<2.5 )=P ( z ≤ 2.5 )−P ( z ≤ 0 ) =0.99379−0.5=0.49379
4
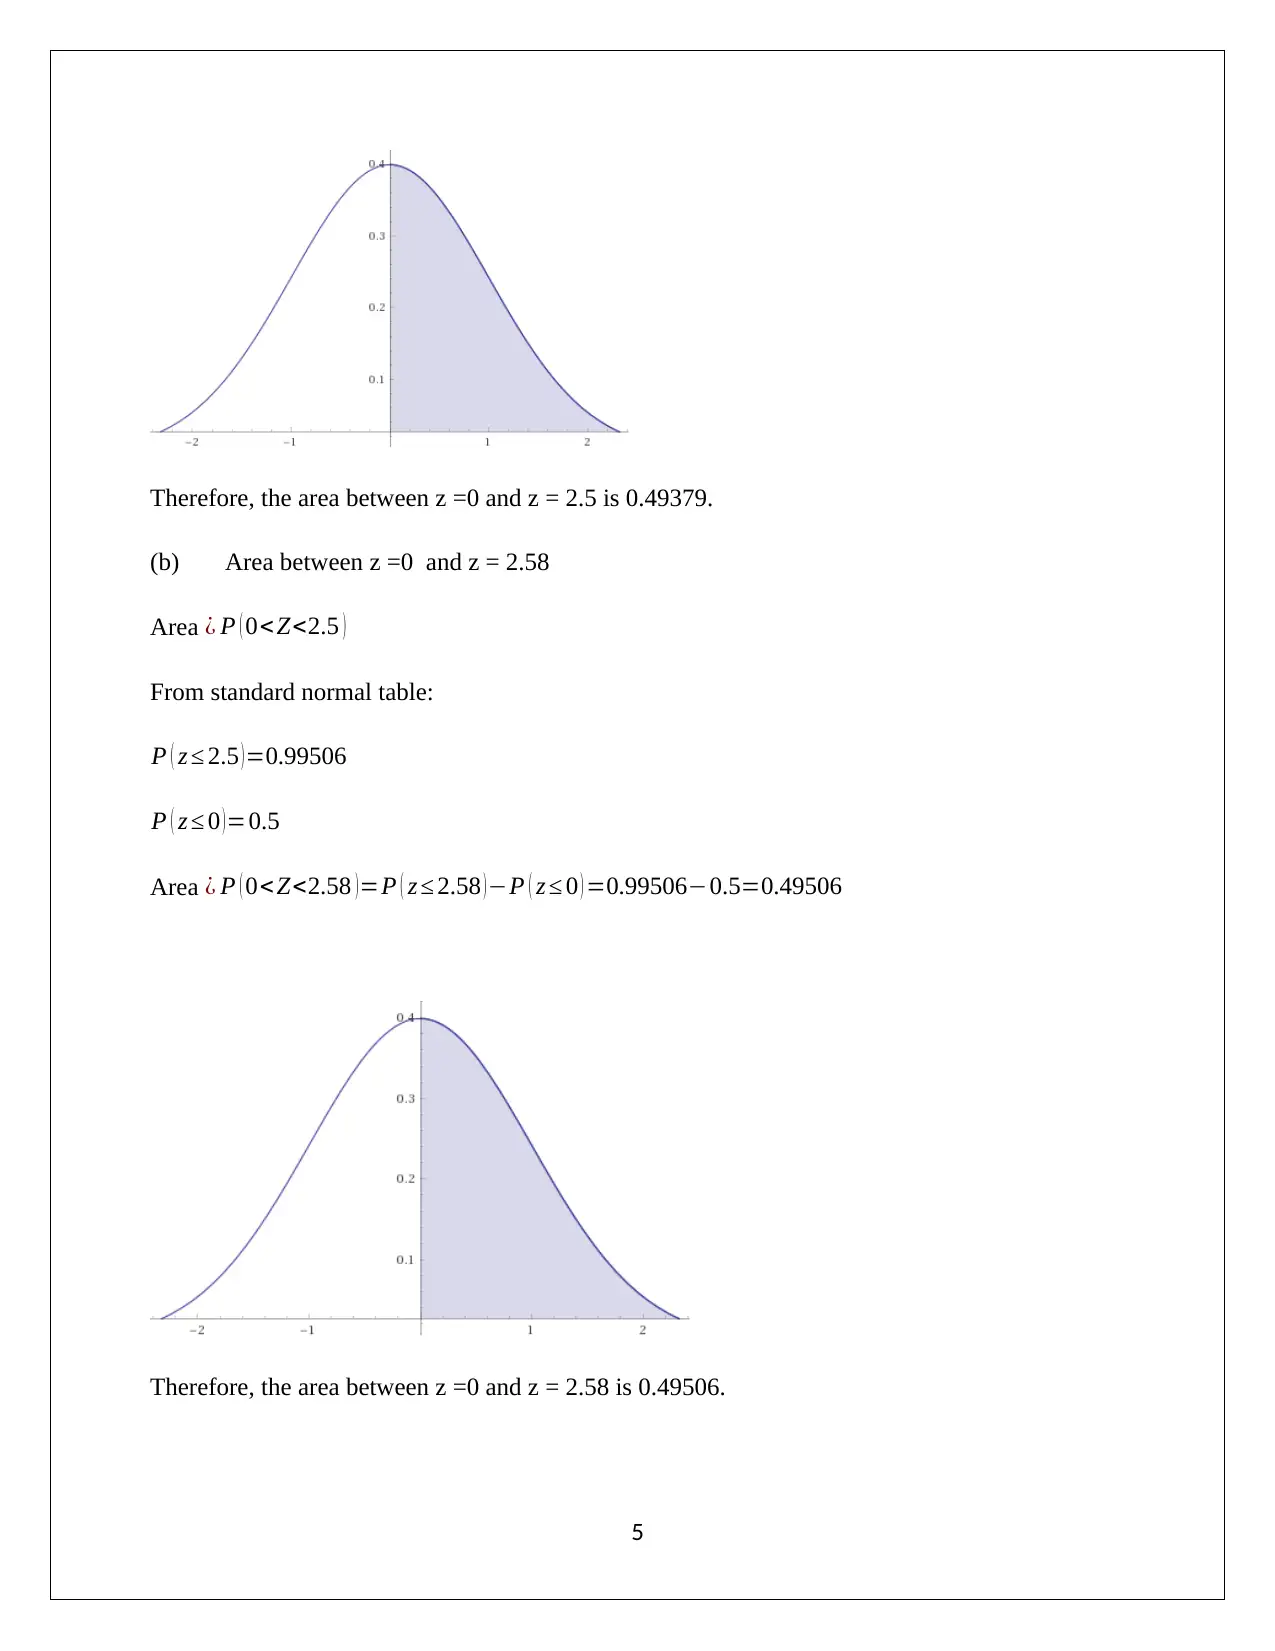
Therefore, the area between z =0 and z = 2.5 is 0.49379.
(b) Area between z =0 and z = 2.58
Area ¿ P ( 0<Z<2.5 )
From standard normal table:
P ( z ≤ 2.5 )=0.99506
P ( z ≤ 0 )=0.5
Area ¿ P ( 0<Z<2.58 )=P ( z ≤ 2.58 )−P ( z ≤ 0 ) =0.99506−0.5=0.49506
Therefore, the area between z =0 and z = 2.58 is 0.49506.
5
(b) Area between z =0 and z = 2.58
Area ¿ P ( 0<Z<2.5 )
From standard normal table:
P ( z ≤ 2.5 )=0.99506
P ( z ≤ 0 )=0.5
Area ¿ P ( 0<Z<2.58 )=P ( z ≤ 2.58 )−P ( z ≤ 0 ) =0.99506−0.5=0.49506
Therefore, the area between z =0 and z = 2.58 is 0.49506.
5
⊘ This is a preview!⊘
Do you want full access?
Subscribe today to unlock all pages.
Trusted by 1+ million students worldwide
(c) Mean μ= 270 points
Standard deviationσ = 35 points
Probability that a randomly chosen student will score between 200 and 340 points =?
P ( 200< x<340 )=P ( 200−270< x−μ<340−270 )
¿ P ( 200−270
35 < x−μ
σ < 340−270
35 )
¿ P ( −2< z< 2 )
From standard normal table:
P ( z ≤ 2¿¿ 0.97725 )
P ( z ≤−2 )=0.02275
¿ P (−2< z<2 )=P ( z< ¿ 2 )−P ( z <¿−2 )=0.97725−0.02275=0.9545
Hence, probability that a randomly chosen student will score between 200 and 340 points is
0.9545.
(d) Mean score μ = 270 points
Standard deviation σ = 35 points
Normal distribution
Let the score that put a student in 95th percentile is x.
The z score for 95th percentile = 1.644854
Hence,
z= x−μ
σ
6
Paraphrase This Document
Need a fresh take? Get an instant paraphrase of this document with our AI Paraphraser
1.644854= x −270
35
x=327.57
Thus, the score that put a student in 95th percentile is 327.57.
Hence, the minimum cut-off score would be 327.57.
INTERVAL ESTIMATION
Question 1
Sample = 225 phones
Sample mean = 6.5 min
Standard deviation = 1.5 min
99% confidence interval =?
Degree of freedom = 225-1 = 224
The t value for 99% confidence interval = 2.6
Confidence interval ¿ mean ±t∗
( standard deviation
√Sample observation )
Lower limit confidence interval ¿ 6.5− ( 2.6 )∗
( 1.5
√225 )=6.24
Upper limit confidence interval ¿ 6.5+ ( 2.6 )∗( 1.5
√225 )=6.76
7
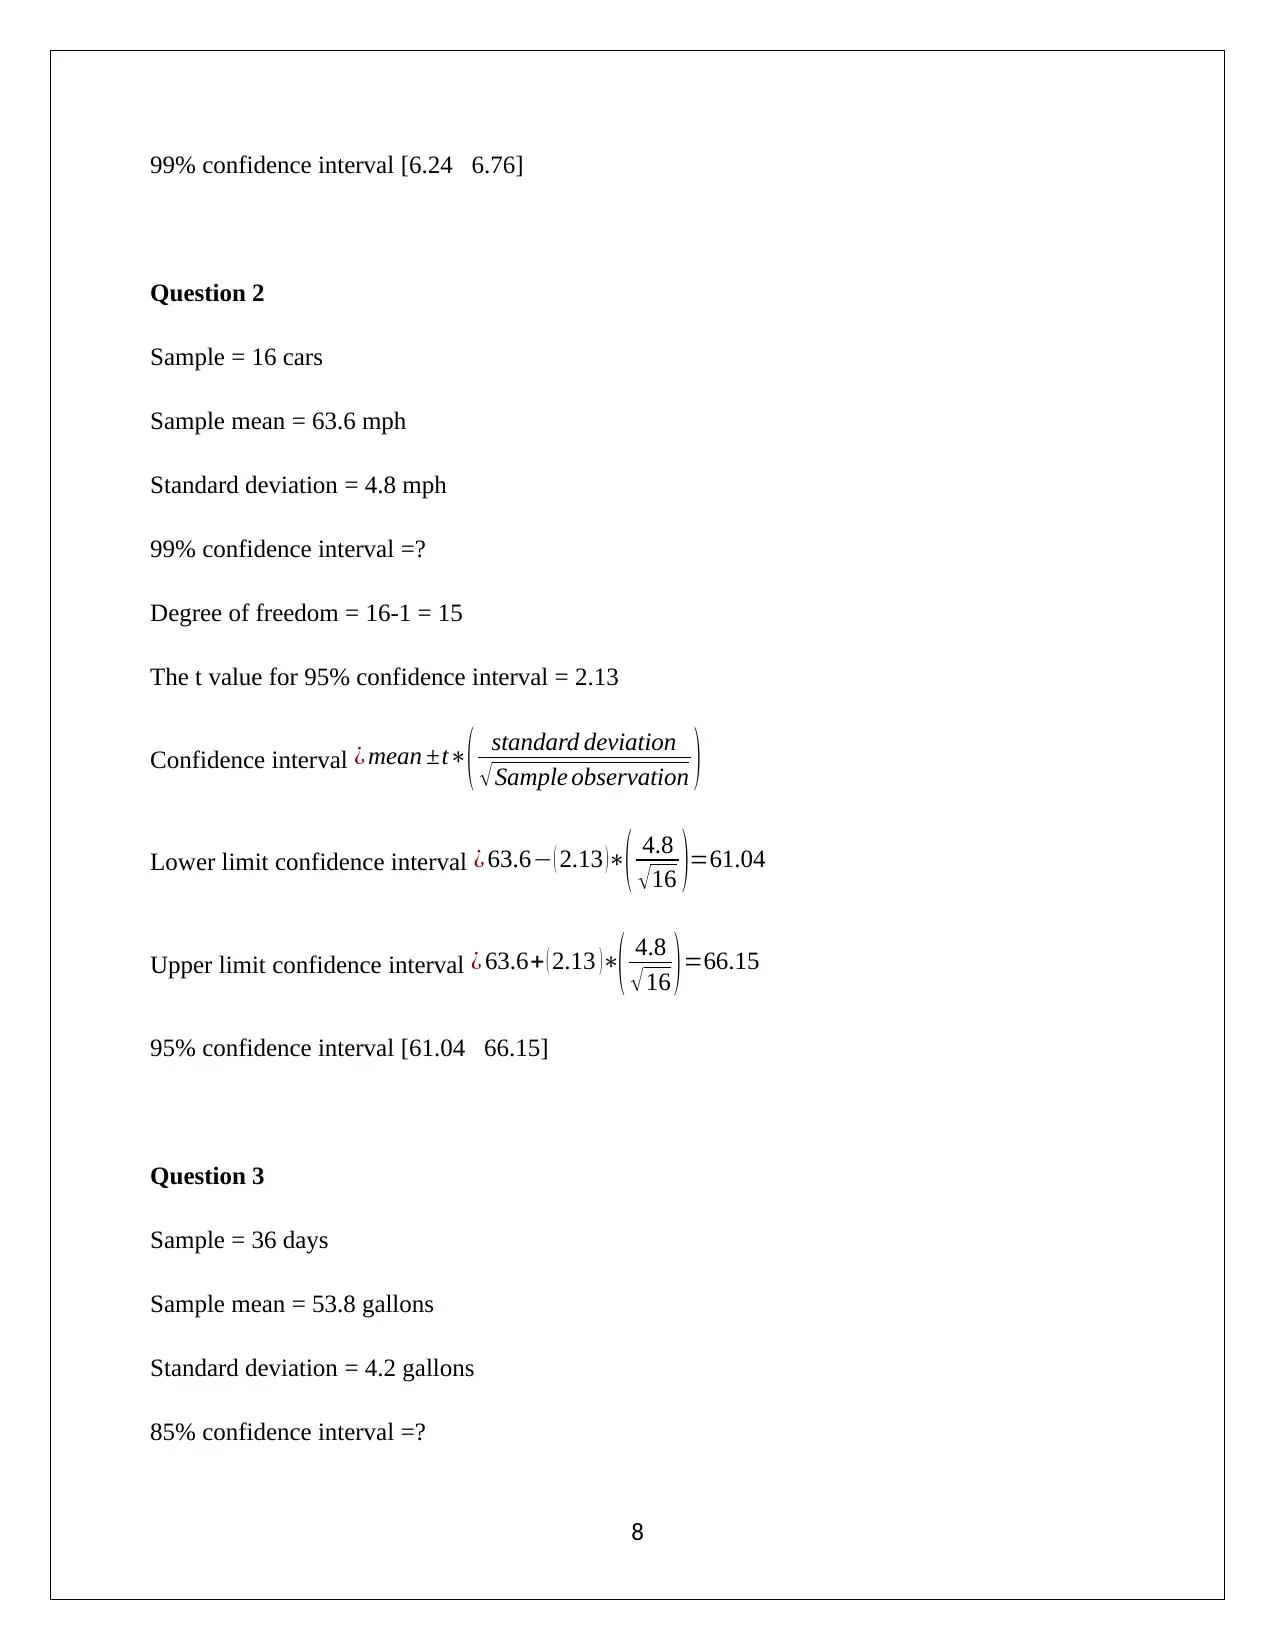
99% confidence interval [6.24 6.76]
Question 2
Sample = 16 cars
Sample mean = 63.6 mph
Standard deviation = 4.8 mph
99% confidence interval =?
Degree of freedom = 16-1 = 15
The t value for 95% confidence interval = 2.13
Confidence interval ¿ mean ±t∗
( standard deviation
√Sample observation )
Lower limit confidence interval ¿ 63.6− ( 2.13 )∗
( 4.8
√16 )=61.04
Upper limit confidence interval ¿ 63.6+ ( 2.13 )∗( 4.8
√16 )=66.15
95% confidence interval [61.04 66.15]
Question 3
Sample = 36 days
Sample mean = 53.8 gallons
Standard deviation = 4.2 gallons
85% confidence interval =?
8
⊘ This is a preview!⊘
Do you want full access?
Subscribe today to unlock all pages.
Trusted by 1+ million students worldwide
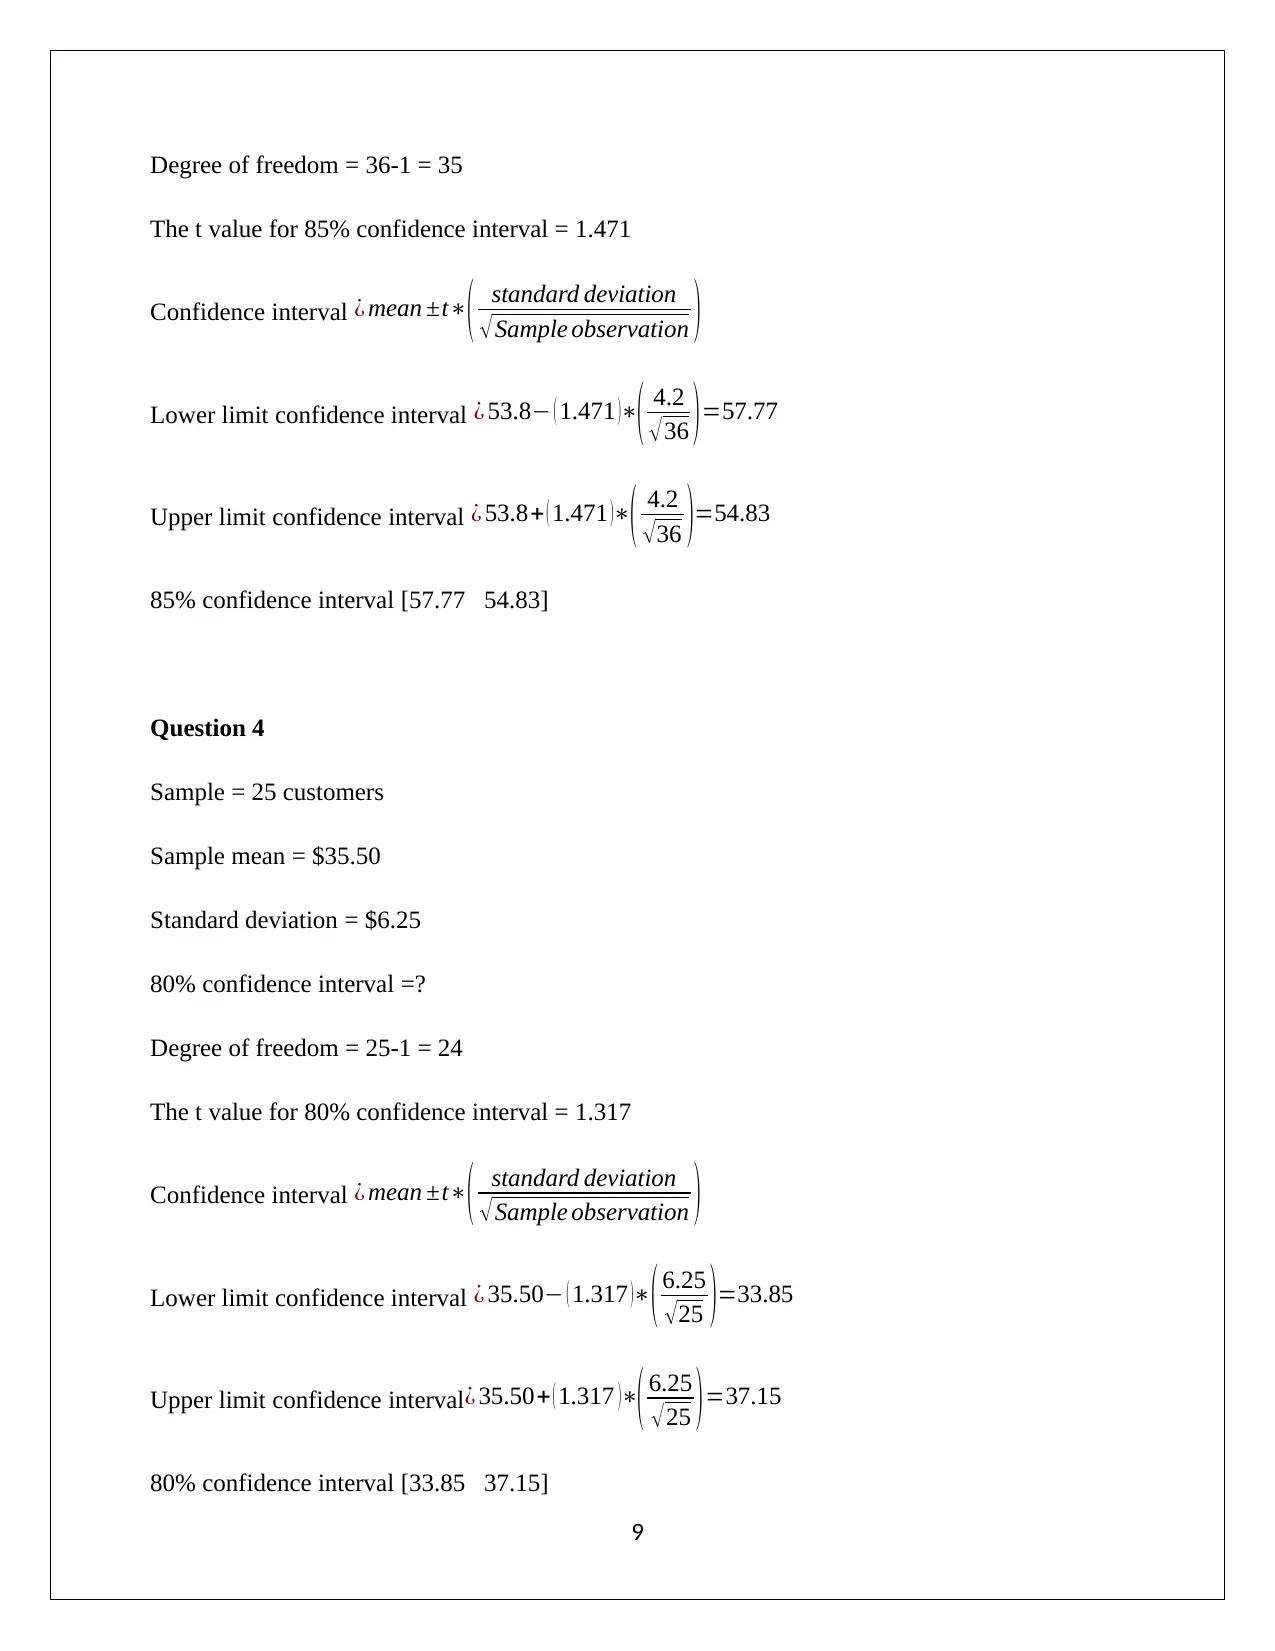
Degree of freedom = 36-1 = 35
The t value for 85% confidence interval = 1.471
Confidence interval ¿ mean ±t∗( standard deviation
√Sample observation )
Lower limit confidence interval ¿ 53.8− ( 1.471 )∗
( 4.2
√36 )=57.77
Upper limit confidence interval ¿ 53.8+ ( 1.471 )∗
( 4.2
√ 36 )=54.83
85% confidence interval [57.77 54.83]
Question 4
Sample = 25 customers
Sample mean = $35.50
Standard deviation = $6.25
80% confidence interval =?
Degree of freedom = 25-1 = 24
The t value for 80% confidence interval = 1.317
Confidence interval ¿ mean ±t∗
( standard deviation
√Sample observation )
Lower limit confidence interval ¿ 35.50− ( 1.317 )∗( 6.25
√25 )=33.85
Upper limit confidence interval¿ 35.50+ ( 1.317 )∗
( 6.25
√25 )=37.15
80% confidence interval [33.85 37.15]
9
Paraphrase This Document
Need a fresh take? Get an instant paraphrase of this document with our AI Paraphraser

10
1 out of 11
Related Documents


Your All-in-One AI-Powered Toolkit for Academic Success.
+13062052269
info@desklib.com
Available 24*7 on WhatsApp / Email
![[object Object]](/_next/static/media/star-bottom.7253800d.svg)
Unlock your academic potential
© 2024 | Zucol Services PVT LTD | All rights reserved.