Statistics Assignment: Probability, Distributions, and Data Analysis

Verified

Added on  2023/06/03

|6
|595
|345
Homework Assignment
AI Summary
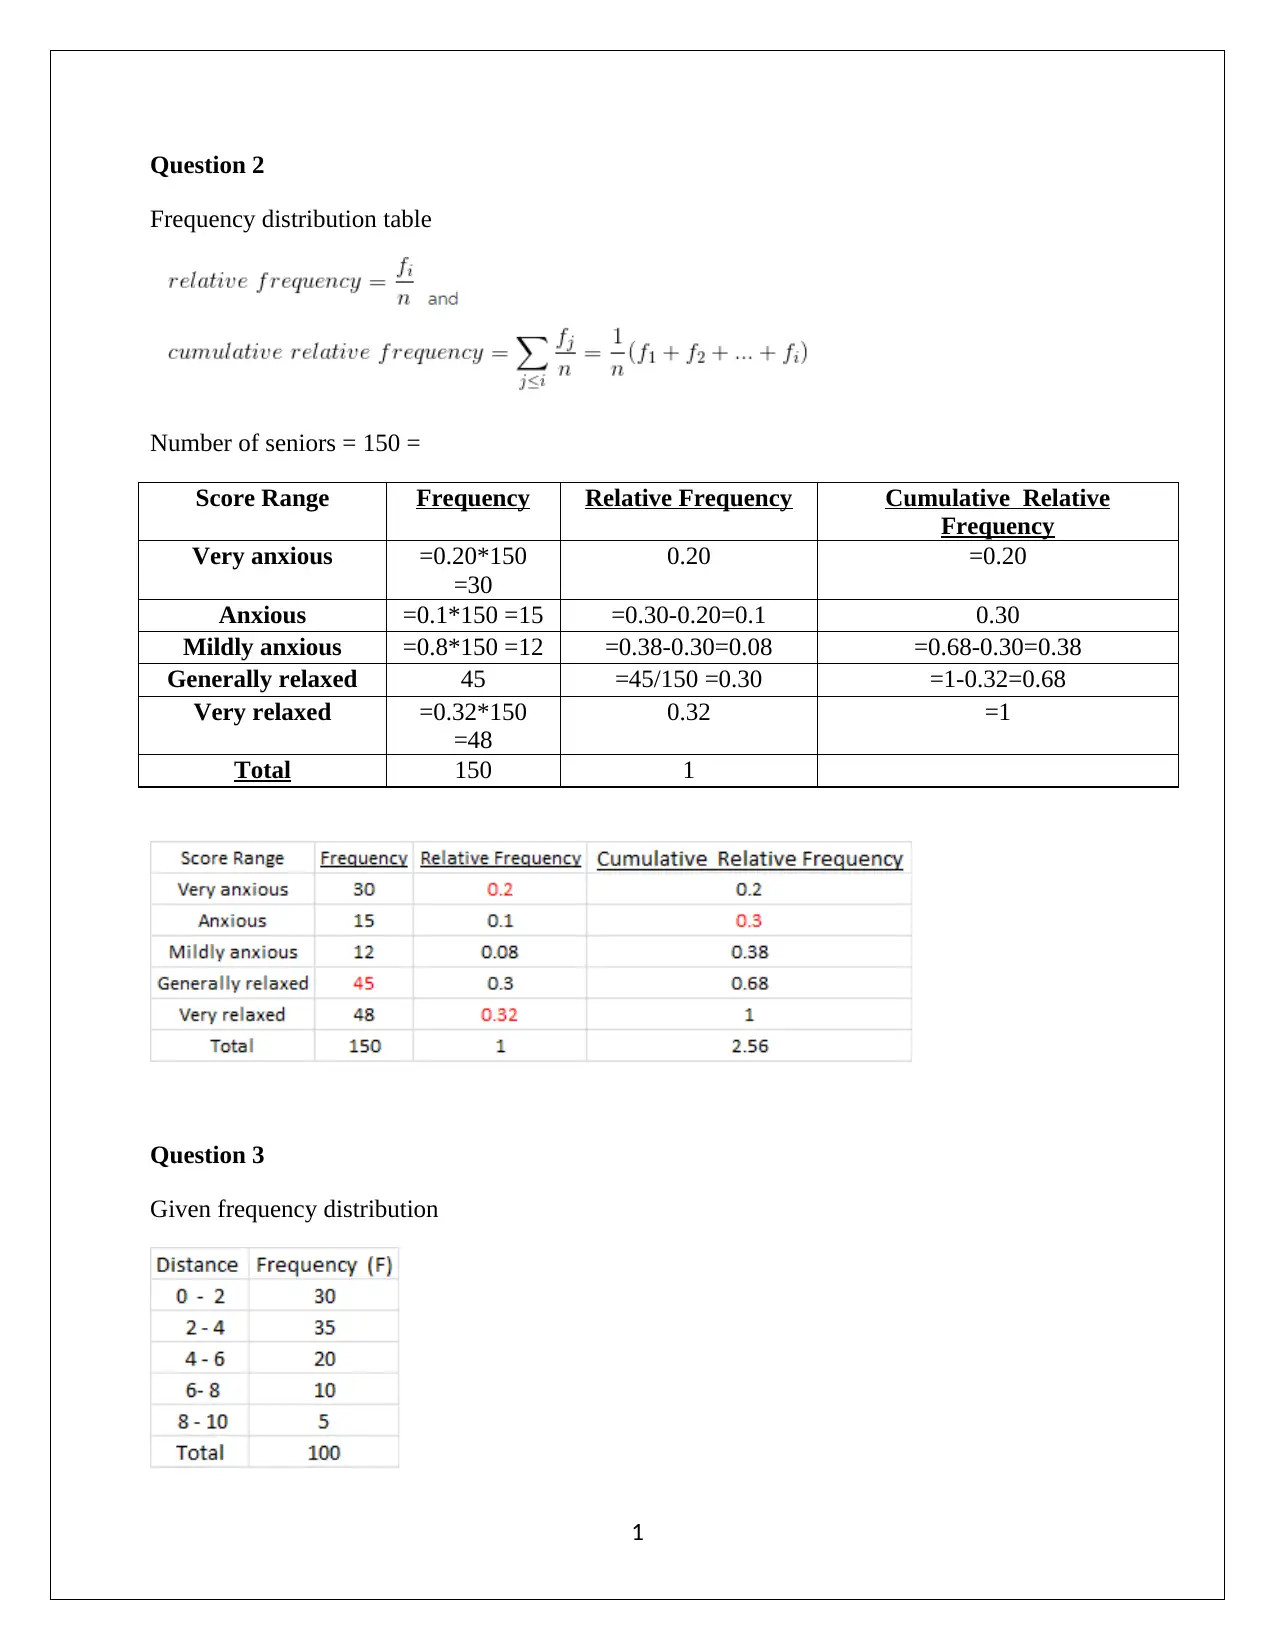
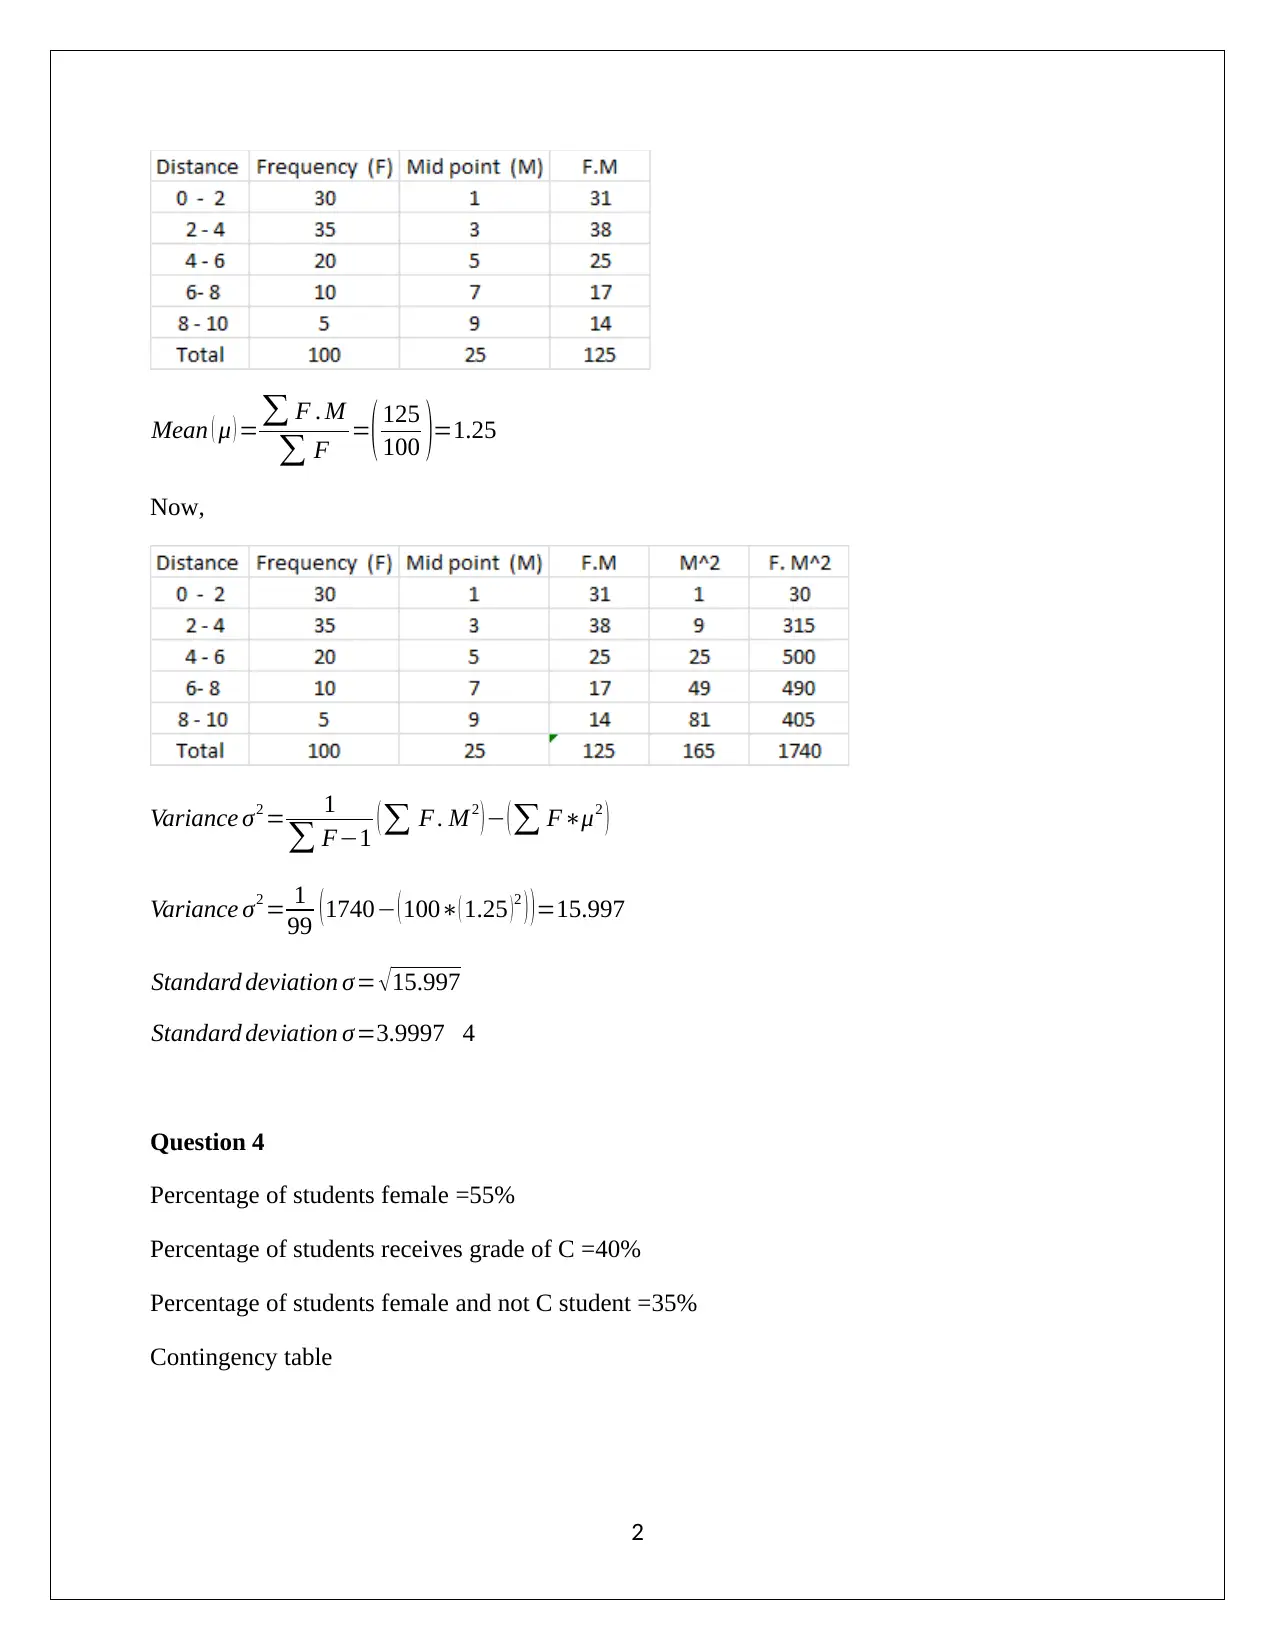
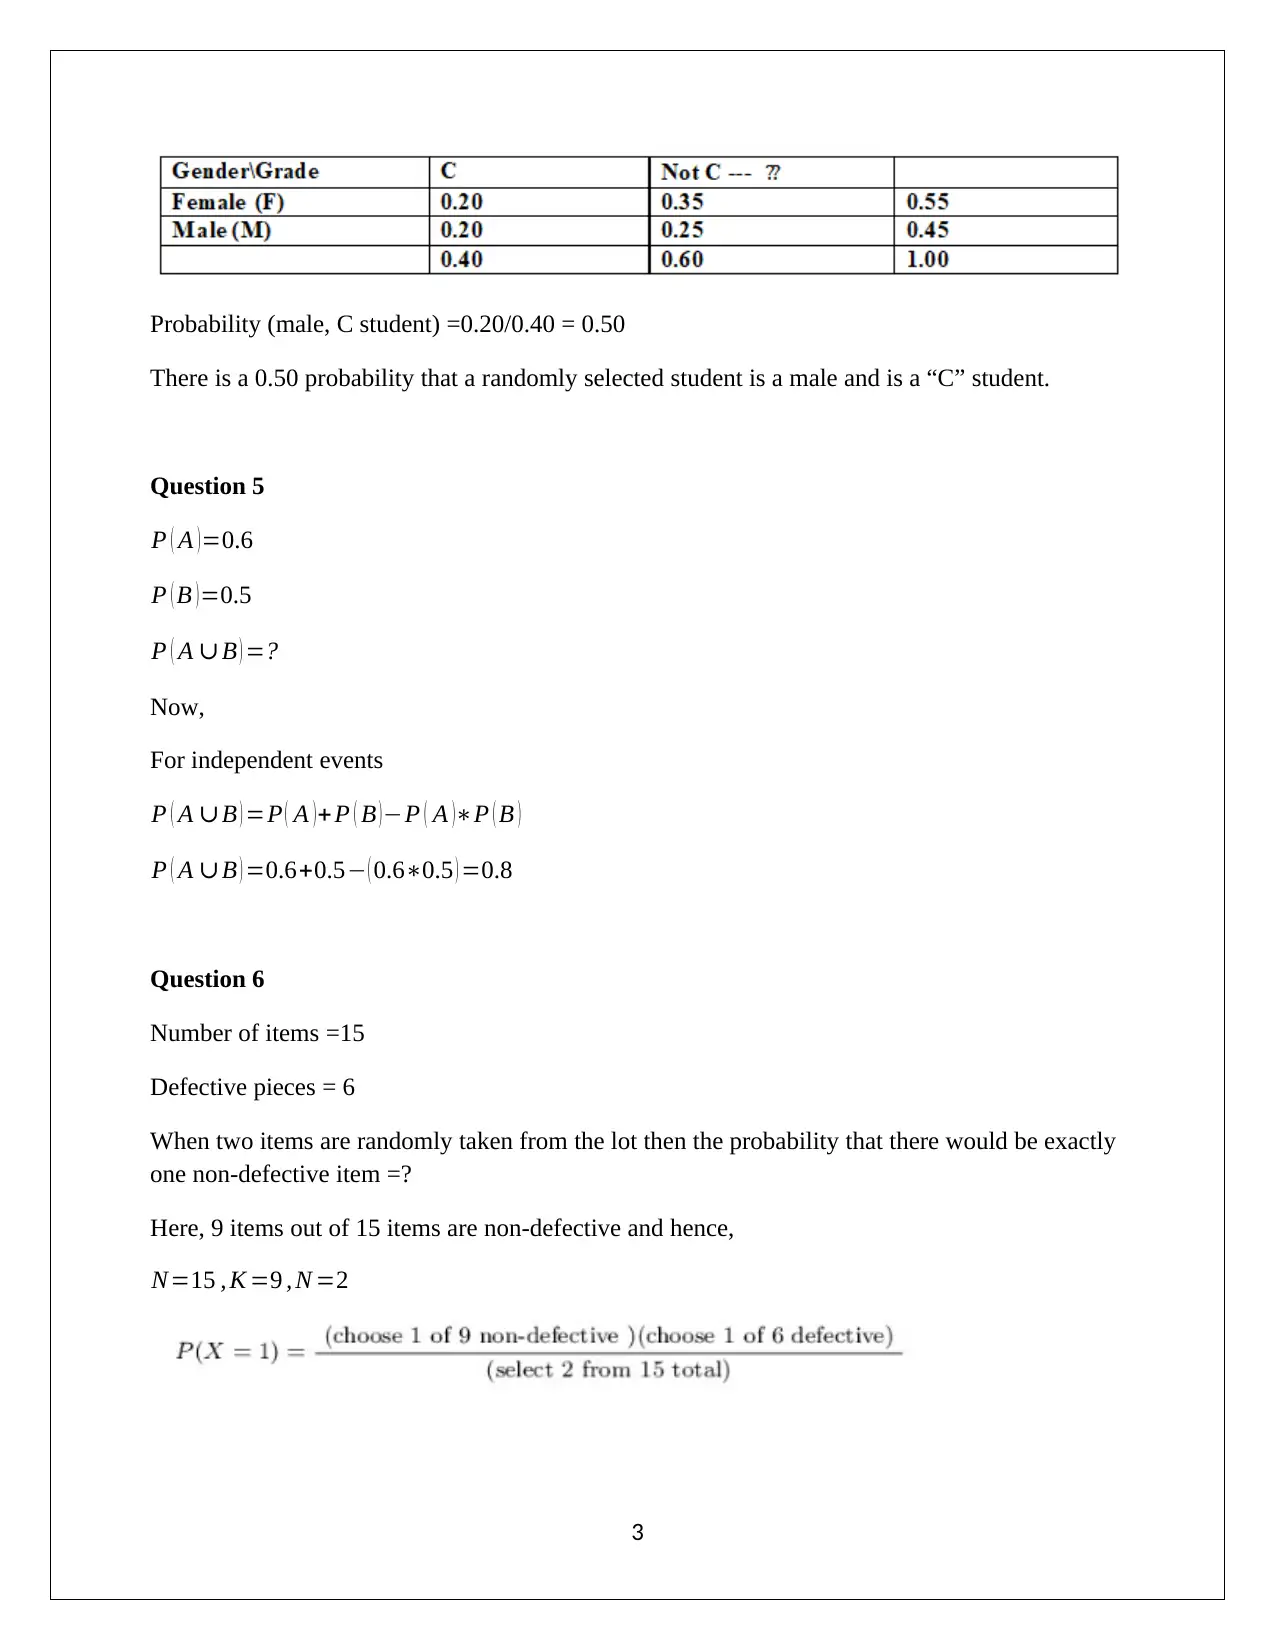
This statistics assignment solution covers a range of statistical concepts. It begins with a frequency distribution table, calculating missing values and cumulative relative frequency. The solution then calculates the sample variance and standard deviation from a given frequency table, using group midpoints. Further, the assignment includes probability calculations based on a contingency table, determining conditional probabilities. The solution also addresses probability for independent events and calculating probabilities for defective items using the binomial distribution. Finally, the solution includes the application of the normal distribution to approximate binomial probabilities, calculating probabilities within specified ranges. This solution provides a comprehensive overview of the concepts and their application.
Document Page
STATISTICS
STUDENT NAME/ID
[Pick the date]
tabler-icon-diamond-filled.svg

Paraphrase This Document

Need a fresh take? Get an instant paraphrase of this document with our AI Paraphraser
Document Page
Question 2
Frequency distribution table
Number of seniors = 150 =
Score Range Frequency Relative Frequency Cumulative Relative
Frequency
Very anxious =0.20*150
=30
0.20 =0.20
Anxious =0.1*150 =15 =0.30-0.20=0.1 0.30
Mildly anxious =0.8*150 =12 =0.38-0.30=0.08 =0.68-0.30=0.38
Generally relaxed 45 =45/150 =0.30 =1-0.32=0.68
Very relaxed =0.32*150
=48
0.32 =1
Total 150 1
Question 3
Given frequency distribution
1
Document Page
Mean ( μ ) = F . M
F =( 125
100 )=1.25
Now,
Variance σ2 = 1
F1 ( F . M2 ) ( Fμ2 )
Variance σ2 = 1
99 ( 1740 ( 100( 1.25 ) 2 ) ) =15.997
Standard deviation σ= 15.997
Standard deviation σ=3.9997 4
Question 4
Percentage of students female =55%
Percentage of students receives grade of C =40%
Percentage of students female and not C student =35%
Contingency table
2
Document Page
Probability (male, C student) =0.20/0.40 = 0.50
There is a 0.50 probability that a randomly selected student is a male and is a “C” student.
Question 5
P ( A )=0.6
P ( B ) =0.5
P ( A B ) =?
Now,
For independent events
P ( A B ) =P ( A ) + P ( B ) P ( A )P ( B )
P ( A B ) =0.6+0.5 ( 0.60.5 ) =0.8
Question 6
Number of items =15
Defective pieces = 6
When two items are randomly taken from the lot then the probability that there would be exactly
one non-defective item =?
Here, 9 items out of 15 items are non-defective and hence,
N=15 , K =9 , N =2
3
tabler-icon-diamond-filled.svg

Paraphrase This Document

Need a fresh take? Get an instant paraphrase of this document with our AI Paraphraser
Document Page
P ( X=1 )=
9
1
6
1
15
2
= 96
105 =18
35 =0.5413
Therefore,
Requisite probability =0.5413
Question 7
Probability of a defective calculator = 20%
Sample size = 15
Probability that less than 5 of calculator will be defective =?
Binomial distribution
P( x <5)=P( X 4 )=0.8358(Standard binomial table)
Question 8
Likelihood of troubles = 0.75
Trouble reported = 5
Probability that at least 3 troubles would be repaired on same day =?
Binomial distribution
P( x 3)=1P( x 2)=10.103516=0.8965(Standard binomialtable)
Question 9
Mean μ = 60 feet
Standard deviation σ =4 feet
Probability that length of athlete throws the hammer would fall between 56 feet and 65 feet =?
P(56<X<65)
4
Document Page
P ( 56< X <65 )=P ( 5660< Xμ< 6560 )
P ( 56< X <65 )=P ( 5660
4 < X μ
σ < 6560
4 )
P ( 56< X <65 )=P (1<Z <1.25 ) =0.7357(Standard normal table)
Probability that length of athlete throws the hammer would fall between 56 feet and 65 feet is
0.7357.
Question 10
Binomial distribution
n=100
p=0.2
Probability that x is less than or equal to 15 using normal approximation to binomial distribution.
Without continuity corrections
Mean=np=1000.2=20
Standard deviation ¿ 1000.20.8=¿4
Now,
The z value= 1520
4 =1.25
P ( x15 ) =P ( z 1.25 ) =0.1056 (Normal distribution table)
5
chevron_up_icon
1 out of 6
circle_padding
hide_on_mobile
zoom_out_icon
[object Object]