Statistics Assignment: Hypothesis Testing, Distributions, and Analysis
VerifiedAdded on 2023/05/28
|13
|1282
|227
Homework Assignment
AI Summary
This document presents a detailed solution to a statistics assignment, addressing key concepts such as null and alternative hypotheses, Type I and Type II errors, z-scores, and the Central Limit Theorem. The assignment includes calculations for percentiles, probabilities, and hypothesis testing using ...
STATISTICS
STUDENT ID:
[Pick the date]
STUDENT ID:
[Pick the date]
Paraphrase This Document
Need a fresh take? Get an instant paraphrase of this document with our AI Paraphraser
Question 1
The null hypothesis refers to the hypothesis that tends to support the non-existence of any
significance in the underlying observations. Hence, it tends to highlight that observations are
derived owing to chance and thereby do not signify any deviation from the hypothesised
population mean. This is indicated by H0 and assumed to be true in case of any hypothesis
testing unless proved false through existence of sufficient evidence based on the given
significance level.
Question 2
The alternative hypothesis tends to represent the hypothesis that the underlying deviation or
relationship is of significance. In research, usually the claim that is to be tested is usually
represented by the alternative hypothesis. If this is proved to be true, then it implies that the
observations are not by chance but infact tend to highlight a significant deviation from the
null hypothesis. Only when the null hypothesis is rejected can this be assumed to be true.
Question 3
Type 1 error refers to the rejection of a true null hypothesis. The probability of this error is
represented using the significance level or α. Also, lower the value of α, higher would be the
confidence level which is captured by 1 –α. Hence, if the probability of Type 1 error is lesser,
it would imply higher confidence with regards to the rejection of null hypothesis and
significance of observations.
Question 4
Type II error refers to the situation when a false null hypothesis is not rejected. The
probability of Type II error is indicated by 1 –β where β captures the test power. In order to
reduce Type II error, the sample size or n needs to be increased which would reduce the
standard error.
Question 5
a) The requisite screenshot for computation of 85 percentile is indicated below.
The null hypothesis refers to the hypothesis that tends to support the non-existence of any
significance in the underlying observations. Hence, it tends to highlight that observations are
derived owing to chance and thereby do not signify any deviation from the hypothesised
population mean. This is indicated by H0 and assumed to be true in case of any hypothesis
testing unless proved false through existence of sufficient evidence based on the given
significance level.
Question 2
The alternative hypothesis tends to represent the hypothesis that the underlying deviation or
relationship is of significance. In research, usually the claim that is to be tested is usually
represented by the alternative hypothesis. If this is proved to be true, then it implies that the
observations are not by chance but infact tend to highlight a significant deviation from the
null hypothesis. Only when the null hypothesis is rejected can this be assumed to be true.
Question 3
Type 1 error refers to the rejection of a true null hypothesis. The probability of this error is
represented using the significance level or α. Also, lower the value of α, higher would be the
confidence level which is captured by 1 –α. Hence, if the probability of Type 1 error is lesser,
it would imply higher confidence with regards to the rejection of null hypothesis and
significance of observations.
Question 4
Type II error refers to the situation when a false null hypothesis is not rejected. The
probability of Type II error is indicated by 1 –β where β captures the test power. In order to
reduce Type II error, the sample size or n needs to be increased which would reduce the
standard error.
Question 5
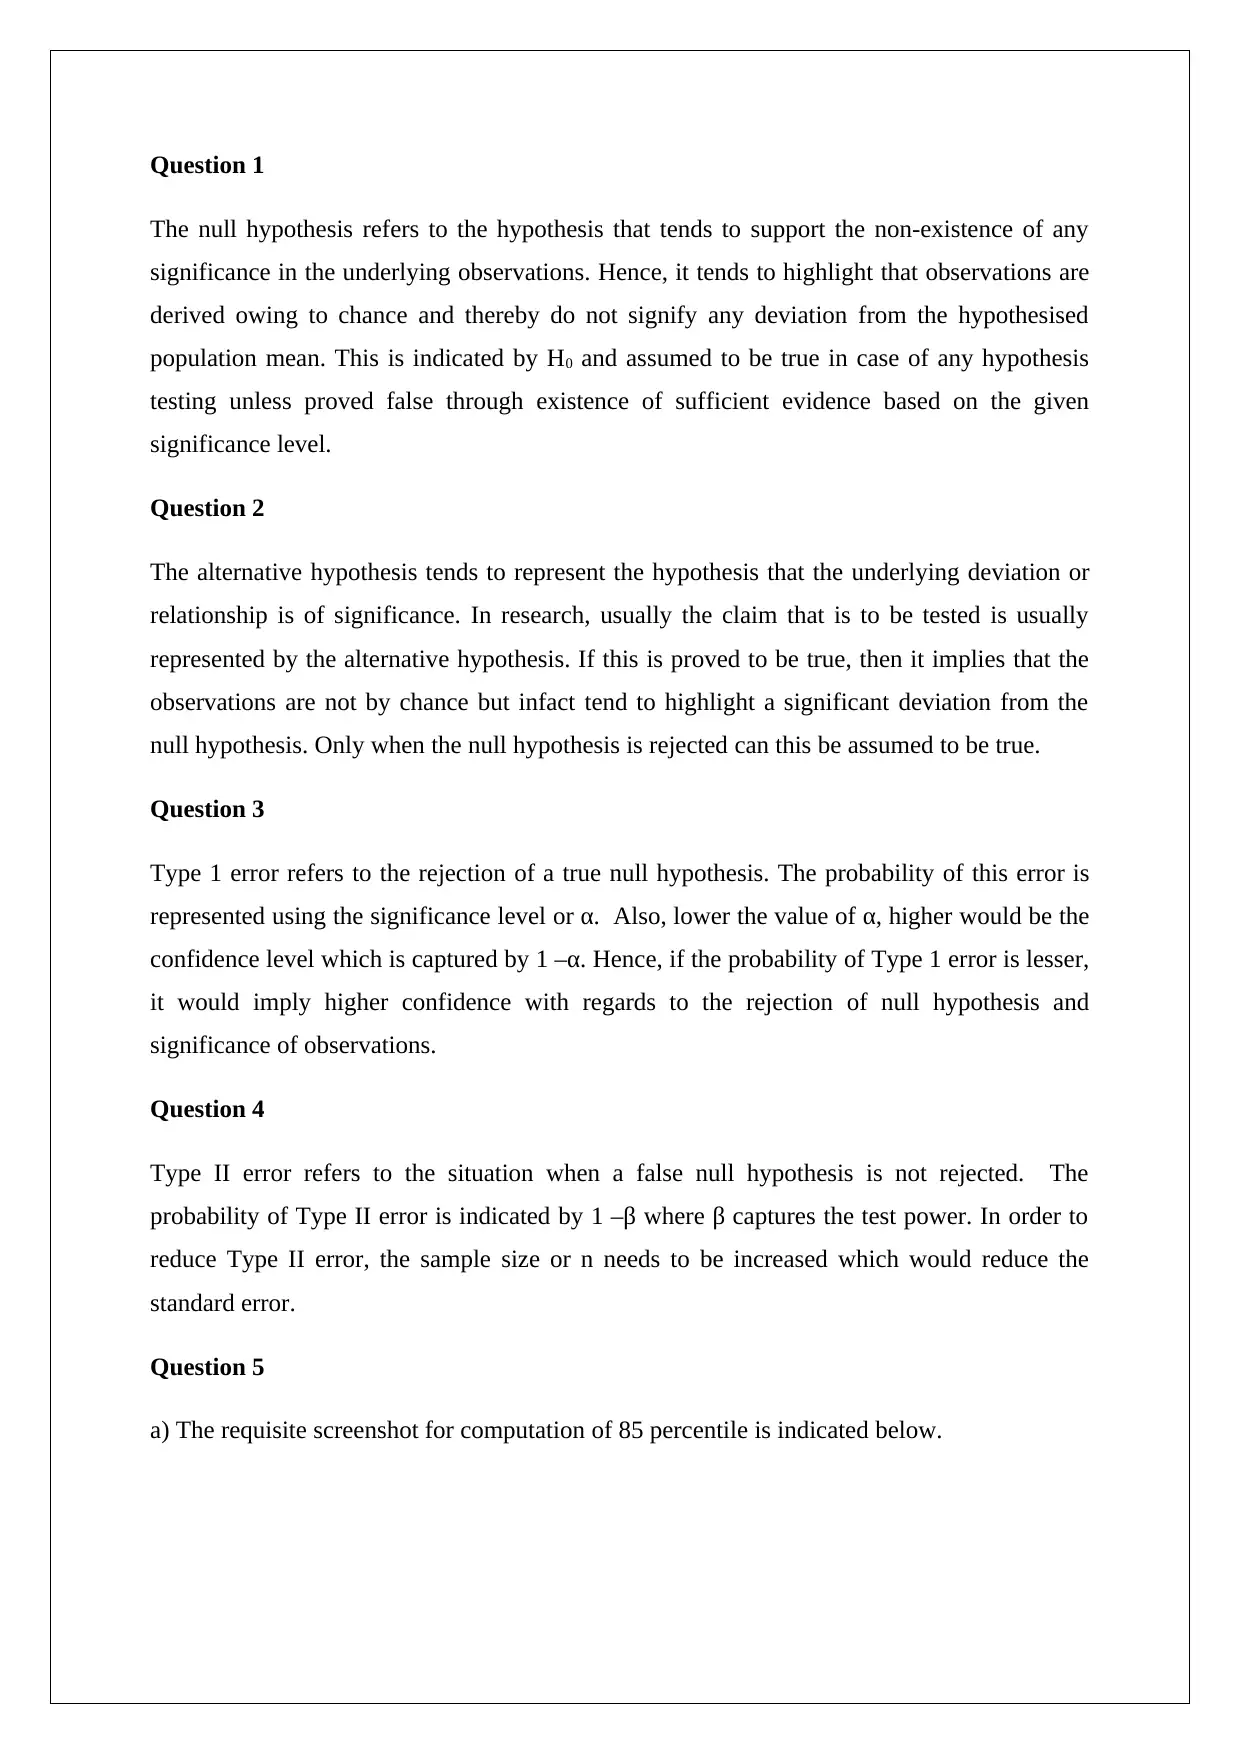
a) The requisite screenshot for computation of 85 percentile is indicated below.
From the above output, 85 percentile lies at 170,728.63 miles.
b) The z score for the above mileage is computed below.
Z score = (170728.63-150000)/20000 = 1.0364
c) The relevant screenshot is shown below.
b) The z score for the above mileage is computed below.
Z score = (170728.63-150000)/20000 = 1.0364
c) The relevant screenshot is shown below.
⊘ This is a preview!⊘
Do you want full access?
Subscribe today to unlock all pages.
Trusted by 1+ million students worldwide
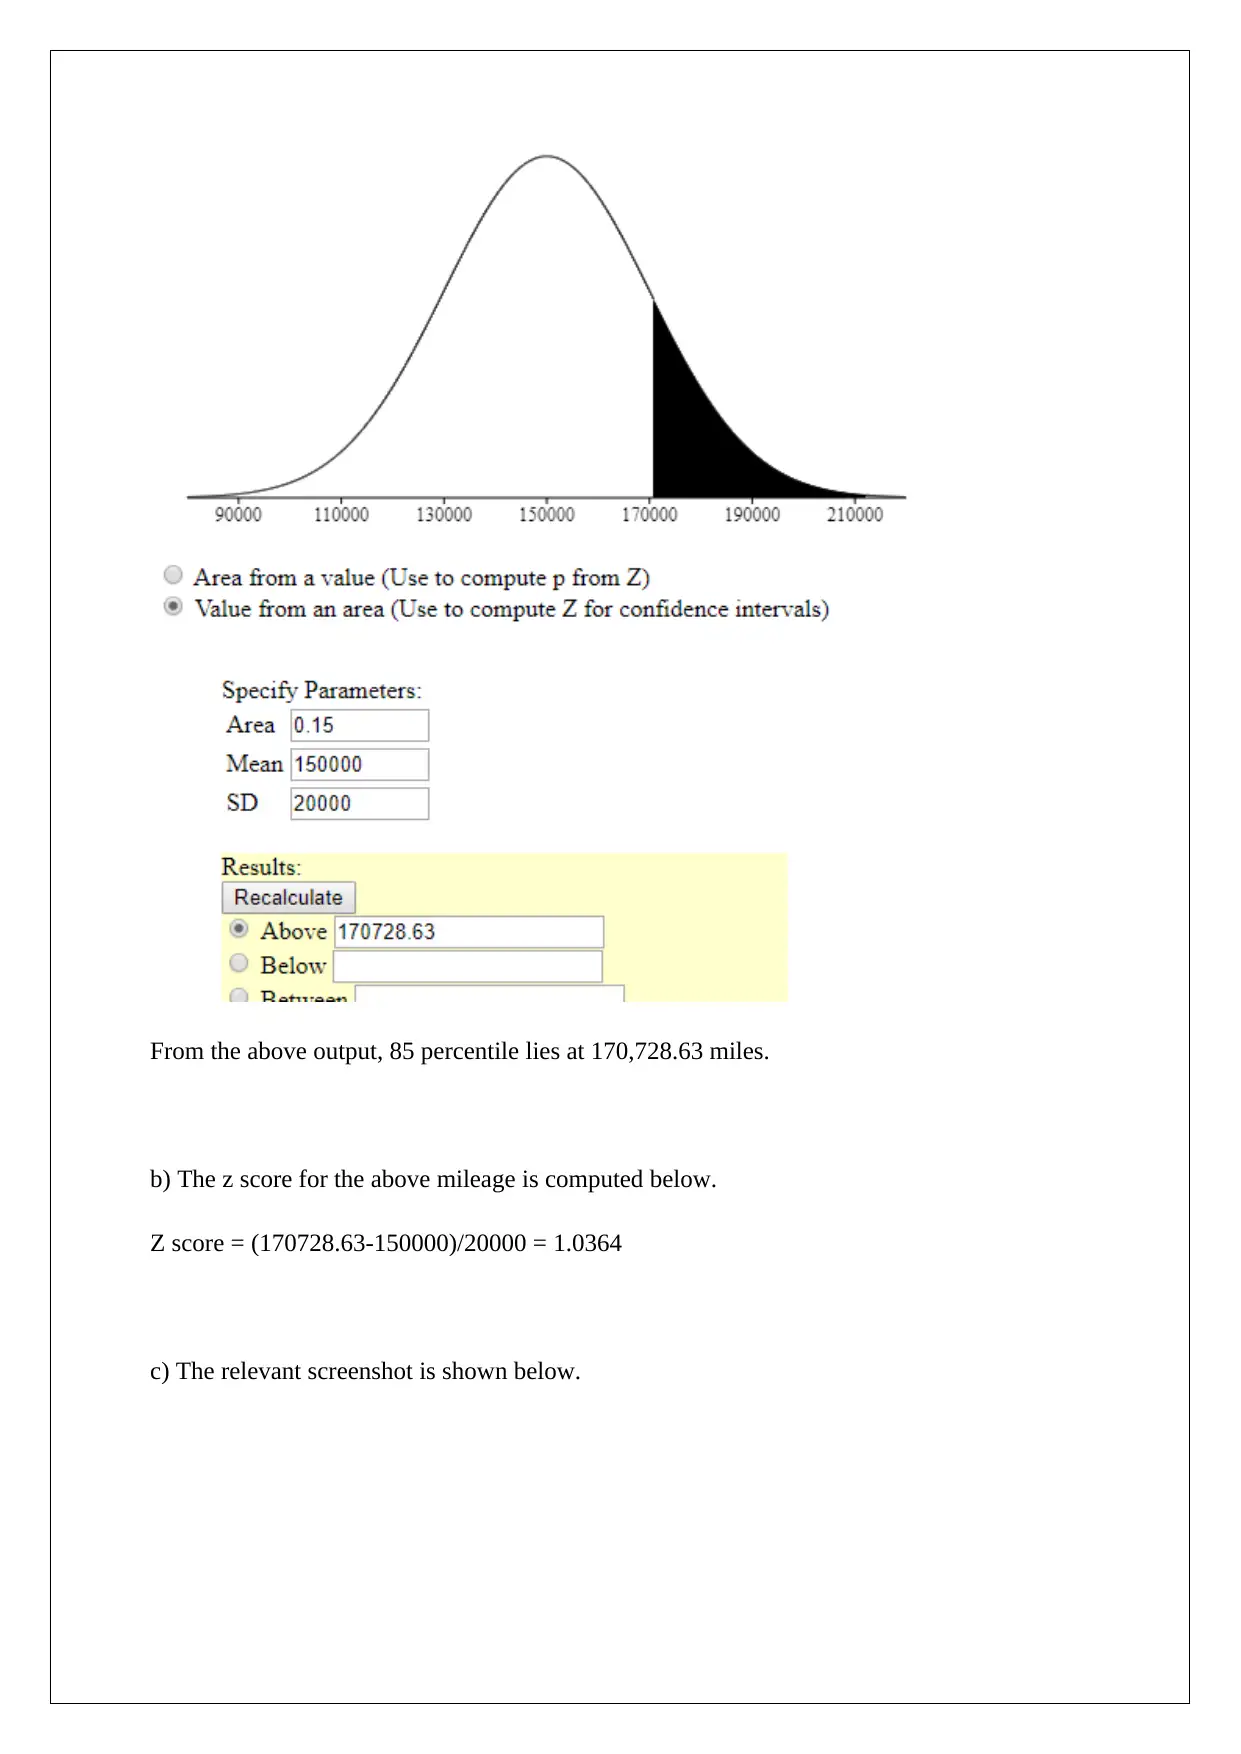
From the above, it is apparent that the requisite probability is 0.1524.
d) As per Central Limit Theorem, σxbar = σ/√n
Hence, sample standard deviation = 20000/√25 = 4000 miles
e) The requisite screenshot is shown below.
d) As per Central Limit Theorem, σxbar = σ/√n
Hence, sample standard deviation = 20000/√25 = 4000 miles
e) The requisite screenshot is shown below.
Paraphrase This Document
Need a fresh take? Get an instant paraphrase of this document with our AI Paraphraser
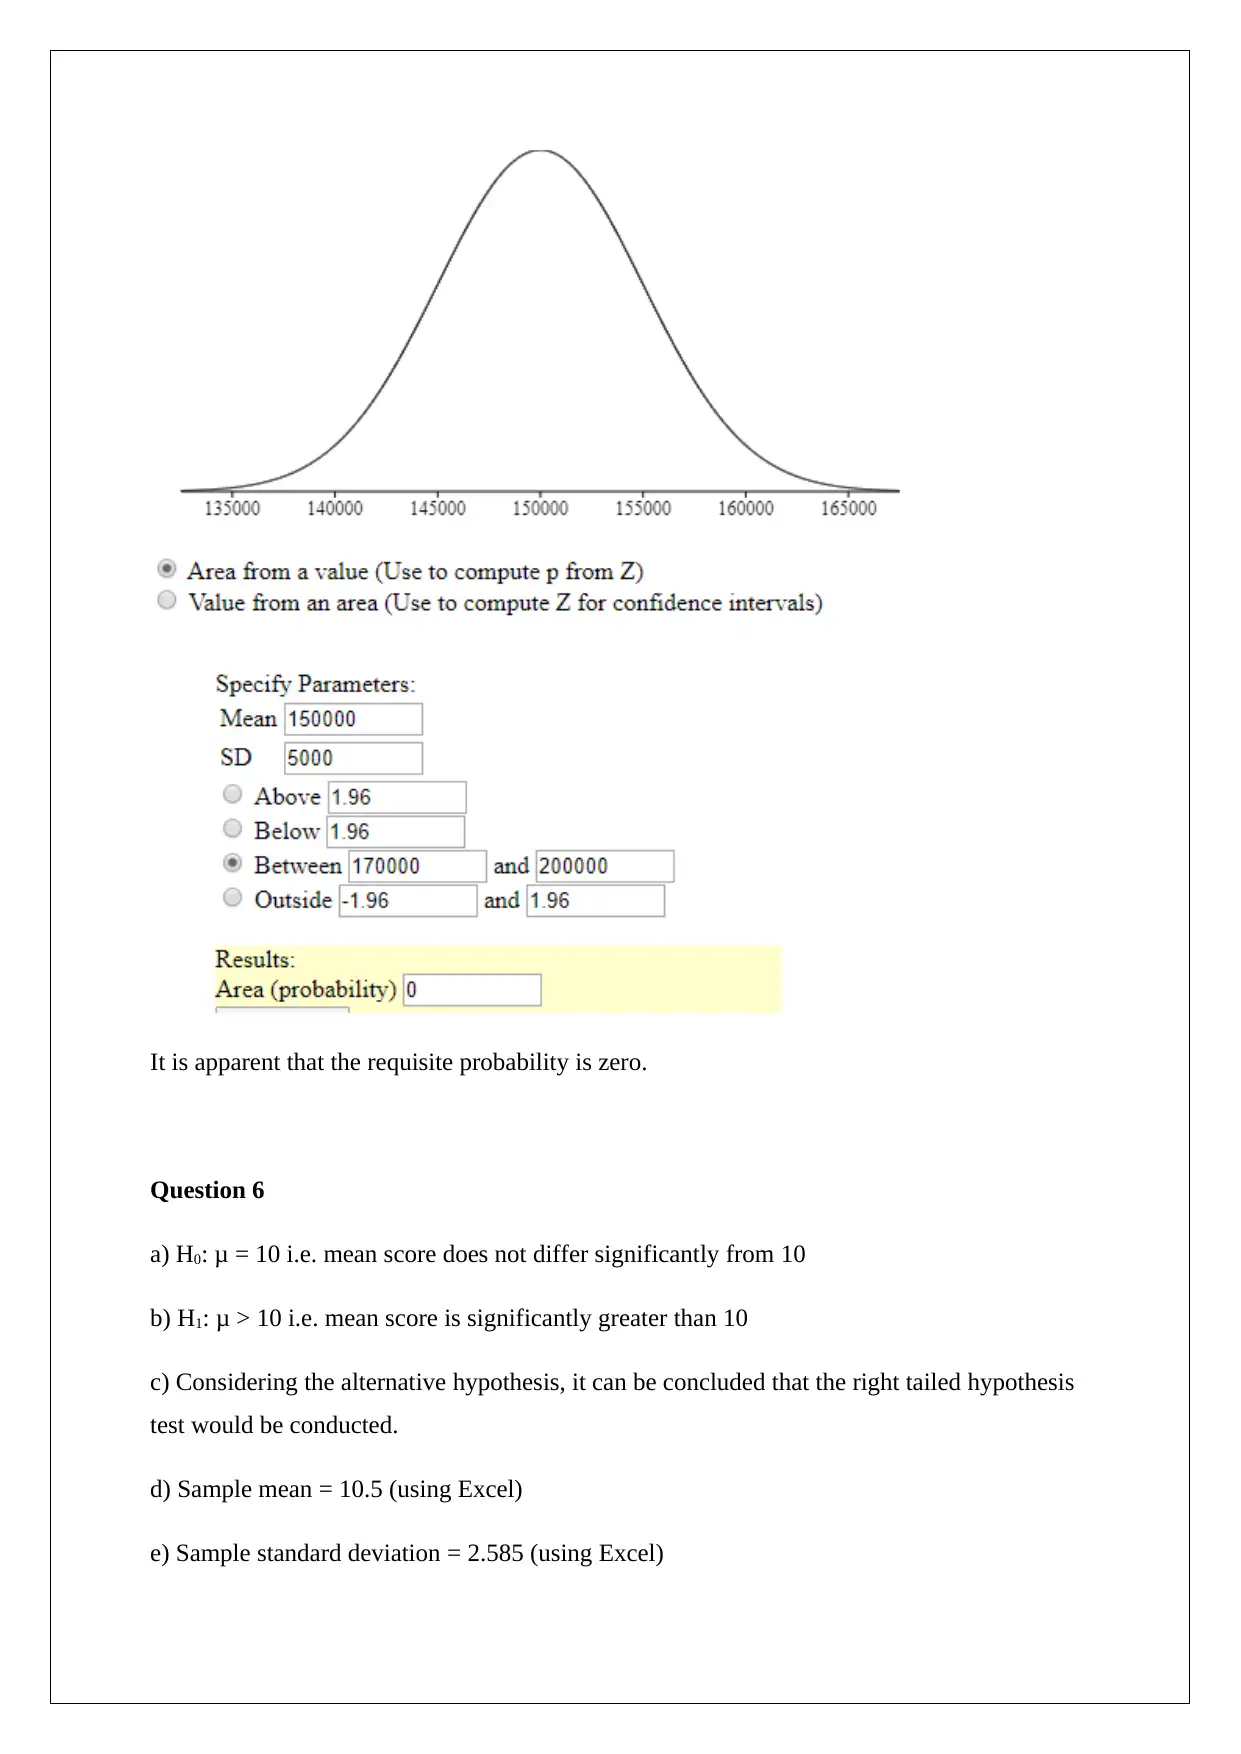
It is apparent that the requisite probability is zero.
Question 6
a) H0: μ = 10 i.e. mean score does not differ significantly from 10
b) H1: μ > 10 i.e. mean score is significantly greater than 10
c) Considering the alternative hypothesis, it can be concluded that the right tailed hypothesis
test would be conducted.
d) Sample mean = 10.5 (using Excel)
e) Sample standard deviation = 2.585 (using Excel)
f) Size of the sample is 20.
g) T statistic would be used instead of z statistic as the population standard deviation is
unknown in this case.
h) T statistic = (10.5-10)/(2.585/200.5) = 0.865
i) Degree of freedom = n -1 = 20-1 = 19
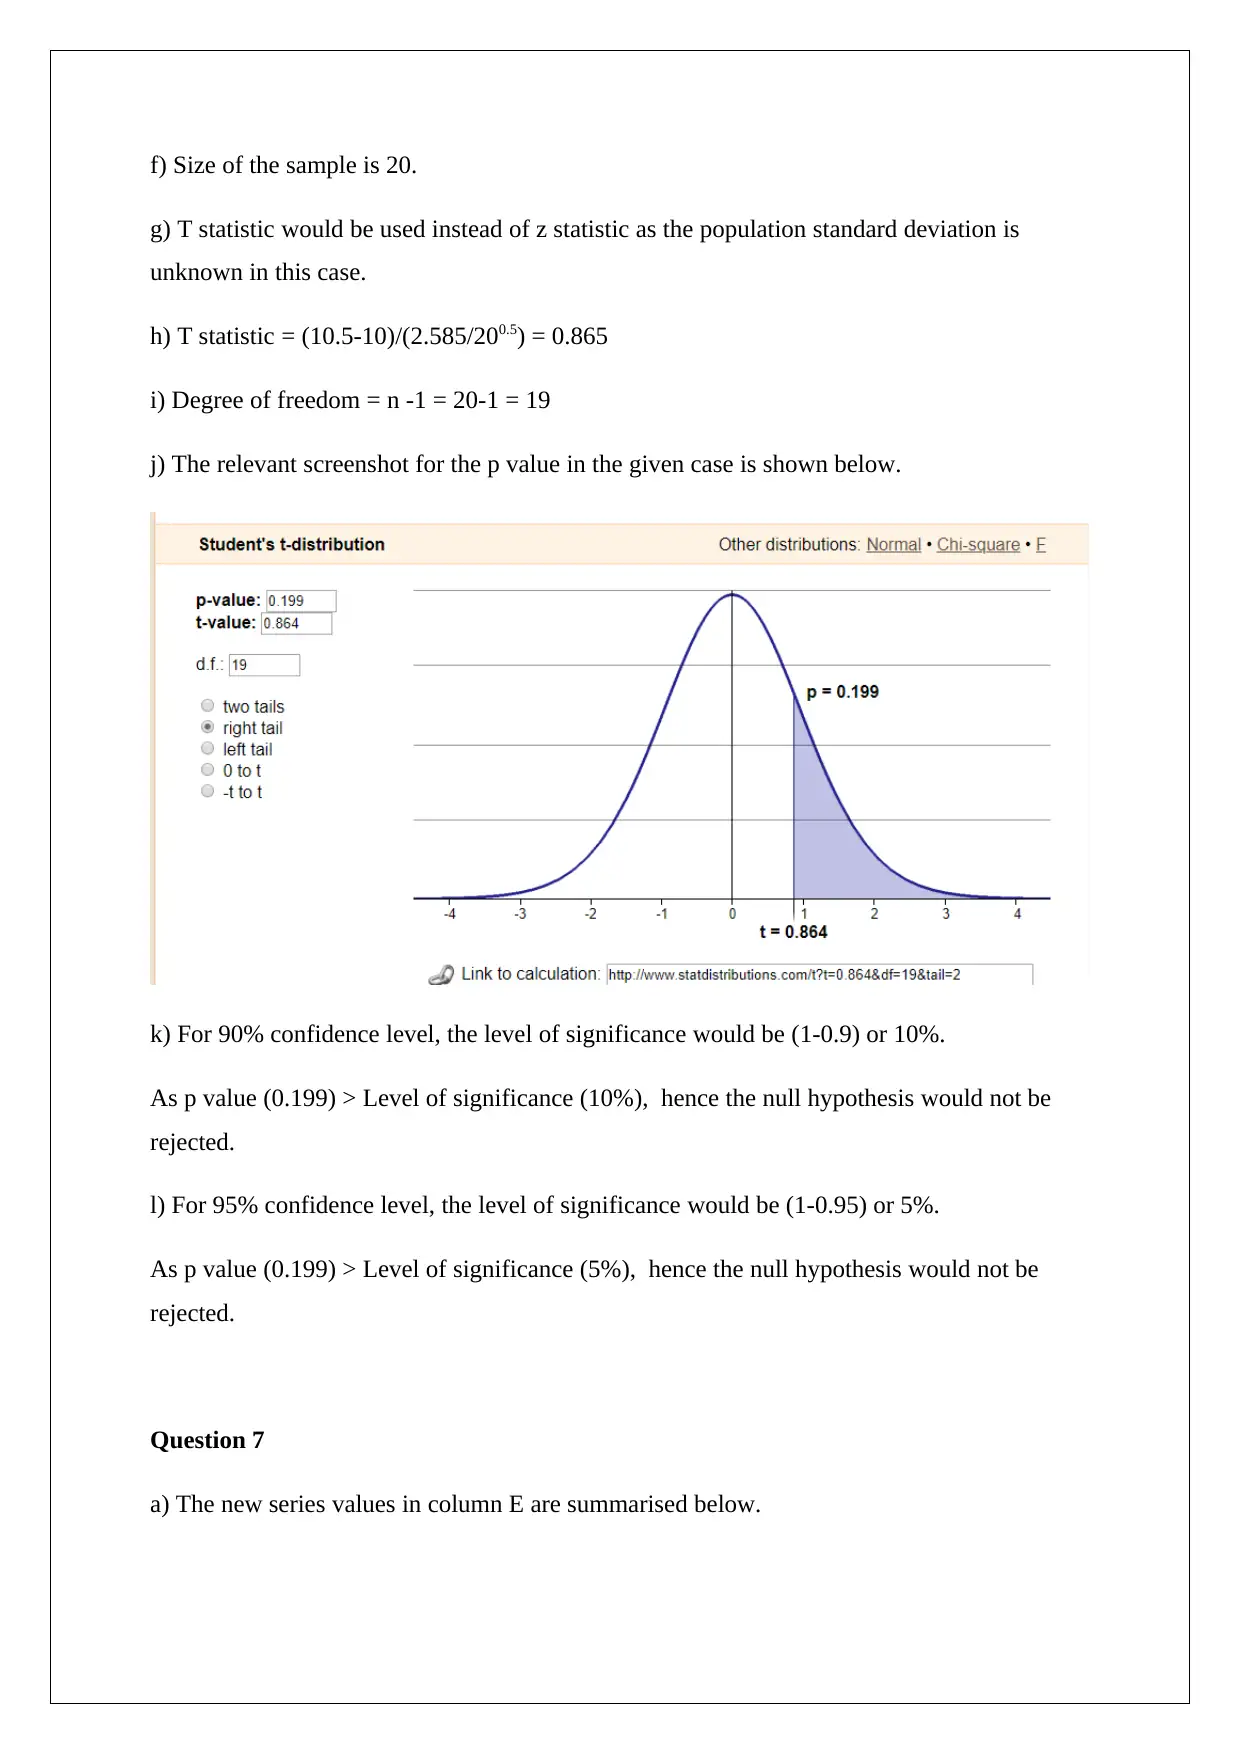
j) The relevant screenshot for the p value in the given case is shown below.
k) For 90% confidence level, the level of significance would be (1-0.9) or 10%.
As p value (0.199) > Level of significance (10%), hence the null hypothesis would not be
rejected.
l) For 95% confidence level, the level of significance would be (1-0.95) or 5%.
As p value (0.199) > Level of significance (5%), hence the null hypothesis would not be
rejected.
Question 7
a) The new series values in column E are summarised below.
g) T statistic would be used instead of z statistic as the population standard deviation is
unknown in this case.
h) T statistic = (10.5-10)/(2.585/200.5) = 0.865
i) Degree of freedom = n -1 = 20-1 = 19
j) The relevant screenshot for the p value in the given case is shown below.
k) For 90% confidence level, the level of significance would be (1-0.9) or 10%.
As p value (0.199) > Level of significance (10%), hence the null hypothesis would not be
rejected.
l) For 95% confidence level, the level of significance would be (1-0.95) or 5%.
As p value (0.199) > Level of significance (5%), hence the null hypothesis would not be
rejected.
Question 7
a) The new series values in column E are summarised below.
⊘ This is a preview!⊘
Do you want full access?
Subscribe today to unlock all pages.
Trusted by 1+ million students worldwide
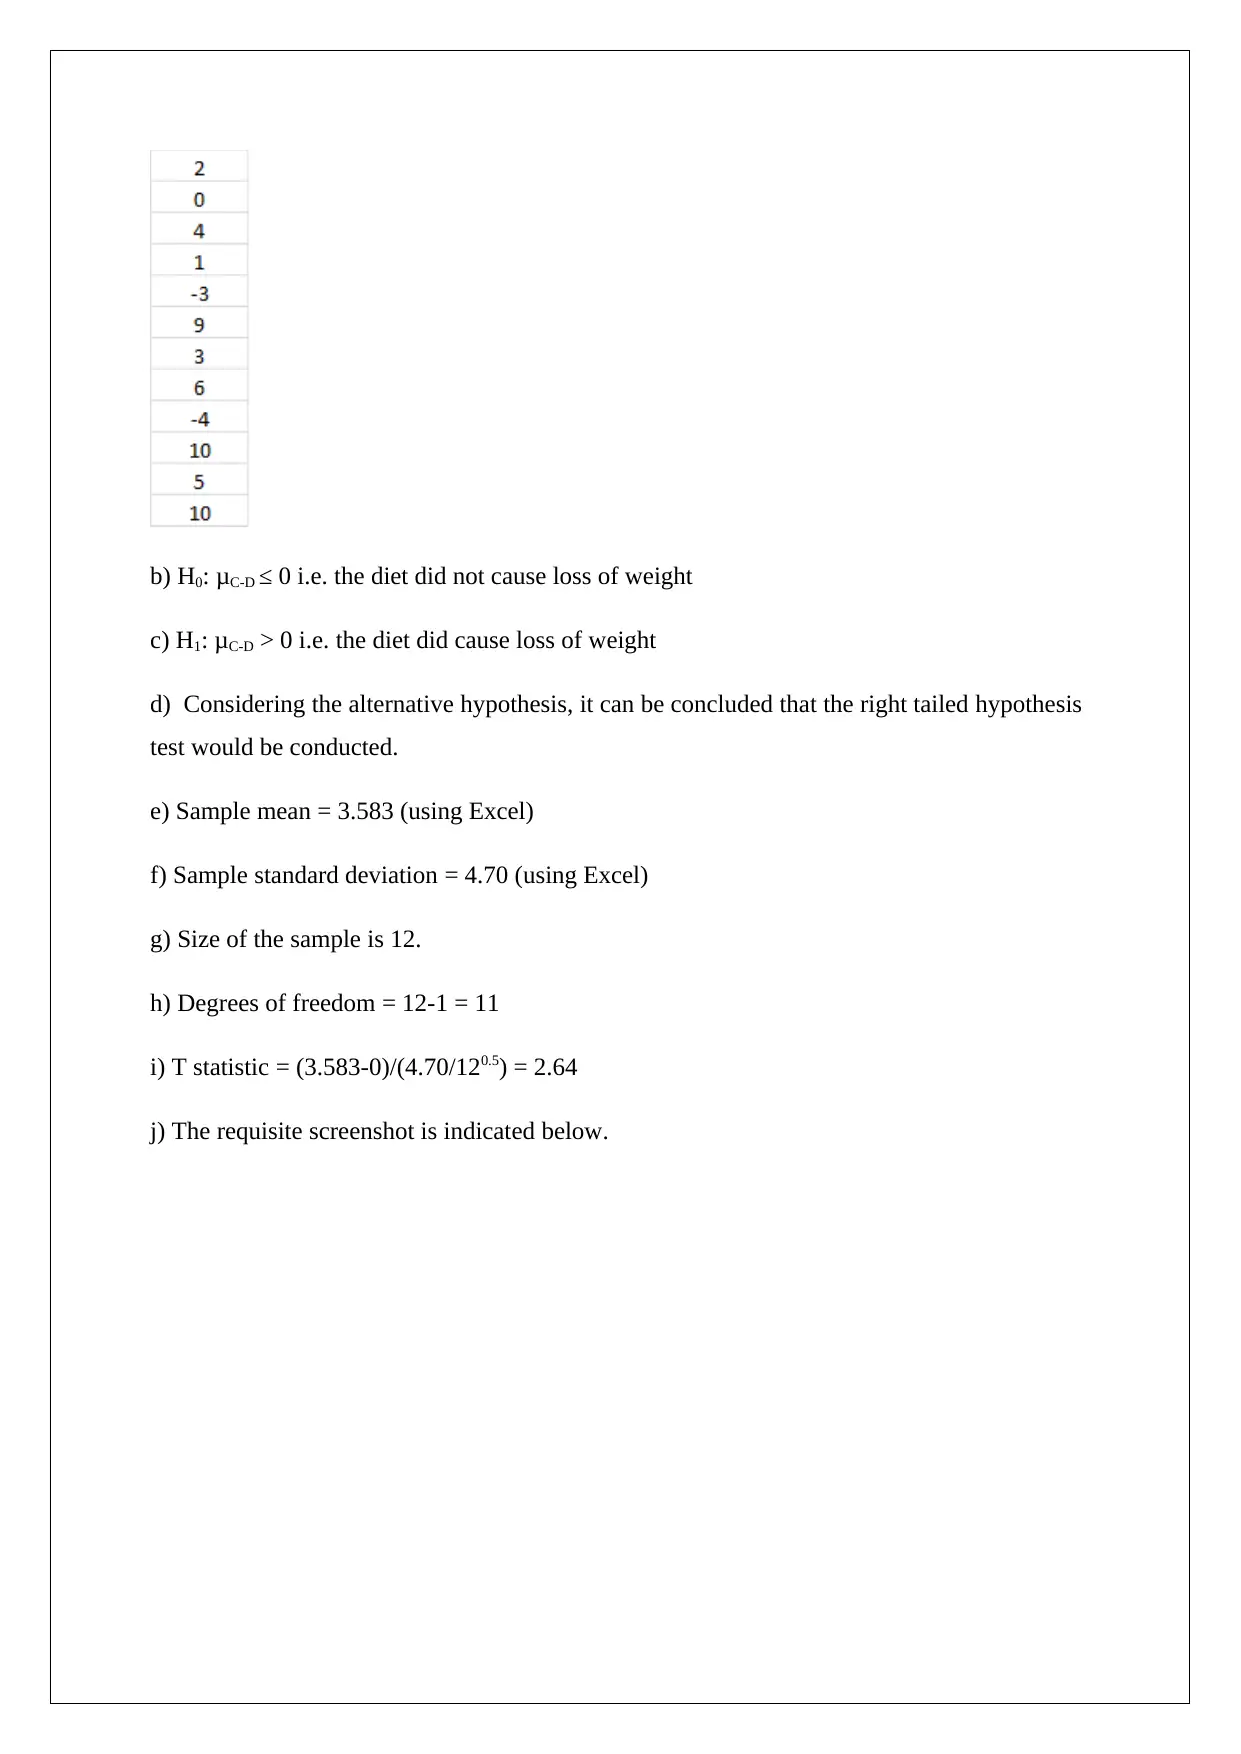
b) H0: μC-D ≤ 0 i.e. the diet did not cause loss of weight
c) H1: μC-D > 0 i.e. the diet did cause loss of weight
d) Considering the alternative hypothesis, it can be concluded that the right tailed hypothesis
test would be conducted.
e) Sample mean = 3.583 (using Excel)
f) Sample standard deviation = 4.70 (using Excel)
g) Size of the sample is 12.
h) Degrees of freedom = 12-1 = 11
i) T statistic = (3.583-0)/(4.70/120.5) = 2.64
j) The requisite screenshot is indicated below.
Paraphrase This Document
Need a fresh take? Get an instant paraphrase of this document with our AI Paraphraser
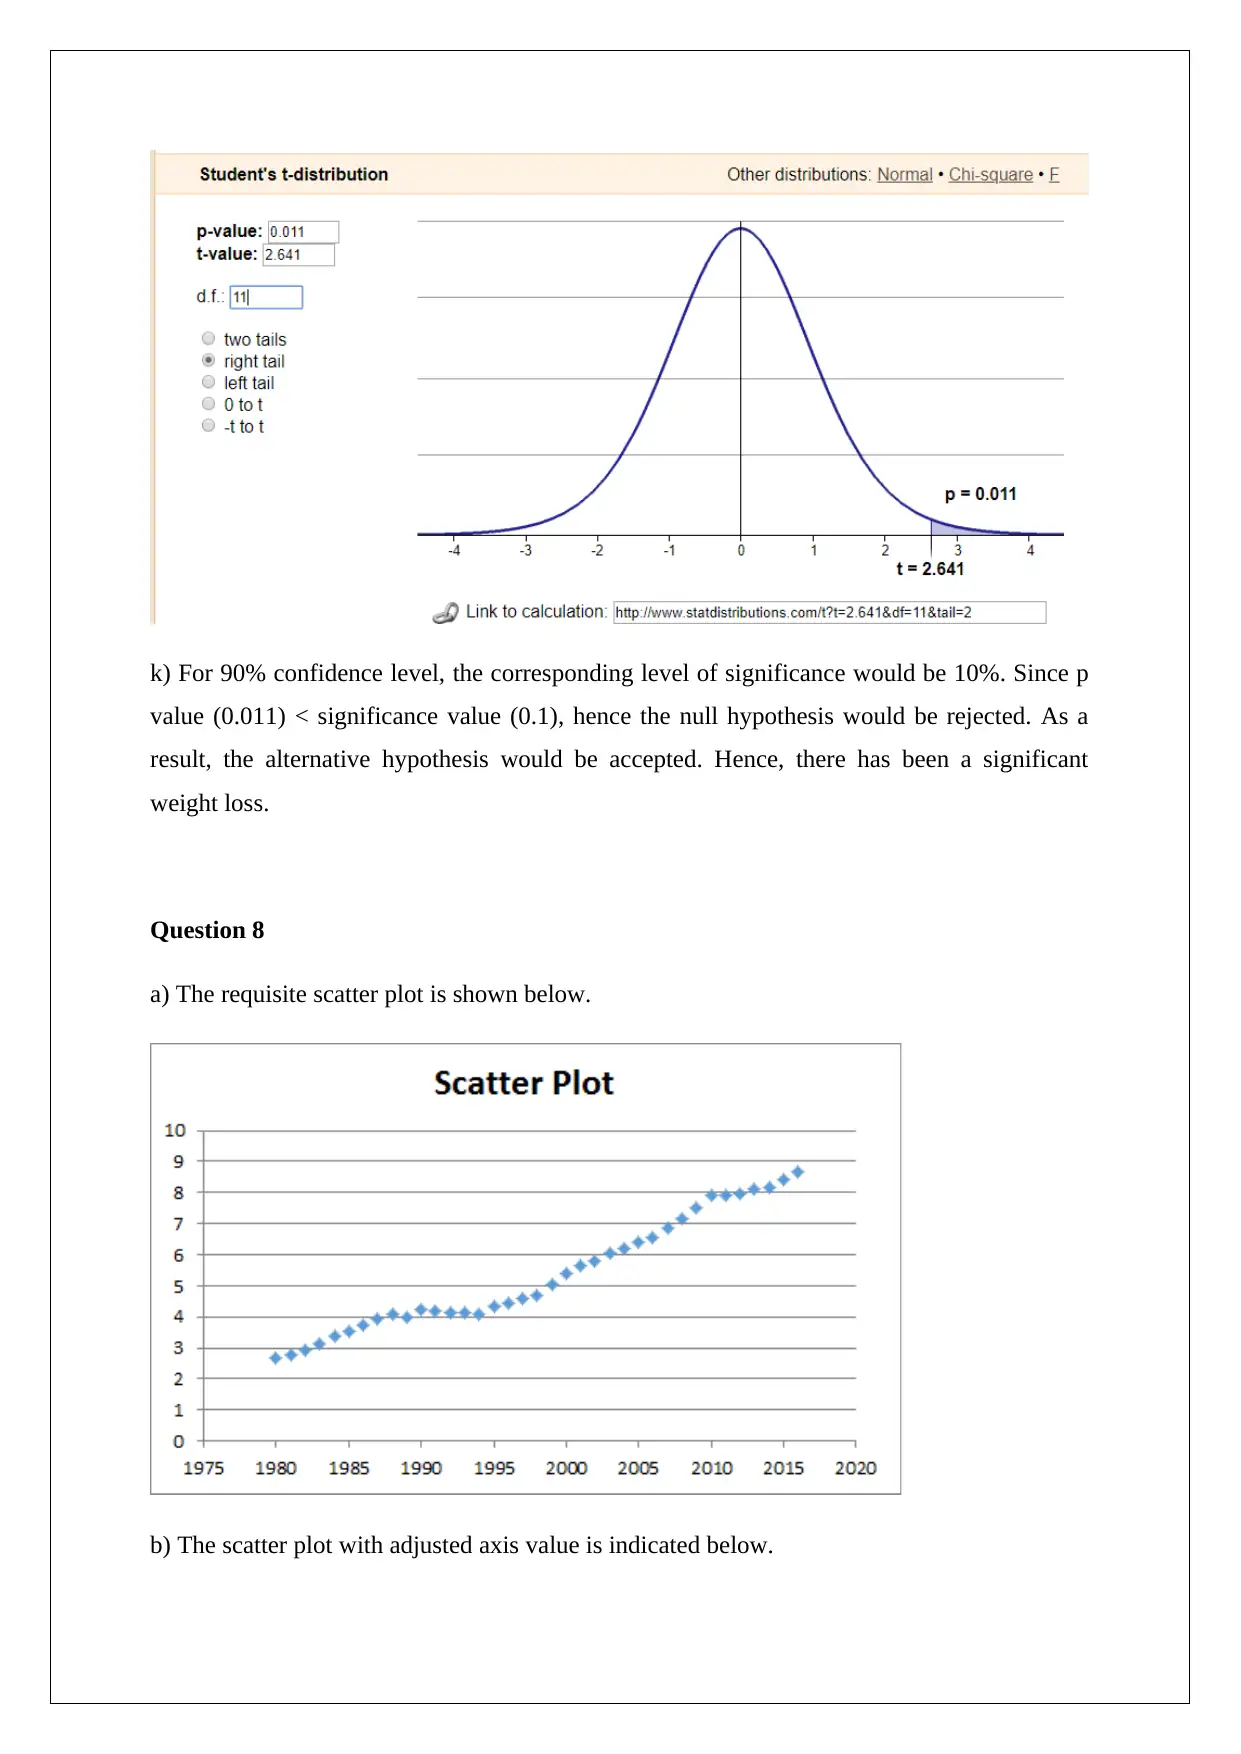
k) For 90% confidence level, the corresponding level of significance would be 10%. Since p
value (0.011) < significance value (0.1), hence the null hypothesis would be rejected. As a
result, the alternative hypothesis would be accepted. Hence, there has been a significant
weight loss.
Question 8
a) The requisite scatter plot is shown below.
b) The scatter plot with adjusted axis value is indicated below.
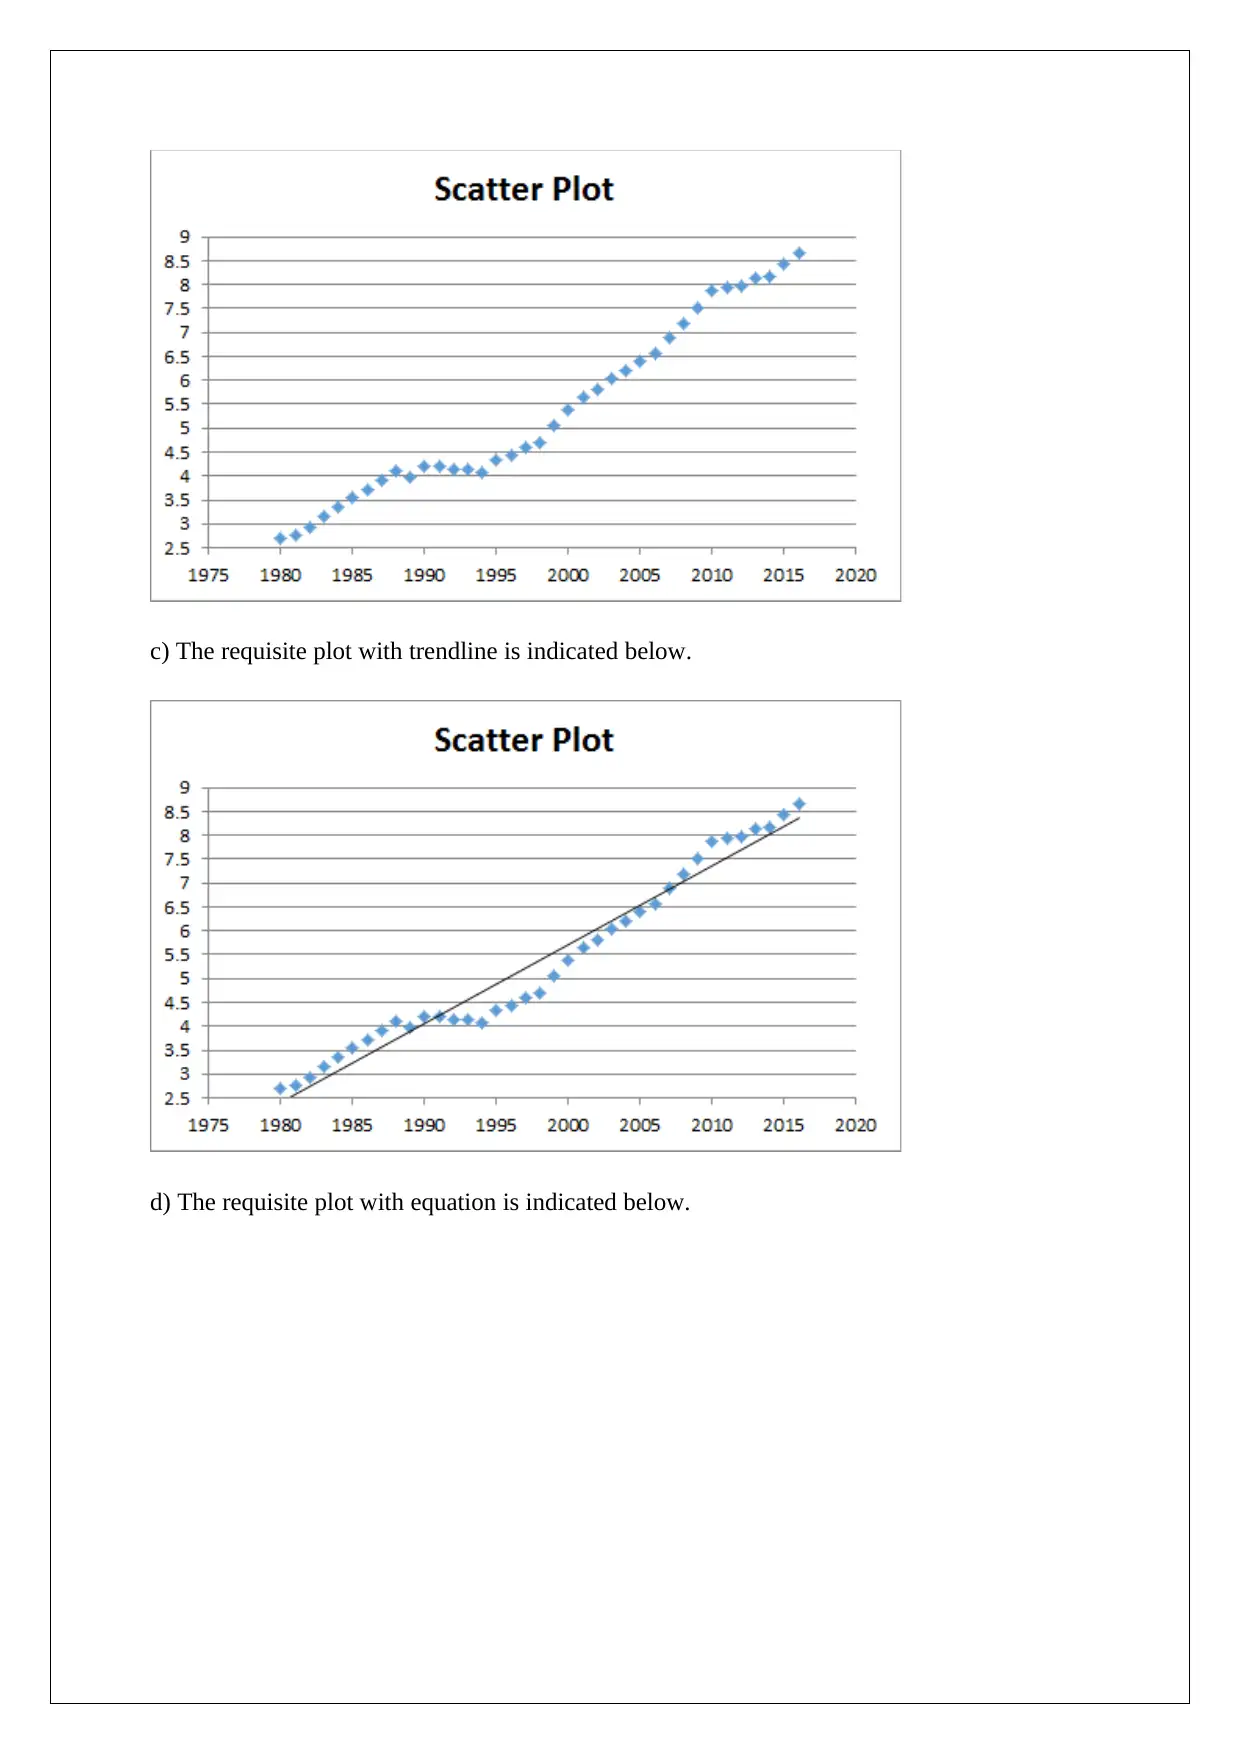
c) The requisite plot with trendline is indicated below.
d) The requisite plot with equation is indicated below.
d) The requisite plot with equation is indicated below.
⊘ This is a preview!⊘
Do you want full access?
Subscribe today to unlock all pages.
Trusted by 1+ million students worldwide
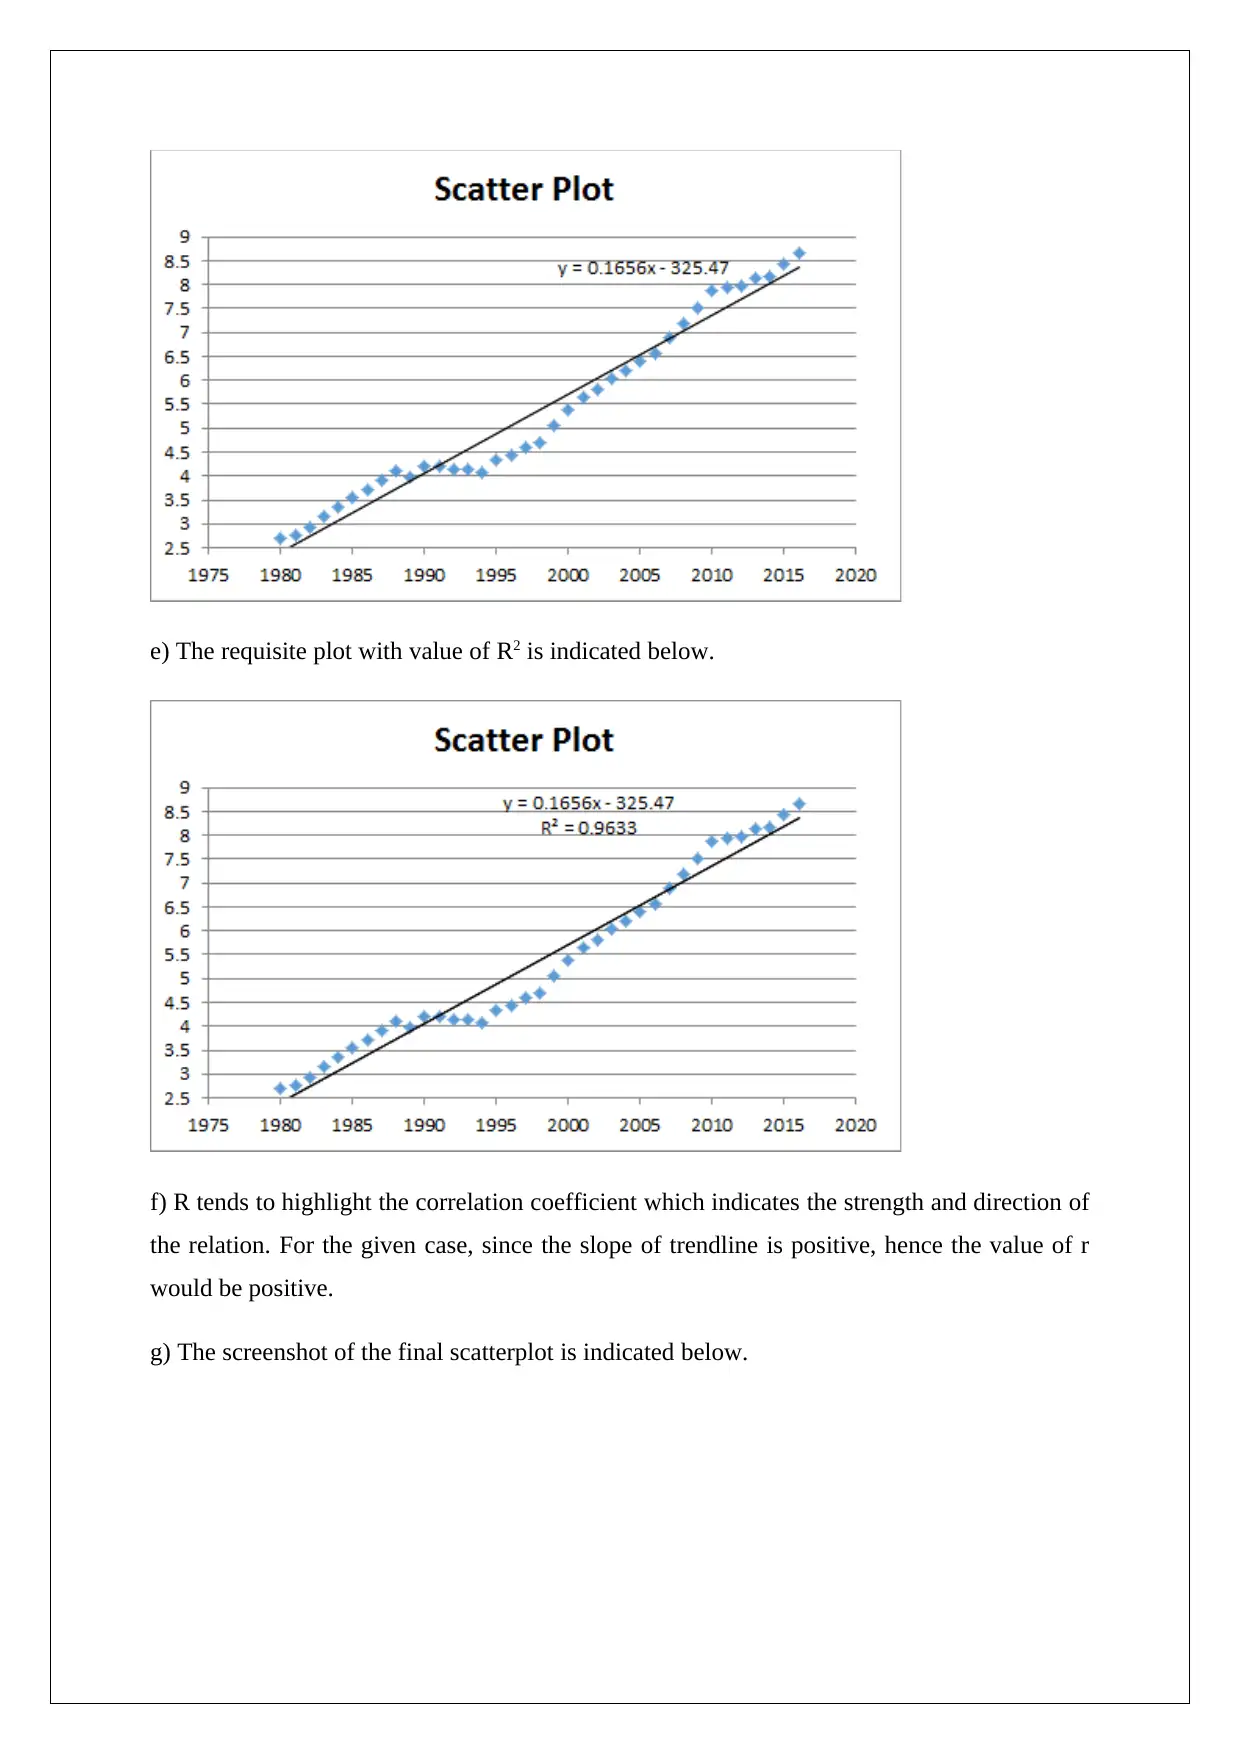
e) The requisite plot with value of R2 is indicated below.
f) R tends to highlight the correlation coefficient which indicates the strength and direction of
the relation. For the given case, since the slope of trendline is positive, hence the value of r
would be positive.
g) The screenshot of the final scatterplot is indicated below.
f) R tends to highlight the correlation coefficient which indicates the strength and direction of
the relation. For the given case, since the slope of trendline is positive, hence the value of r
would be positive.
g) The screenshot of the final scatterplot is indicated below.
Paraphrase This Document
Need a fresh take? Get an instant paraphrase of this document with our AI Paraphraser
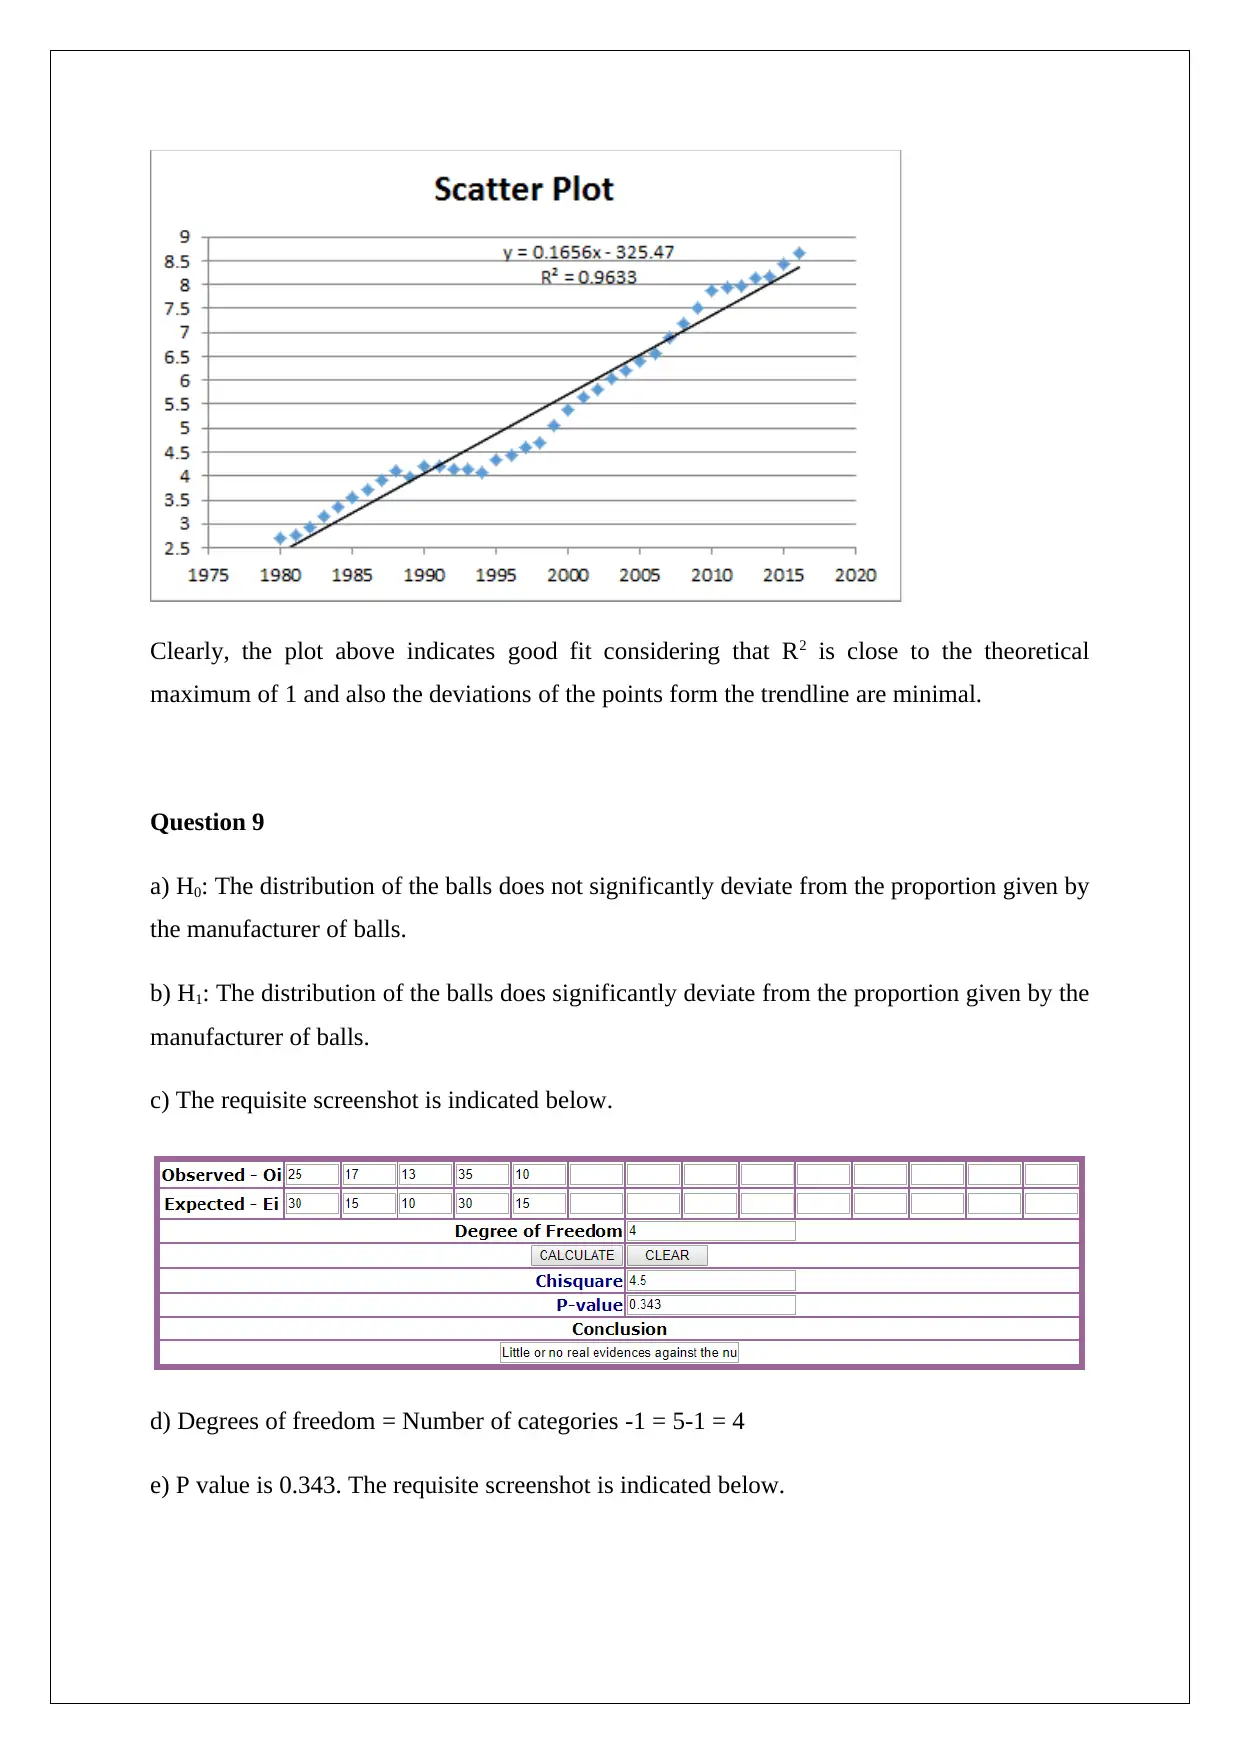
Clearly, the plot above indicates good fit considering that R2 is close to the theoretical
maximum of 1 and also the deviations of the points form the trendline are minimal.
Question 9
a) H0: The distribution of the balls does not significantly deviate from the proportion given by
the manufacturer of balls.
b) H1: The distribution of the balls does significantly deviate from the proportion given by the
manufacturer of balls.
c) The requisite screenshot is indicated below.
d) Degrees of freedom = Number of categories -1 = 5-1 = 4
e) P value is 0.343. The requisite screenshot is indicated below.
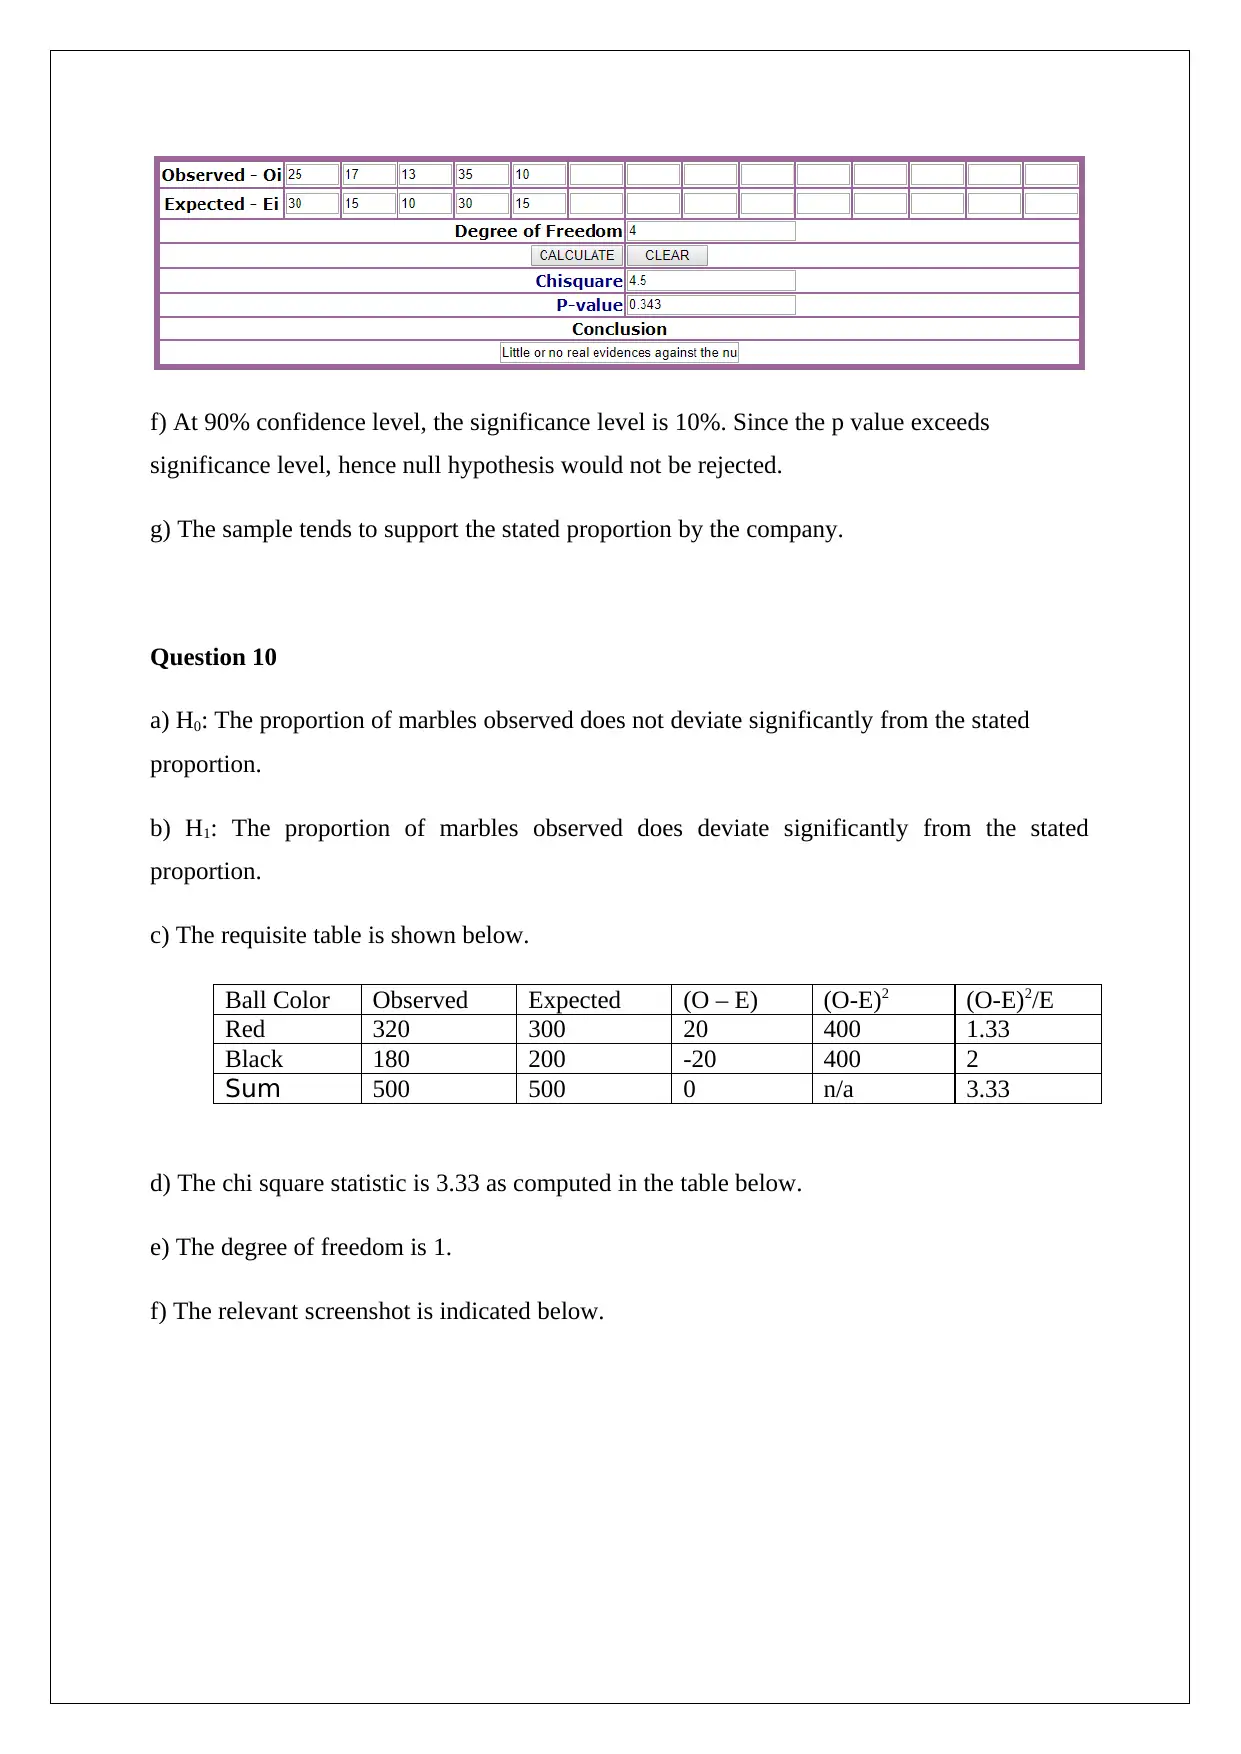
f) At 90% confidence level, the significance level is 10%. Since the p value exceeds
significance level, hence null hypothesis would not be rejected.
g) The sample tends to support the stated proportion by the company.
Question 10
a) H0: The proportion of marbles observed does not deviate significantly from the stated
proportion.
b) H1: The proportion of marbles observed does deviate significantly from the stated
proportion.
c) The requisite table is shown below.
Ball Color Observed Expected (O – E) (O-E)2 (O-E)2/E
Red 320 300 20 400 1.33
Black 180 200 -20 400 2
Sum 500 500 0 n/a 3.33
d) The chi square statistic is 3.33 as computed in the table below.
e) The degree of freedom is 1.
f) The relevant screenshot is indicated below.
⊘ This is a preview!⊘
Do you want full access?
Subscribe today to unlock all pages.
Trusted by 1+ million students worldwide
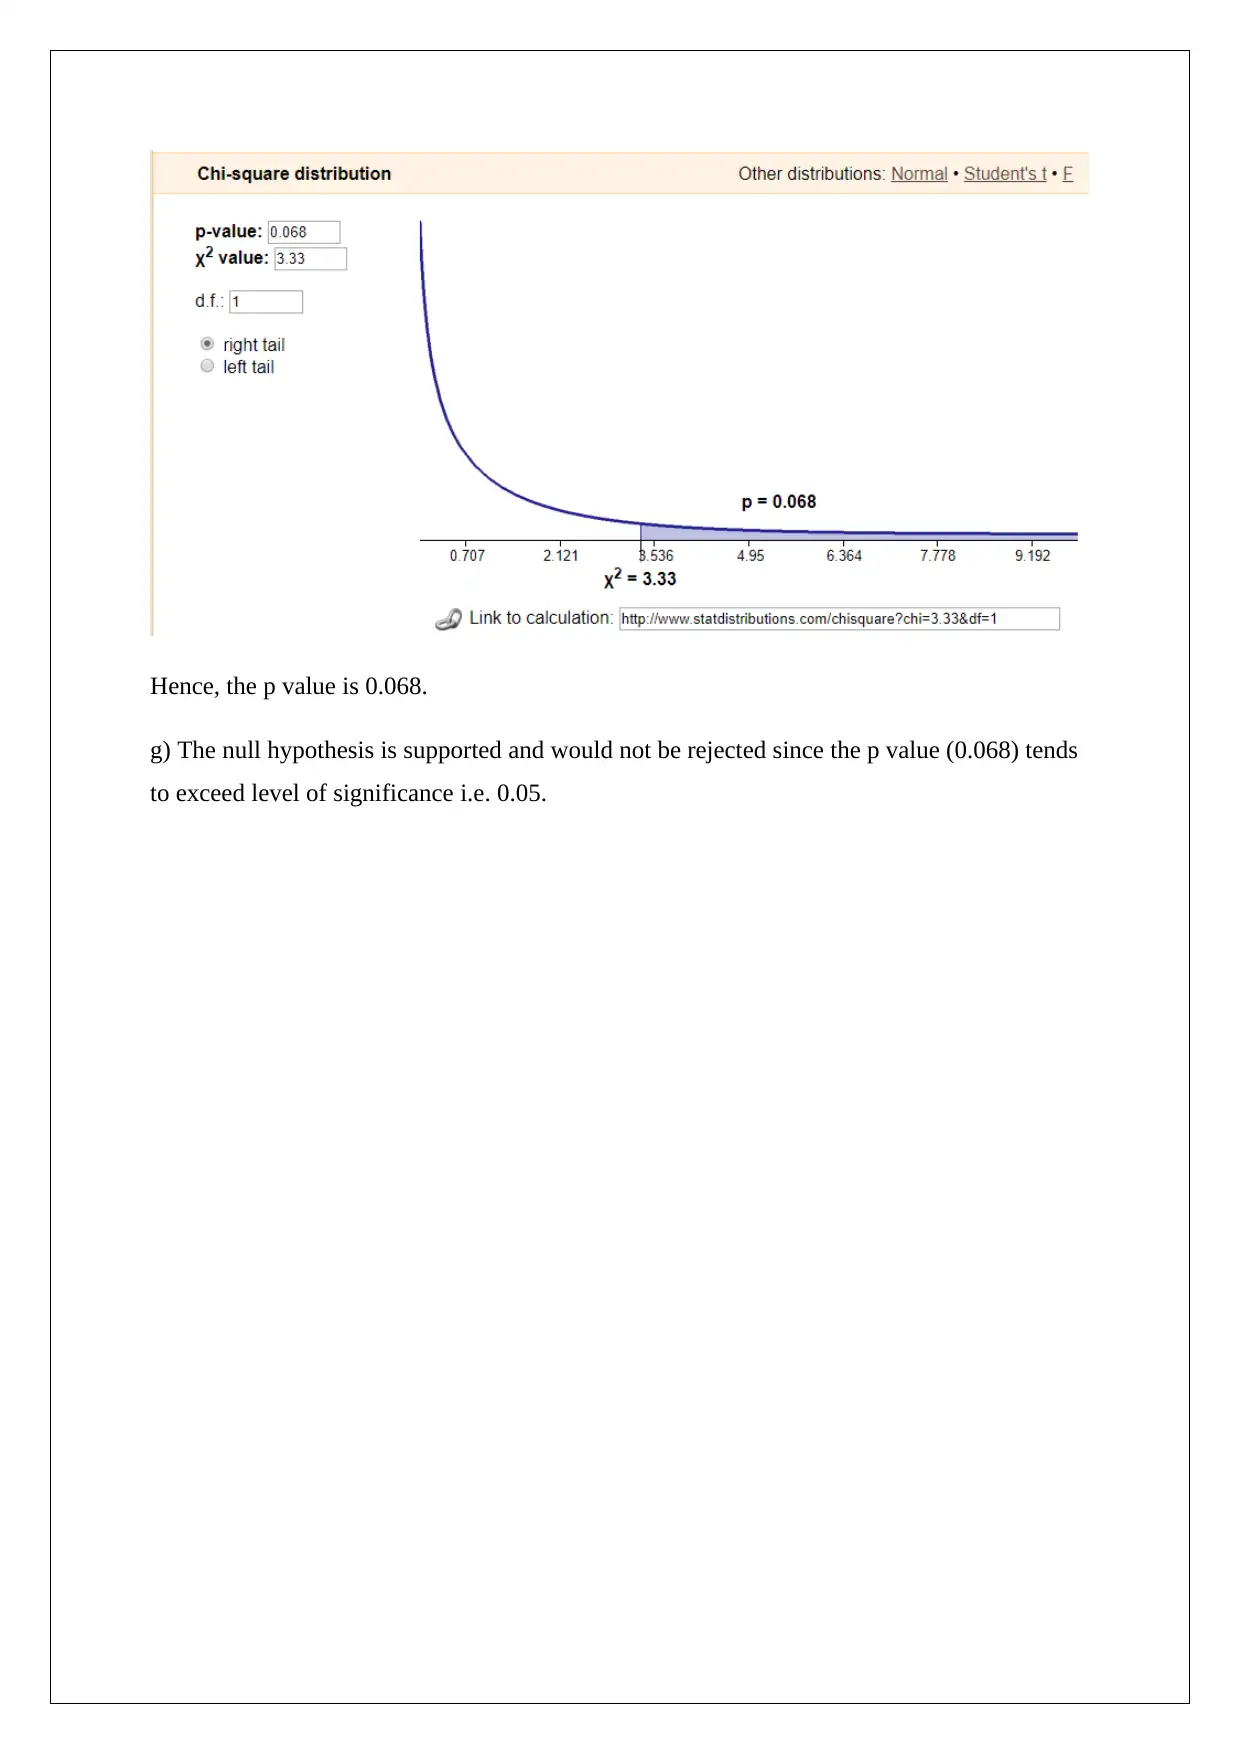
Hence, the p value is 0.068.
g) The null hypothesis is supported and would not be rejected since the p value (0.068) tends
to exceed level of significance i.e. 0.05.
g) The null hypothesis is supported and would not be rejected since the p value (0.068) tends
to exceed level of significance i.e. 0.05.
1 out of 13
Related Documents


Your All-in-One AI-Powered Toolkit for Academic Success.
+13062052269
info@desklib.com
Available 24*7 on WhatsApp / Email
![[object Object]](/_next/static/media/star-bottom.7253800d.svg)
Unlock your academic potential
© 2024 | Zucol Services PVT LTD | All rights reserved.