Predicting Airline Passenger Satisfaction: A Statistics in R Project
VerifiedAdded on 2022/08/30
|14
|2264
|24
Project
AI Summary
This project delves into the analysis of airline customer satisfaction using the R programming language and machine learning techniques. The objective is to predict passenger satisfaction levels based on various factors, enabling airlines to address issues and improve services. The analysis begins with ...

Running head: STATISTICS IN R
Statistics in R
Student Name:
Statistics in R
Student Name:
Paraphrase This Document
Need a fresh take? Get an instant paraphrase of this document with our AI Paraphraser
2Statistics in R
Executive Summary
Machine learning is termed to be as one of the most powerful and advance technology in
recent world. More over the full potential has not been exploited so far. Machine learning is
the technology to transfer information into knowledge. Machine learning gives the ability to
learn from itself to the computer. Thus, different decision and classification-based problems
can be solved using these techniques and algorithms easily. In these analyses two dataset are
used and combine to one for further analysis. The dataset used is the survey result of
customer satisfaction for various facilities provided in the flights. The objective of the
analysis is to predict which passengers are satisfied with the specified amenities and who are
not so that the airline agency can fix the issue which can hamper the growth of airline
industry a lot. Different machine learning techniques are implemented for classifying
different classes. And at the end some conclusion has been concluded regarding the analysis
and some future scopes were also been discussed.
3Statistics in R
Table of Contents
Executive Summary...................................................................................................................2
Introduction................................................................................................................................4
Discussion..................................................................................................................................4
Conclusion................................................................................................................................13
References................................................................................................................................14
⊘ This is a preview!⊘
Do you want full access?
Subscribe today to unlock all pages.
Trusted by 1+ million students worldwide
4Statistics in R
Introduction
Machine learning is the study which gives the ability to learn by itself without any
human interaction. Sometimes it can be said that machine learning is a subpart of artificial
intelligence (Biau & Scornet, 2016). Basically, it is based on the system which has the ability
to learn from the data given and can identify the patterns and can make accurate decisions
with minimal human interaction (Bischl et al., 2016). The process starts with data exploration
and observation in order to look for patters in data and better decision could be made in the
near future.
Machine learning algorithm generally classified into 2 categories-
Supervised learning
Un-supervised Learning
In supervised learning ladled data are provided with input data and the expected output
data are also known whereas in unsupervised learning unlabelled data are used with no proper
expected outcomes (Bottou, Curtis & Nocedal, 2018).
Discussion
The dataset used is the survey result of the airlines. Where different kinds of
feedbacks were given by the customer for various facilities provide by the airlines. The
intention of the analysis is to predict the outcomes of the customer satisfaction with respect to
other factors (Catal & Nangir, 2017). Mainly the target variable is the satisfaction of the
customer i.e.- with the facilities the customer is been satisfied or not. A lot of attributes are
taken for consideration to come up with the conclusion that the particular customer is
satisfied or not (Farooq et al., 2018).
Paraphrase This Document
Need a fresh take? Get an instant paraphrase of this document with our AI Paraphraser
5Statistics in R
Also it can be taken to consideration that customer experience not only includes the
facilities provided in the flight itself. Purchasing flight tickets from the company’s website or
from the mobile application to baggage checking inside the airport or checking via mobile
app waiting inside the terminal (Gasso, 2019).
The dataset contains a lot of details about each facility that were provided by the airlines. The
main purposes of the analysis are-
To understand which parameters, play an important role in converting a passenger
feedback towards ‘satisfied’.
To predict whether a passenger will be satisfied or not given the rest of the details are
provided.
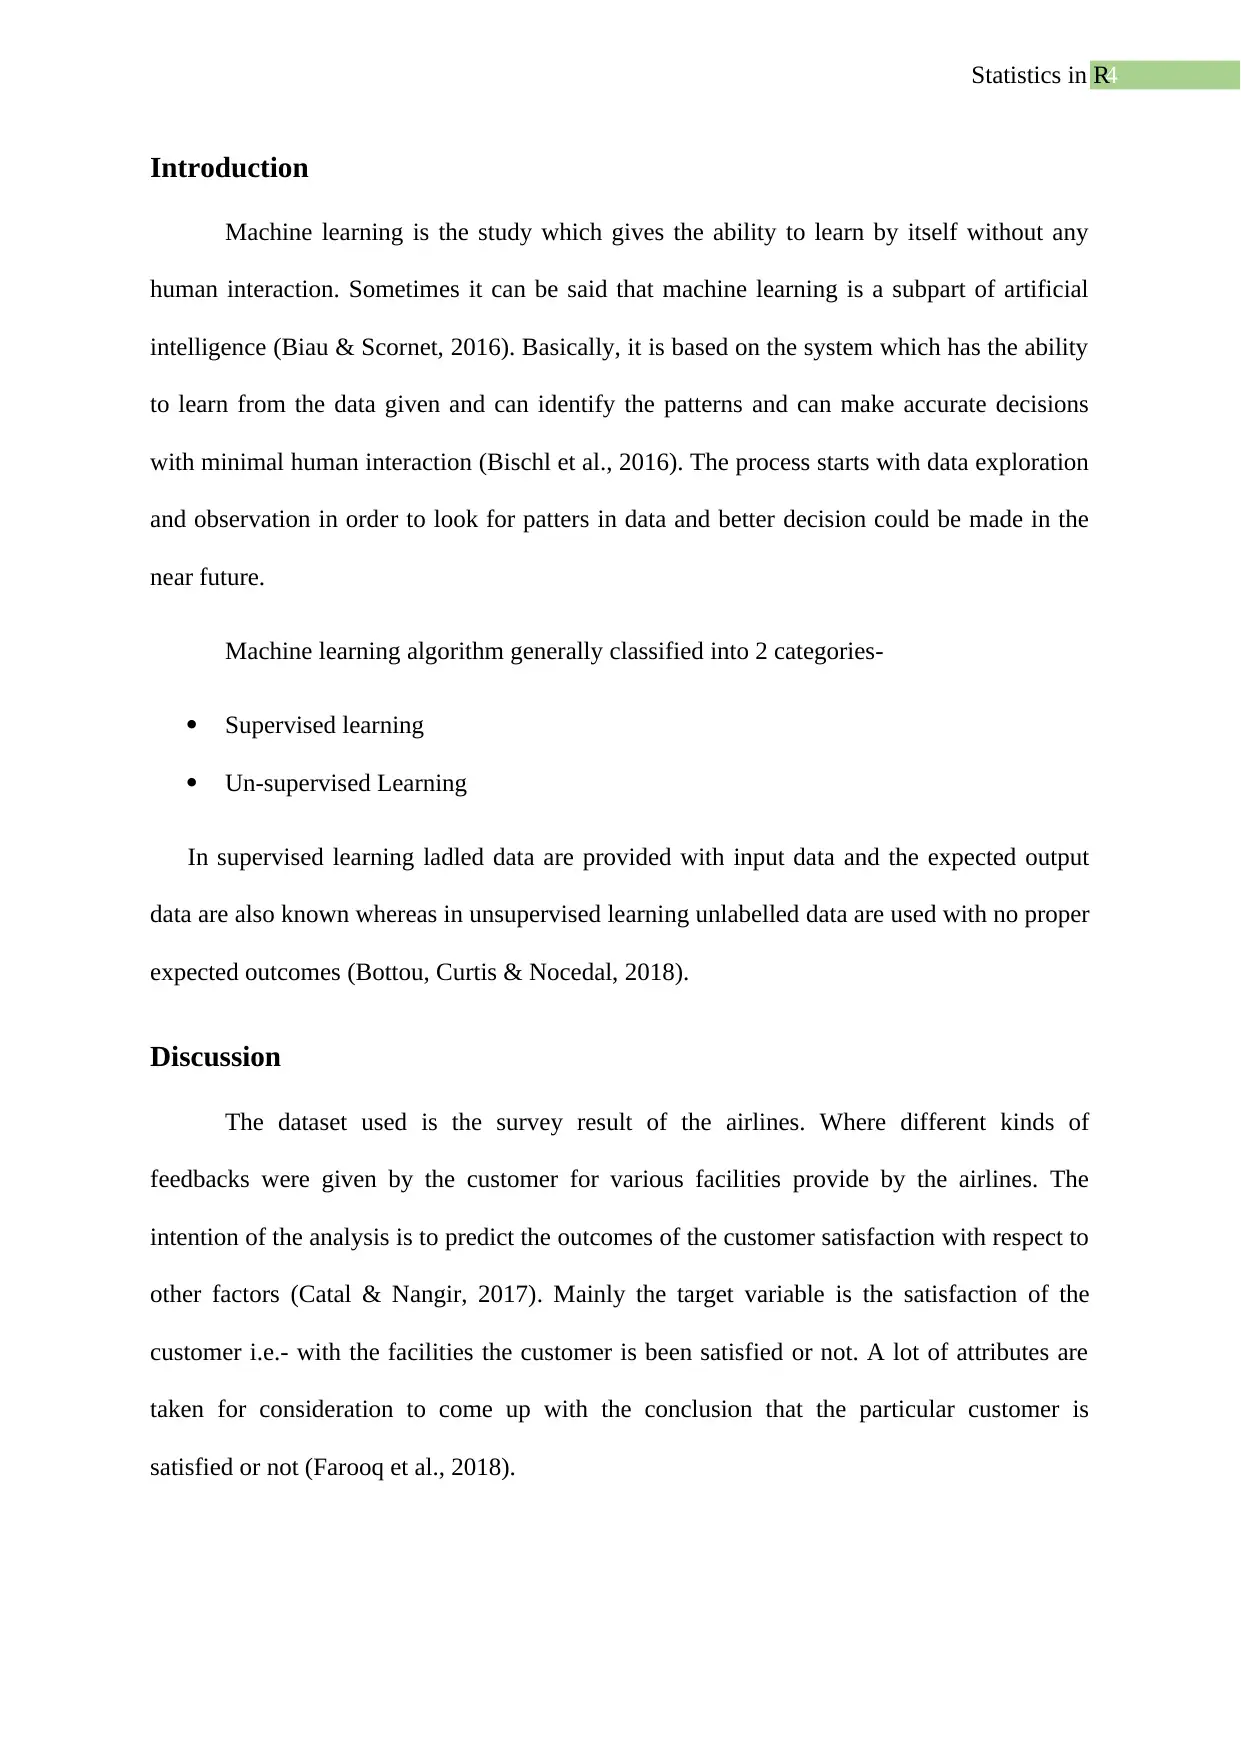
Different exploratory analysis has been conducted to get the in depth meaning of the dataset
which are included below.
Figure 1: Satisfaction vs Class
Also it can be taken to consideration that customer experience not only includes the
facilities provided in the flight itself. Purchasing flight tickets from the company’s website or
from the mobile application to baggage checking inside the airport or checking via mobile
app waiting inside the terminal (Gasso, 2019).
The dataset contains a lot of details about each facility that were provided by the airlines. The
main purposes of the analysis are-
To understand which parameters, play an important role in converting a passenger
feedback towards ‘satisfied’.
To predict whether a passenger will be satisfied or not given the rest of the details are
provided.
Different exploratory analysis has been conducted to get the in depth meaning of the dataset
which are included below.
Figure 1: Satisfaction vs Class
6Statistics in R
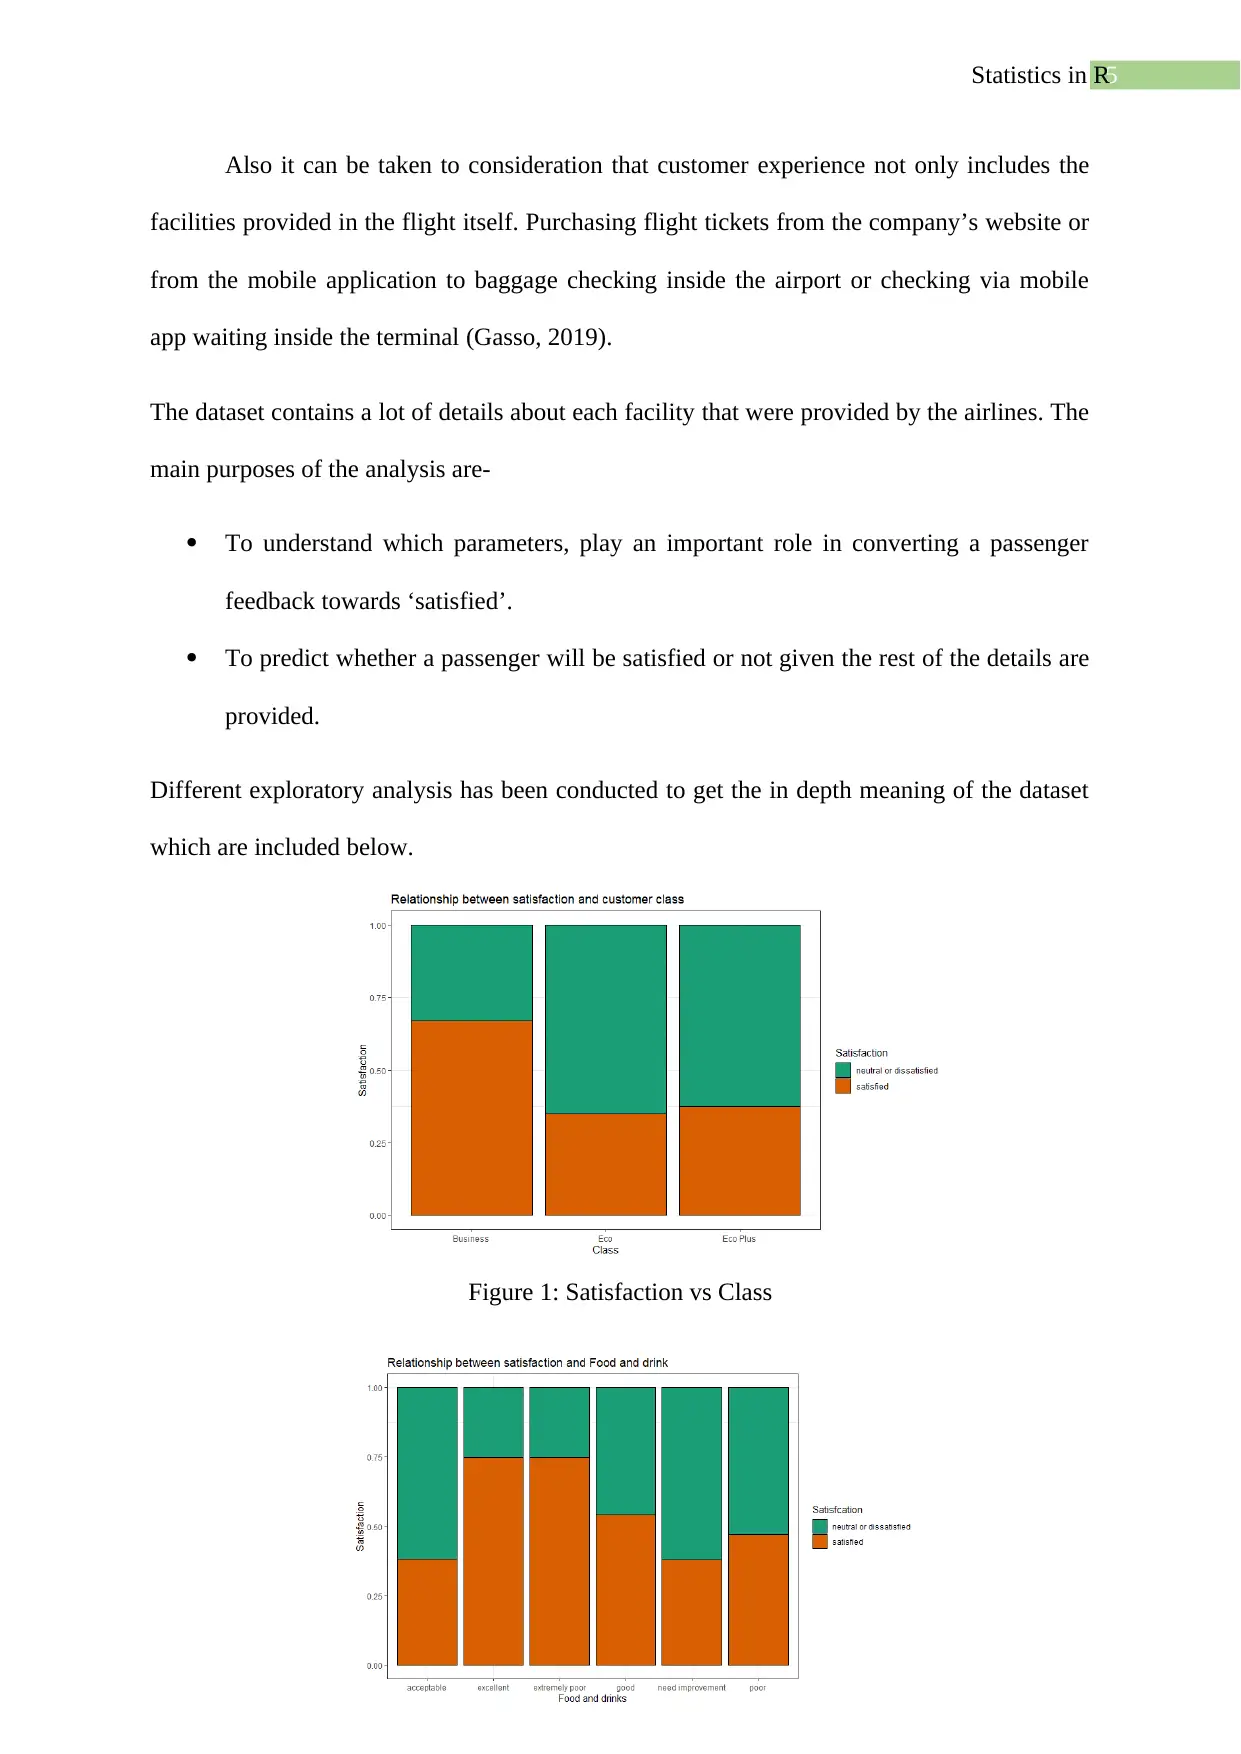
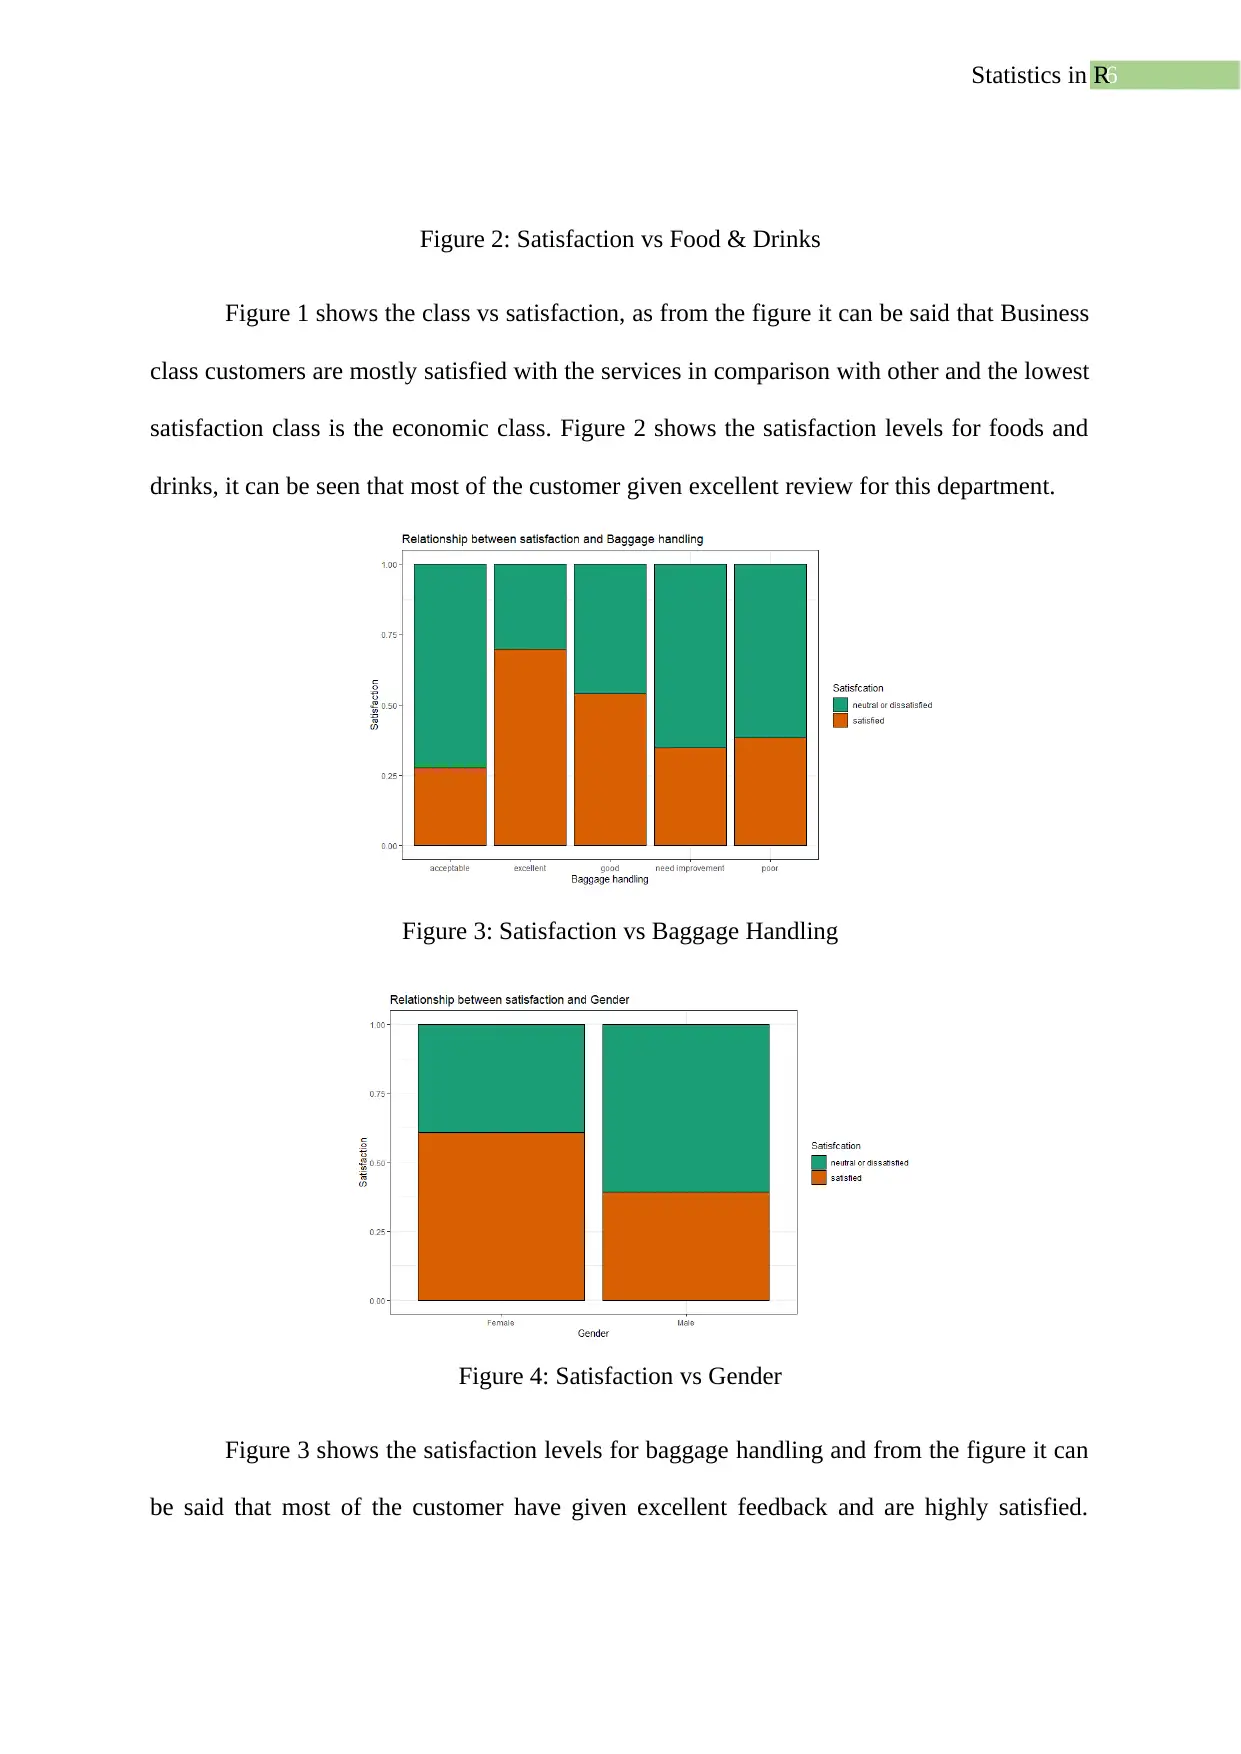
Figure 2: Satisfaction vs Food & Drinks
Figure 1 shows the class vs satisfaction, as from the figure it can be said that Business
class customers are mostly satisfied with the services in comparison with other and the lowest
satisfaction class is the economic class. Figure 2 shows the satisfaction levels for foods and
drinks, it can be seen that most of the customer given excellent review for this department.
Figure 3: Satisfaction vs Baggage Handling
Figure 4: Satisfaction vs Gender
Figure 3 shows the satisfaction levels for baggage handling and from the figure it can
be said that most of the customer have given excellent feedback and are highly satisfied.
⊘ This is a preview!⊘
Do you want full access?
Subscribe today to unlock all pages.
Trusted by 1+ million students worldwide
7Statistics in R
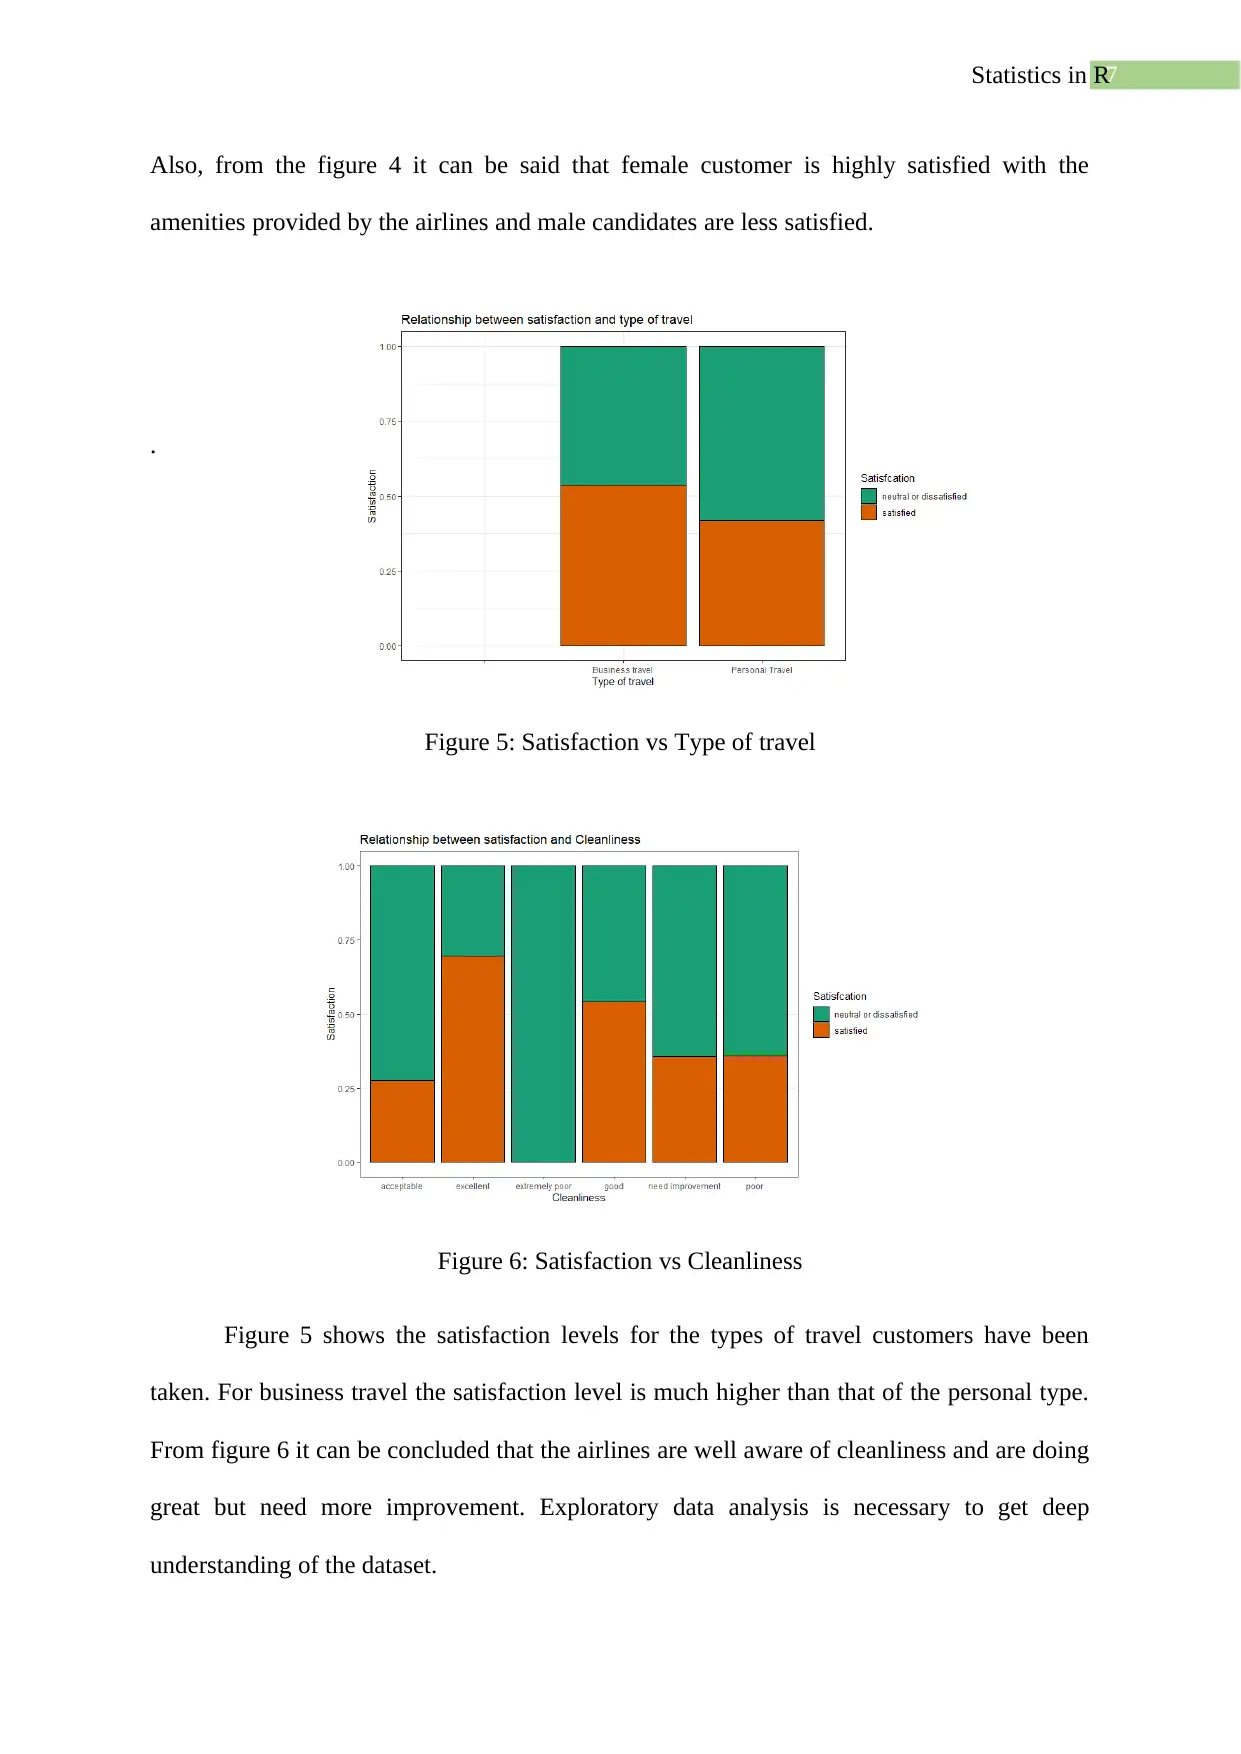
Also, from the figure 4 it can be said that female customer is highly satisfied with the
amenities provided by the airlines and male candidates are less satisfied.
.
Figure 5: Satisfaction vs Type of travel
Figure 6: Satisfaction vs Cleanliness
Figure 5 shows the satisfaction levels for the types of travel customers have been
taken. For business travel the satisfaction level is much higher than that of the personal type.
From figure 6 it can be concluded that the airlines are well aware of cleanliness and are doing
great but need more improvement. Exploratory data analysis is necessary to get deep
understanding of the dataset.
Paraphrase This Document
Need a fresh take? Get an instant paraphrase of this document with our AI Paraphraser
8Statistics in R
The analysis part consists of many stages as two different data set have been provided
which are interlinked with one another thus at first the two datasets were merged in order to
get the complete dataset. After the completion the dataset contains many missing and null
values which needs to be cleaned for further analysis (Hilbe, 2016). After the removal of null
values the next step is converting the required fields into the factor which is crucial for model
processing of the data.
The next step is the splitting of data into train and test set which will be used to train
the model and the test data will be used to predict the satisfaction class. The splitting ratio is
80-20% where the training dataset consist of 80% of the whole dataset and the test dataset
consist of 20% of the whole dataset.
The next step is choosing the most significant and important variables from the
database and exclude the redundant variable which are not affect the performance of the
model. Thus the variables seat comfort, gate location, online support, on board service, online
boarding, id, checkin services and cleanliness were shown to be insignificant and decided to
not use them in the model to improve the reliability of it.
Two different machine learning model were built with respect to the dataset which are
mainly-
Logistic Regression model
Random Forest model
When the dependent variables are categorical only then logistic regression re used
(Kamamoto, Moriya & Harada, 2019). Also the main benefit of logistic regression is that it is
also called predictive analysis. To show a detail relationship between one nominal variable
and one dependent variable, with ordinal variable or it can be ratio-level independent
variables, logistic regression plays a crucial role here (Lever, Krzywinski & Altman, 2016).
9Statistics in R
Random forest is basically both a classification algorithm as well as a regression
algorithm however mostly it is been used worldwide for classification problems (Tang &
Ishwaran, 2017). A forest is comprised of trees (Mohri, Rostamizadeh & Talwalkar, 2018).
The more robust a forests then there will be more number of trees. Random forest is created
by sampling the data randomly then get the predicted value from each tree and the best
solution will be selected using mean of voting (Rainey, 2016).
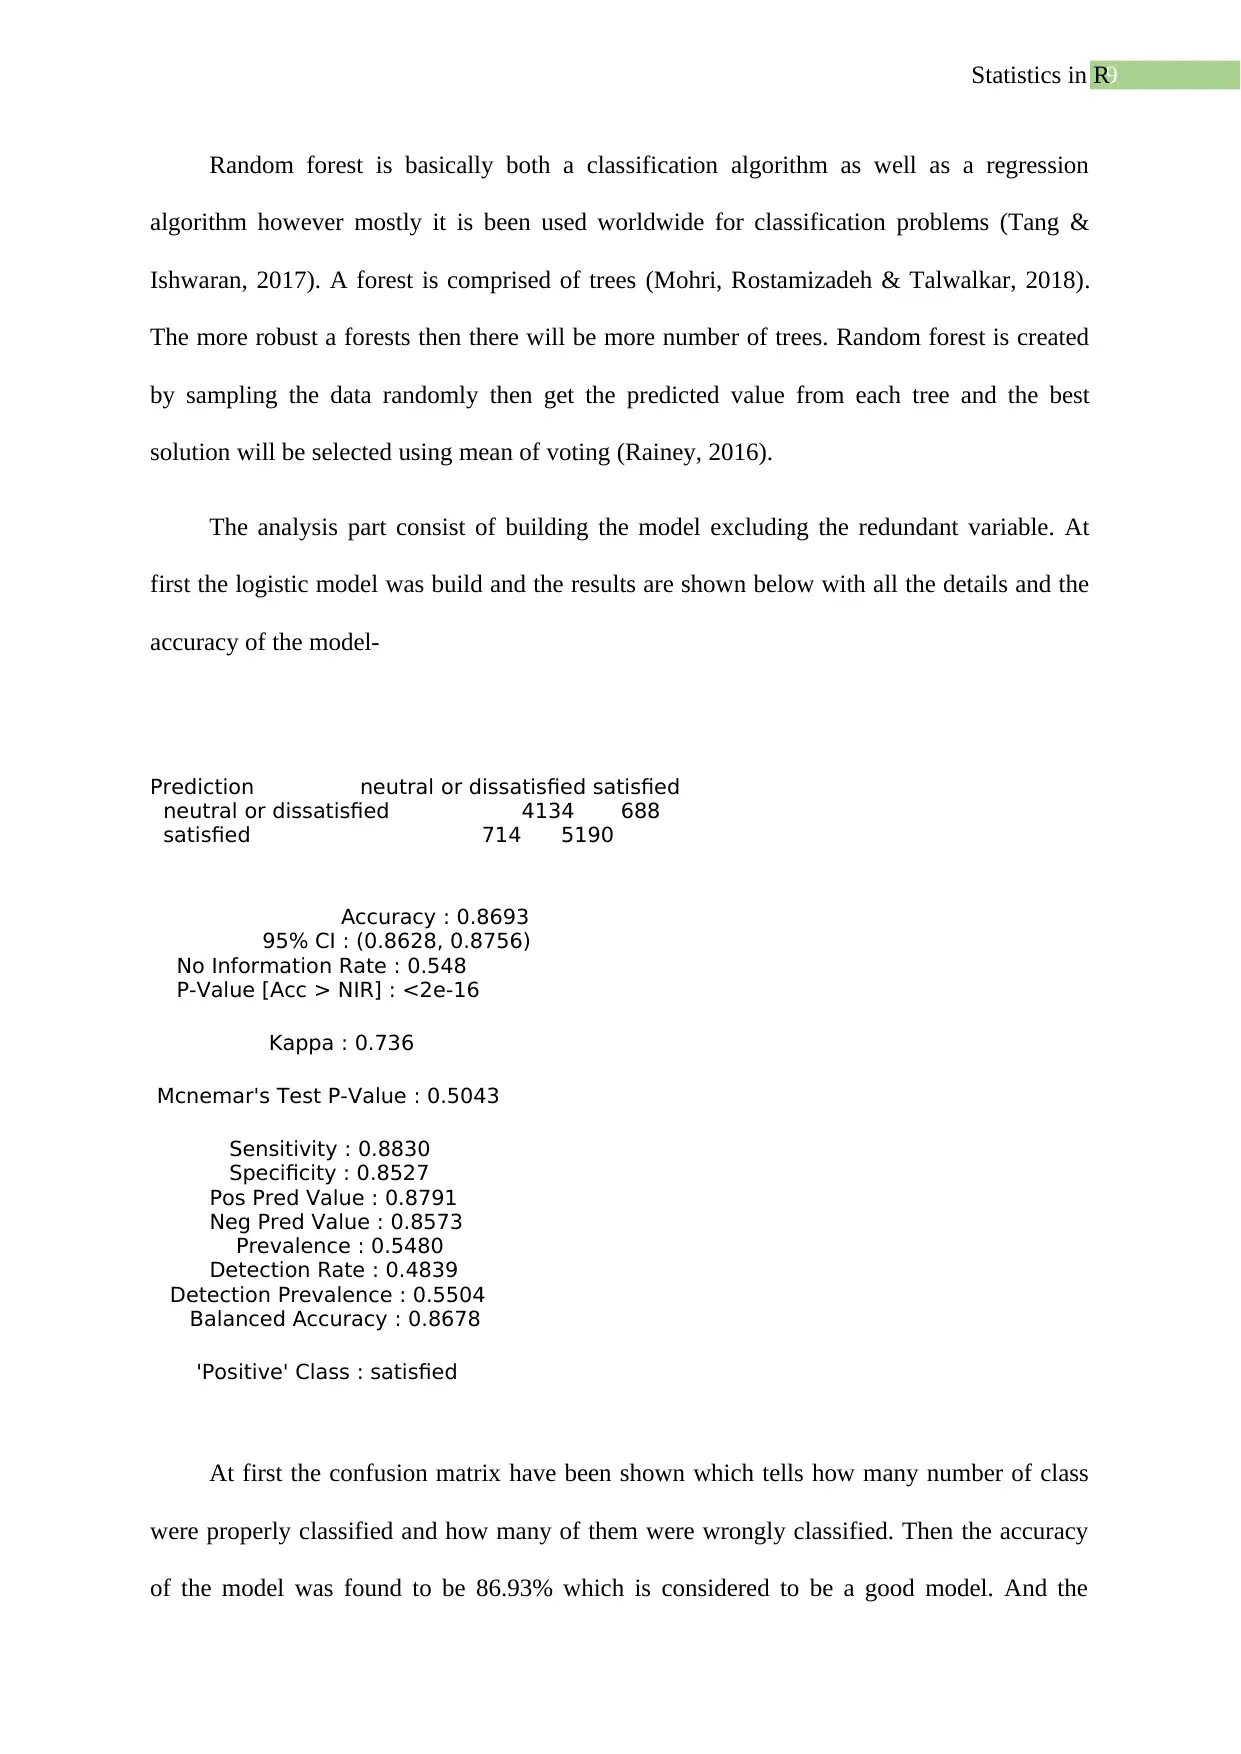
The analysis part consist of building the model excluding the redundant variable. At
first the logistic model was build and the results are shown below with all the details and the
accuracy of the model-
Prediction neutral or dissatisfied satisfied
neutral or dissatisfied 4134 688
satisfied 714 5190
Accuracy : 0.8693
95% CI : (0.8628, 0.8756)
No Information Rate : 0.548
P-Value [Acc > NIR] : <2e-16
Kappa : 0.736
Mcnemar's Test P-Value : 0.5043
Sensitivity : 0.8830
Specificity : 0.8527
Pos Pred Value : 0.8791
Neg Pred Value : 0.8573
Prevalence : 0.5480
Detection Rate : 0.4839
Detection Prevalence : 0.5504
Balanced Accuracy : 0.8678
'Positive' Class : satisfied
At first the confusion matrix have been shown which tells how many number of class
were properly classified and how many of them were wrongly classified. Then the accuracy
of the model was found to be 86.93% which is considered to be a good model. And the
Random forest is basically both a classification algorithm as well as a regression
algorithm however mostly it is been used worldwide for classification problems (Tang &
Ishwaran, 2017). A forest is comprised of trees (Mohri, Rostamizadeh & Talwalkar, 2018).
The more robust a forests then there will be more number of trees. Random forest is created
by sampling the data randomly then get the predicted value from each tree and the best
solution will be selected using mean of voting (Rainey, 2016).
The analysis part consist of building the model excluding the redundant variable. At
first the logistic model was build and the results are shown below with all the details and the
accuracy of the model-
Prediction neutral or dissatisfied satisfied
neutral or dissatisfied 4134 688
satisfied 714 5190
Accuracy : 0.8693
95% CI : (0.8628, 0.8756)
No Information Rate : 0.548
P-Value [Acc > NIR] : <2e-16
Kappa : 0.736
Mcnemar's Test P-Value : 0.5043
Sensitivity : 0.8830
Specificity : 0.8527
Pos Pred Value : 0.8791
Neg Pred Value : 0.8573
Prevalence : 0.5480
Detection Rate : 0.4839
Detection Prevalence : 0.5504
Balanced Accuracy : 0.8678
'Positive' Class : satisfied
At first the confusion matrix have been shown which tells how many number of class
were properly classified and how many of them were wrongly classified. Then the accuracy
of the model was found to be 86.93% which is considered to be a good model. And the
⊘ This is a preview!⊘
Do you want full access?
Subscribe today to unlock all pages.
Trusted by 1+ million students worldwide
10Statistics in R
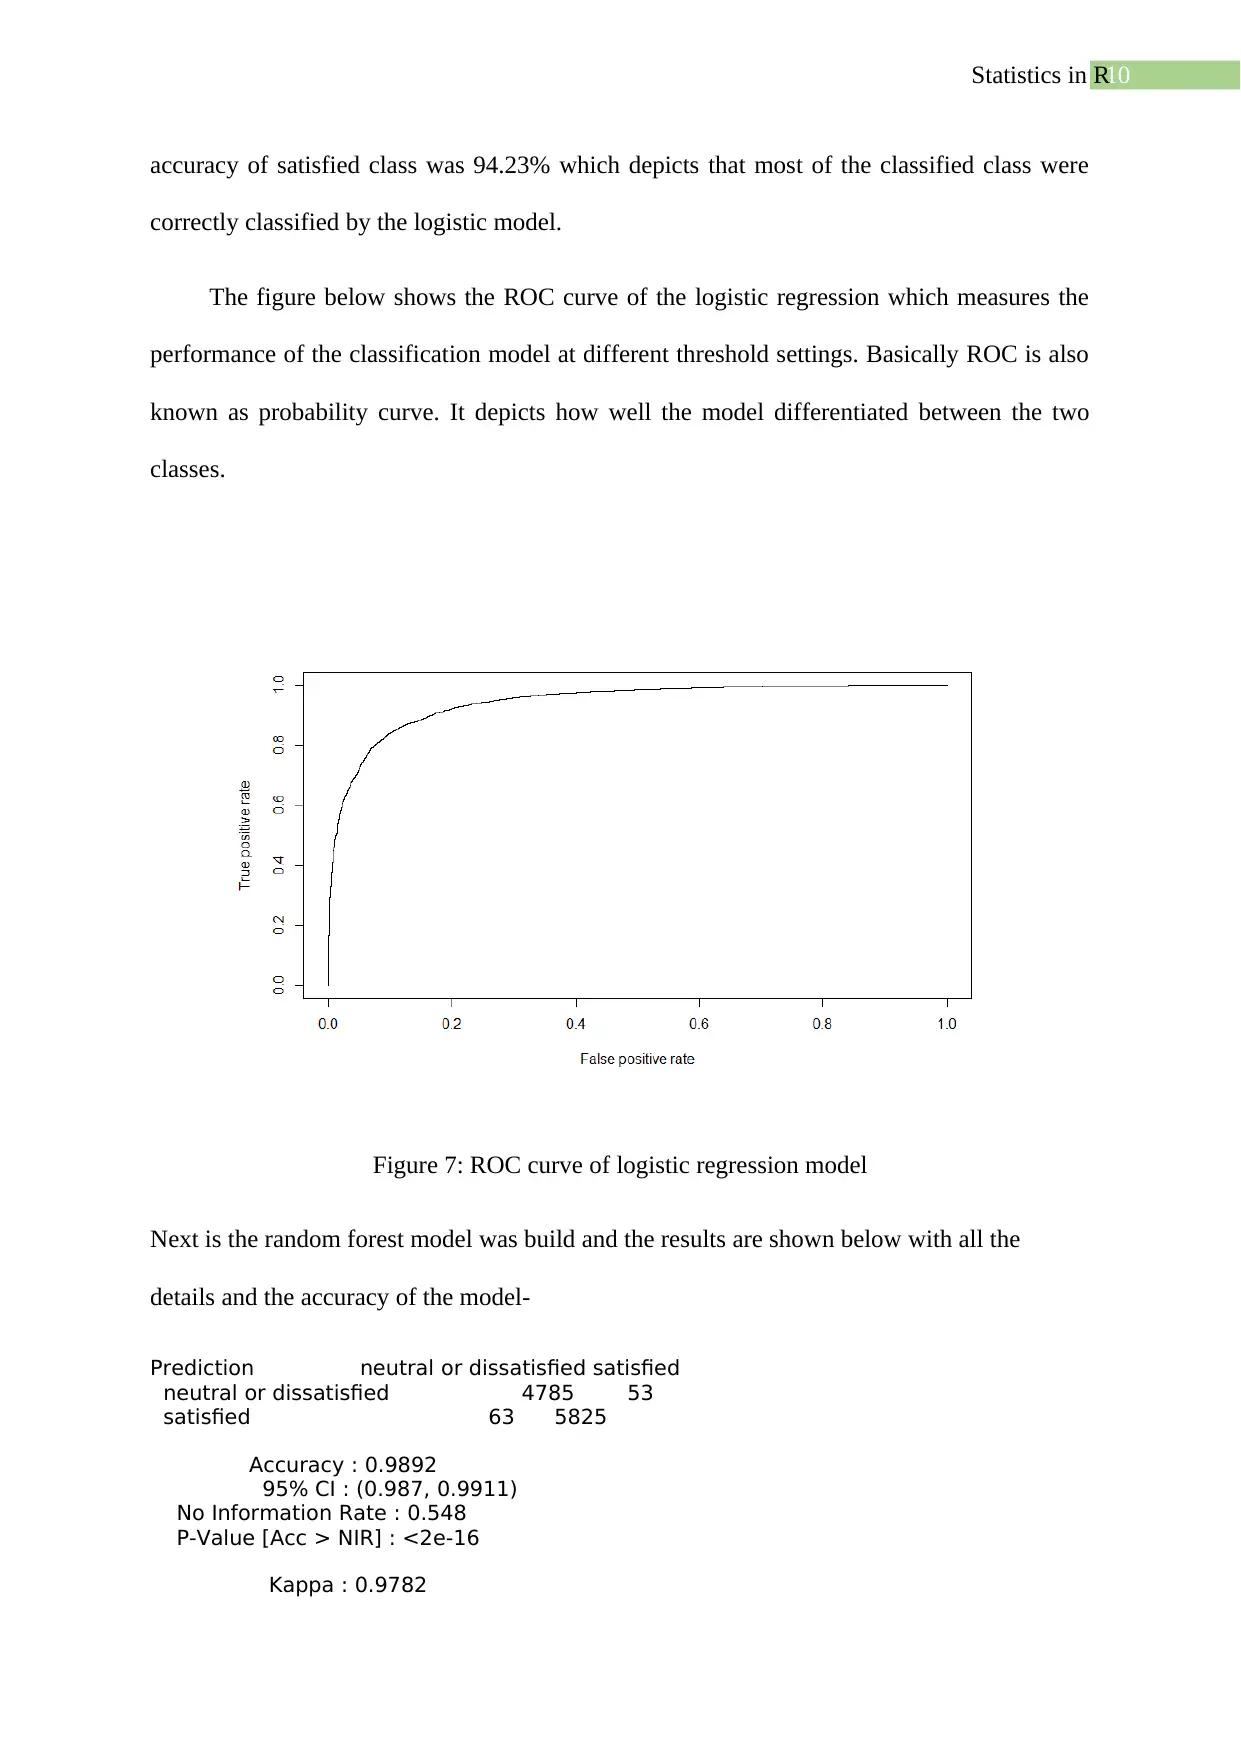
accuracy of satisfied class was 94.23% which depicts that most of the classified class were
correctly classified by the logistic model.
The figure below shows the ROC curve of the logistic regression which measures the
performance of the classification model at different threshold settings. Basically ROC is also
known as probability curve. It depicts how well the model differentiated between the two
classes.
Figure 7: ROC curve of logistic regression model
Next is the random forest model was build and the results are shown below with all the
details and the accuracy of the model-
Prediction neutral or dissatisfied satisfied
neutral or dissatisfied 4785 53
satisfied 63 5825
Accuracy : 0.9892
95% CI : (0.987, 0.9911)
No Information Rate : 0.548
P-Value [Acc > NIR] : <2e-16
Kappa : 0.9782
Paraphrase This Document
Need a fresh take? Get an instant paraphrase of this document with our AI Paraphraser
11Statistics in R
Mcnemar's Test P-Value : 0.4034
Sensitivity : 0.9910
Specificity : 0.9870
Pos Pred Value : 0.9893
Neg Pred Value : 0.9890
Prevalence : 0.5480
Detection Rate : 0.5431
Detection Prevalence : 0.5489
Balanced Accuracy : 0.9890
'Positive' Class : satisfied
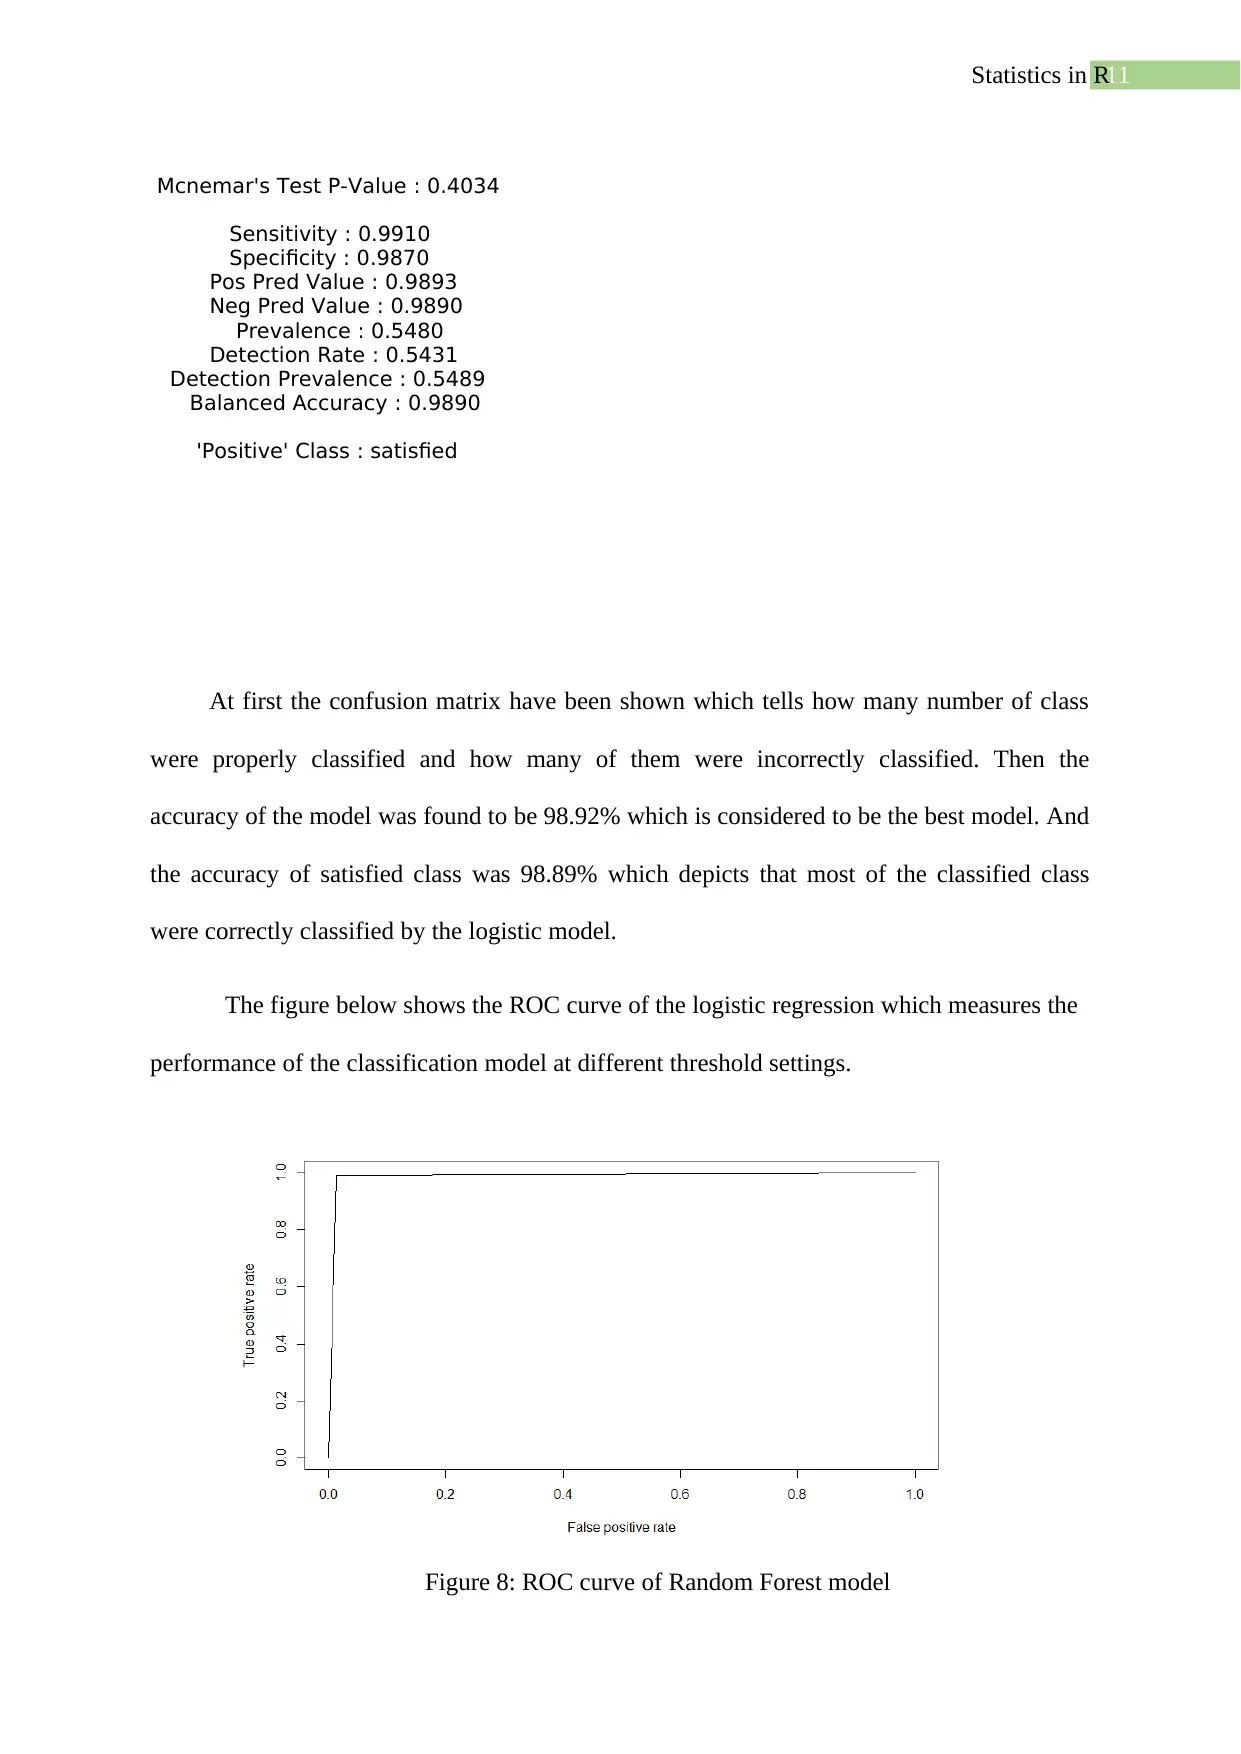
At first the confusion matrix have been shown which tells how many number of class
were properly classified and how many of them were incorrectly classified. Then the
accuracy of the model was found to be 98.92% which is considered to be the best model. And
the accuracy of satisfied class was 98.89% which depicts that most of the classified class
were correctly classified by the logistic model.
The figure below shows the ROC curve of the logistic regression which measures the
performance of the classification model at different threshold settings.
Figure 8: ROC curve of Random Forest model
Mcnemar's Test P-Value : 0.4034
Sensitivity : 0.9910
Specificity : 0.9870
Pos Pred Value : 0.9893
Neg Pred Value : 0.9890
Prevalence : 0.5480
Detection Rate : 0.5431
Detection Prevalence : 0.5489
Balanced Accuracy : 0.9890
'Positive' Class : satisfied
At first the confusion matrix have been shown which tells how many number of class
were properly classified and how many of them were incorrectly classified. Then the
accuracy of the model was found to be 98.92% which is considered to be the best model. And
the accuracy of satisfied class was 98.89% which depicts that most of the classified class
were correctly classified by the logistic model.
The figure below shows the ROC curve of the logistic regression which measures the
performance of the classification model at different threshold settings.
Figure 8: ROC curve of Random Forest model
12Statistics in R
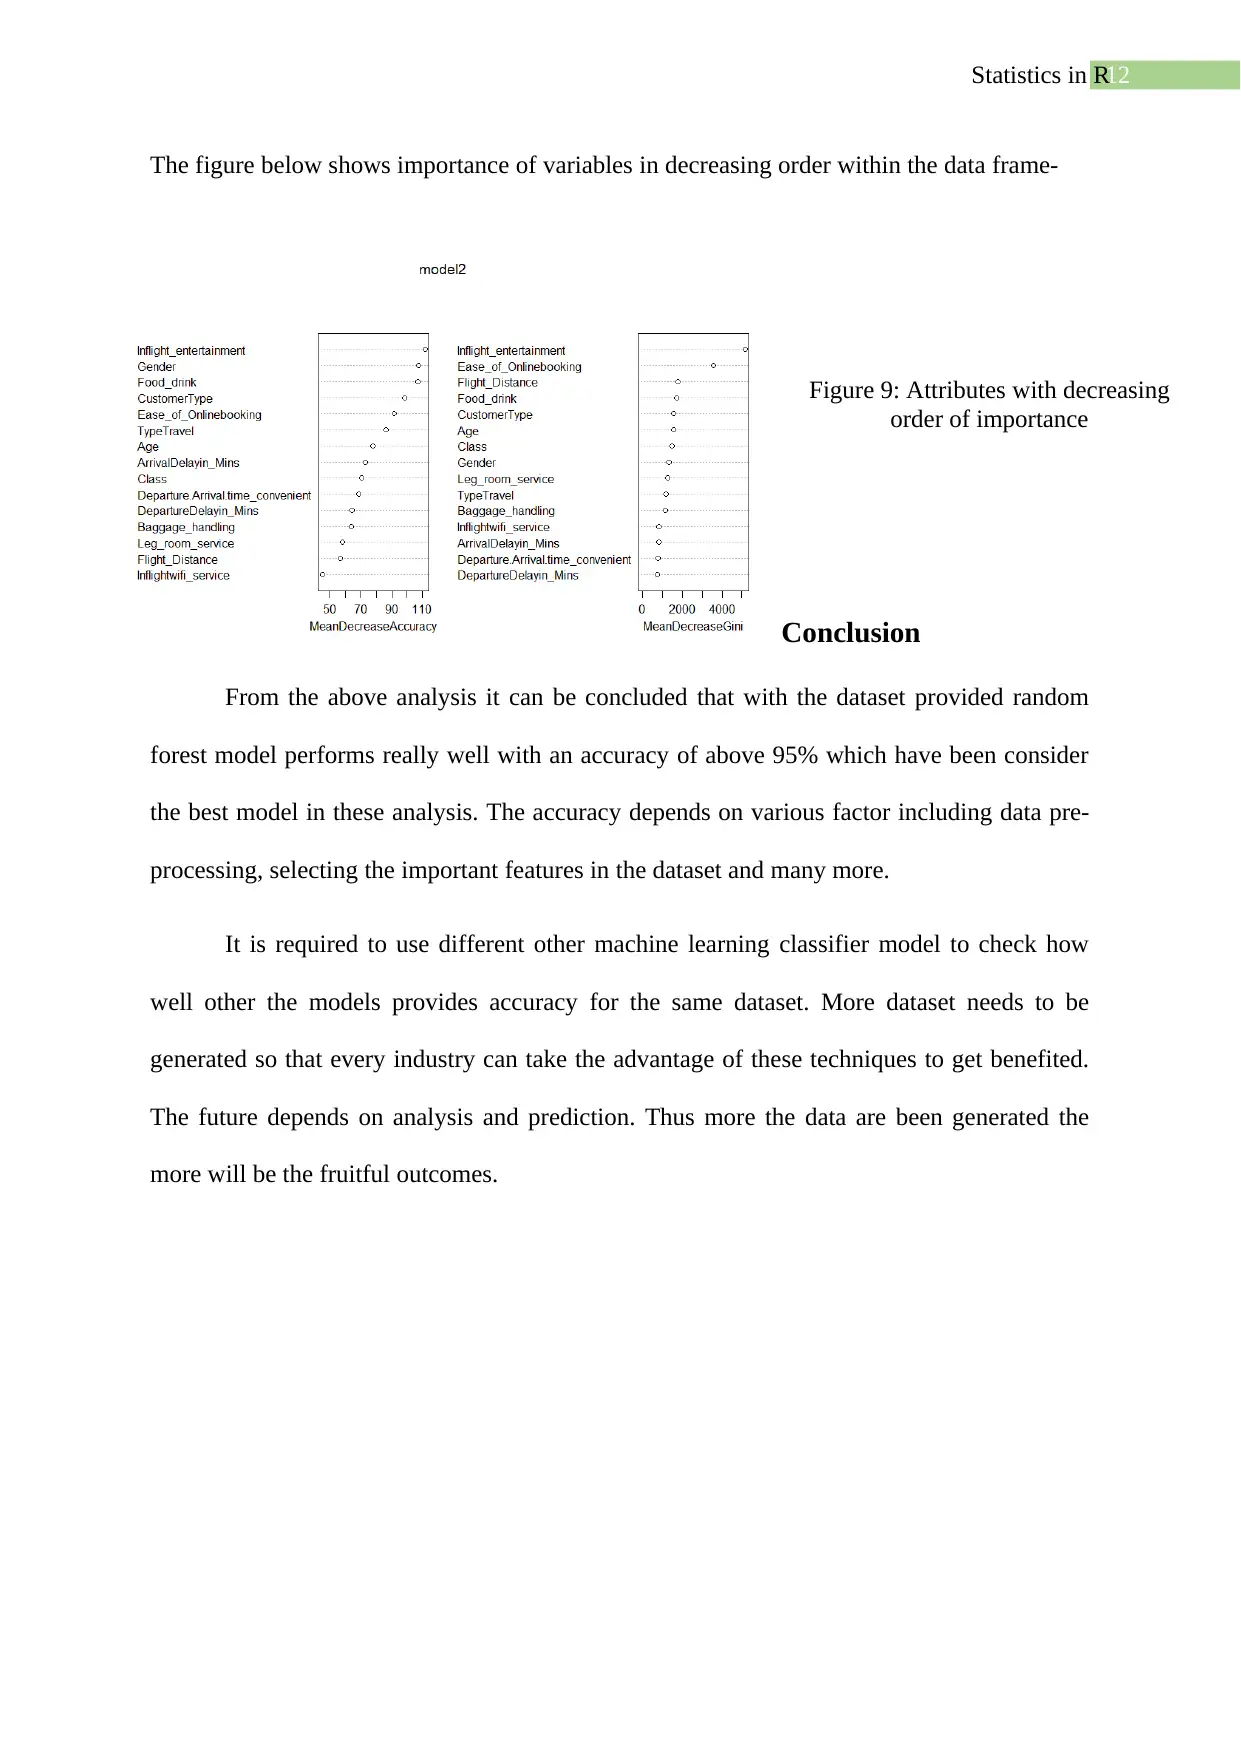
The figure below shows importance of variables in decreasing order within the data frame-
Conclusion
From the above analysis it can be concluded that with the dataset provided random
forest model performs really well with an accuracy of above 95% which have been consider
the best model in these analysis. The accuracy depends on various factor including data pre-
processing, selecting the important features in the dataset and many more.
It is required to use different other machine learning classifier model to check how
well other the models provides accuracy for the same dataset. More dataset needs to be
generated so that every industry can take the advantage of these techniques to get benefited.
The future depends on analysis and prediction. Thus more the data are been generated the
more will be the fruitful outcomes.
Figure 9: Attributes with decreasing
order of importance
⊘ This is a preview!⊘
Do you want full access?
Subscribe today to unlock all pages.
Trusted by 1+ million students worldwide
13Statistics in R
References
Biau, G., & Scornet, E. (2016). A random forest guided tour. Test, 25(2), 197-227.
Bischl, B., Lang, M., Kotthoff, L., Schiffner, J., Richter, J., Studerus, E., ... & Jones, Z. M.
(2016). mlr: Machine Learning in R. The Journal of Machine Learning Research,
17(1), 5938-5942.
Bottou, L., Curtis, F. E., & Nocedal, J. (2018). Optimization methods for large-scale machine
learning. Siam Review, 60(2), 223-311.
Catal, C., & Nangir, M. (2017). A sentiment classification model based on multiple
classifiers. Applied Soft Computing, 50, 135-141.
Farooq, M. S., Salam, M., Fayolle, A., Jaafar, N., & Ayupp, K. (2018). Impact of service
quality on customer satisfaction in Malaysia airlines: A PLS-SEM approach. Journal
of Air Transport Management, 67, 169-180.
Gasso, G. (2019). Logistic regression.
Hilbe, J. M. (2016). Practical guide to logistic regression. Chapman and Hall/CRC.
Kamamoto, Y., Moriya, T., & Harada, N. (2019). U.S. Patent Application No. 10/170,130.
Paraphrase This Document
Need a fresh take? Get an instant paraphrase of this document with our AI Paraphraser
14Statistics in R
Lever, J., Krzywinski, M., & Altman, N. (2016). Points of significance: Logistic regression.
Mohri, M., Rostamizadeh, A., & Talwalkar, A. (2018). Foundations of machine learning.
MIT press.
Rainey, C. (2016). Dealing with separation in logistic regression models. Political Analysis,
24(3), 339-355.
Tang, F., & Ishwaran, H. (2017). Random forest missing data algorithms. Statistical Analysis
and Data Mining: The ASA Data Science Journal, 10(6), 363-377.
1 out of 14
Related Documents


Your All-in-One AI-Powered Toolkit for Academic Success.
+13062052269
info@desklib.com
Available 24*7 on WhatsApp / Email
![[object Object]](/_next/static/media/star-bottom.7253800d.svg)
Unlock your academic potential
© 2024 | Zucol Services PVT LTD | All rights reserved.