Data Analysis and Planning for Deliveroo: Statistics Report
VerifiedAdded on 2023/06/18
|12
|1642
|71
Report
AI Summary
This report provides a statistical analysis of Deliveroo's data, evaluating data sources, descriptive analysis, and conclusions regarding the company's growth. Task 1 critically compares data sources, assesses descriptive analysis methods, and summarizes findings on Deliveroo's expansion. Task 2 applies statistical process control for purchasing and inventory planning, quality testing using Chi-square, and capacity planning, calculating mean and median customer orders per hour to aid in operational decision-making. This document is available on Desklib, a platform offering a wide range of study resources for students.

Statistics for Management: Formative Submission: Deliveroo
Student Name:
Student No:
10/29/2021
Student Name:
Student No:
10/29/2021
Paraphrase This Document
Need a fresh take? Get an instant paraphrase of this document with our AI Paraphraser
Table of Contents
INTRODUCTION...........................................................................................................................4
TASK- 1...........................................................................................................................................4
Critically evaluate and compare each data source.......................................................................4
Critically evaluate the descriptive analysis..................................................................................5
Summarise the conclusions..........................................................................................................6
TASK- 2...........................................................................................................................................9
1) Inventory Planning..................................................................................................................9
2) Purchasing planning................................................................................................................9
3) Quality test planning.............................................................................................................10
4) Capacity planning..................................................................................................................11
REFERENCES..............................................................................................................................13
2 | P a g e
INTRODUCTION
Statistics plays a very important role in analysing the data for managers. It quantifies the
complete data in an arranged format through which companies can interpret its position. There
are various methods which helps in the completion of this task. The company chosen in this
report is Deliveroo. It is a UK based Fast food delivery business operating in more than 200
locations. This report compares the relevancy of data extracted from various sources. It also
provides an analysis of the descriptive method of reviewing data. Further it evaluates the data
provided by applying various tools of statistics.
TASK- 1
Critically evaluate and compare each data source.
Data means the value, figure or qualitative aspects of different variables that helps in
extracting information and performance of the company and data sources refers to the places
where a particular collection of knowledge has been extracted. It is important that the
information derived from these sources is correct, otherwise the whole information can go
wrong.
The data on Deliveroo has been extracted from two sources. Below is the discussion
about the two sources authenticity.
Nature- it means that whether the data is quantitative or qualitative. The information
extracted from two modes is in numerical format. They all are provided in either millions
or count of locations.
Validity/Currency- It checks that whether the data is authentic or not. The knowledge
provided in both the forms exactly matches with each other. It means that the complete
information is authentic, as when two different sources provides same figures. Then it is
considered to be correct.
Strengths and weaknesses-
First source- the data provider here is authentic and can be trusted. It is its biggest strength. But
the companies do not provide their full information to external sources. So there can be a case of
alteration or hiding of information.
3 | P a g e
⊘ This is a preview!⊘
Do you want full access?
Subscribe today to unlock all pages.
Trusted by 1+ million students worldwide
Second Source- the second data is just an excel sheet. So there is no proper authenticity
of this mode. Because the data can be irrelevance or just copy pasted. It is its biggest
weakness.
Reliability – it checks out the trustworthiness of the data. The first source can be
considered to be reliable as this is from a well renown app. But there is no reliability of
the second in formation. This is not from an authentic publisher.
Though the two data's are exactly same so, both of them can be used for the analysis. But
if considering about the authenticity, the data of first source is reliable. But the other source
cannot be considered for evaluating the position of business.
Critically evaluate the descriptive analysis.
Descriptive analysis refers to the data that helps in understanding and interpreting the
data along with arranging it so that a meaningful information can be revealed from it. It helps in
summarising and constructing the content in such a way that a pattern can be made in that
information. These are types of evaluation:
Measures of frequency- in this method the prime source is the frequency distribution
which is represented in number or percentages . It predicts the possibility of occurrence
of any data.
Measures of Central tendency- here, three methods are used- mean, median, mode. It
works on the functions of averages, mid values and highest occurring frequency.
Measures of dispersion- it checks out the way in which the data is distributed in the
whole range of values. In this range and standard deviation can be used for evaluating the
distribution.
Measures of Position- It determines the position hold by every single value in the table
or its relation in comparison to other figures.
Advantages of descriptive analysis
High level of neutrality- in this type of evaluation, the researchers are required to be more
vigilant as it demands different types of feature of data that is driven.
More Vast- This method is much more wider than the other methods, and gives big
picture of the complete event. The variables can be single or multiple.
Flexible- It provides a flexible environment to the user as they can make use of both
quantitative as well as qualitative data for interpreting it.
4 | P a g e
Paraphrase This Document
Need a fresh take? Get an instant paraphrase of this document with our AI Paraphraser
Limitations
Wrong data extraction- if the person fetching data from different sources, does not posses
much knowledge, then the complete result can become wrong.
Expert knowledge- this tool is nor everyone's cup of tea. There is a need of person who is
expert in its work.
Confidentiality- it is the biggest hurdle of this tool. It is very difficult to get data because
no one wants to give their information to some other person as there are lots of security
issues.
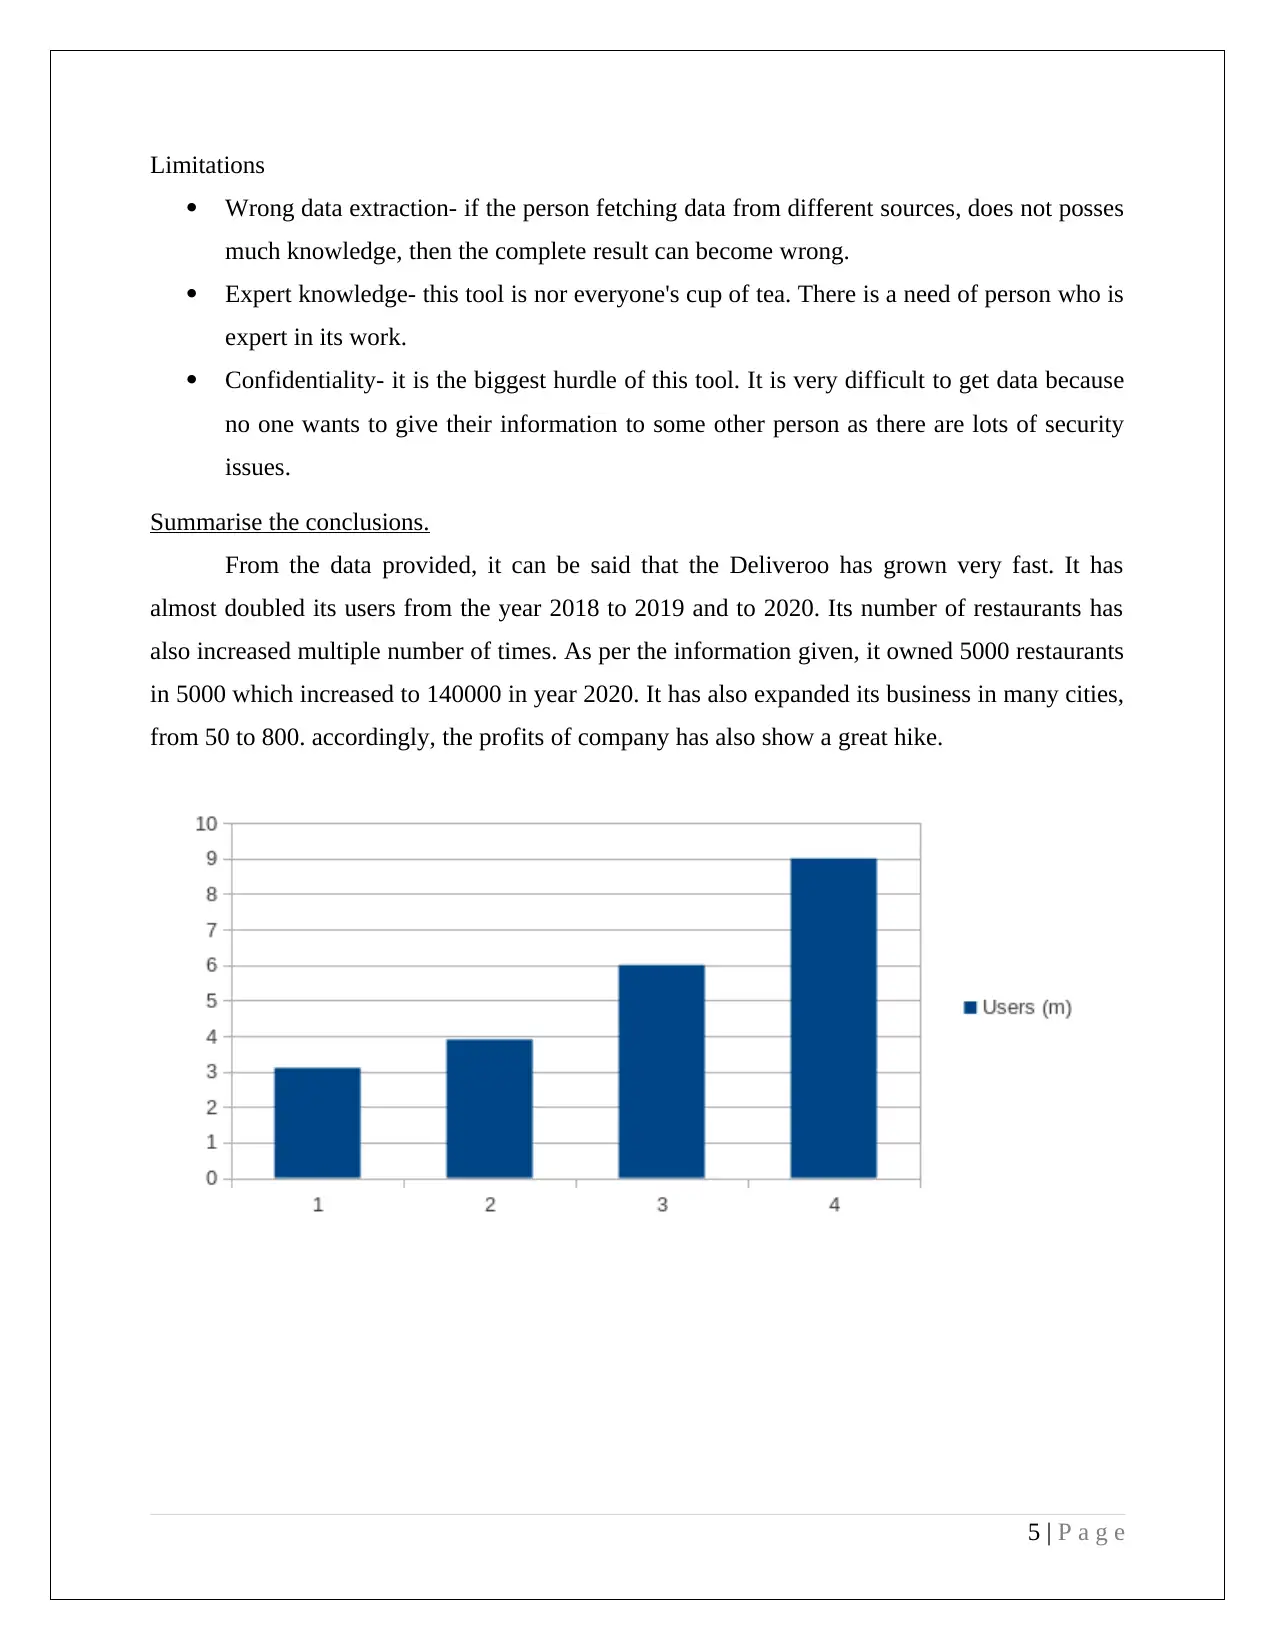
Summarise the conclusions.
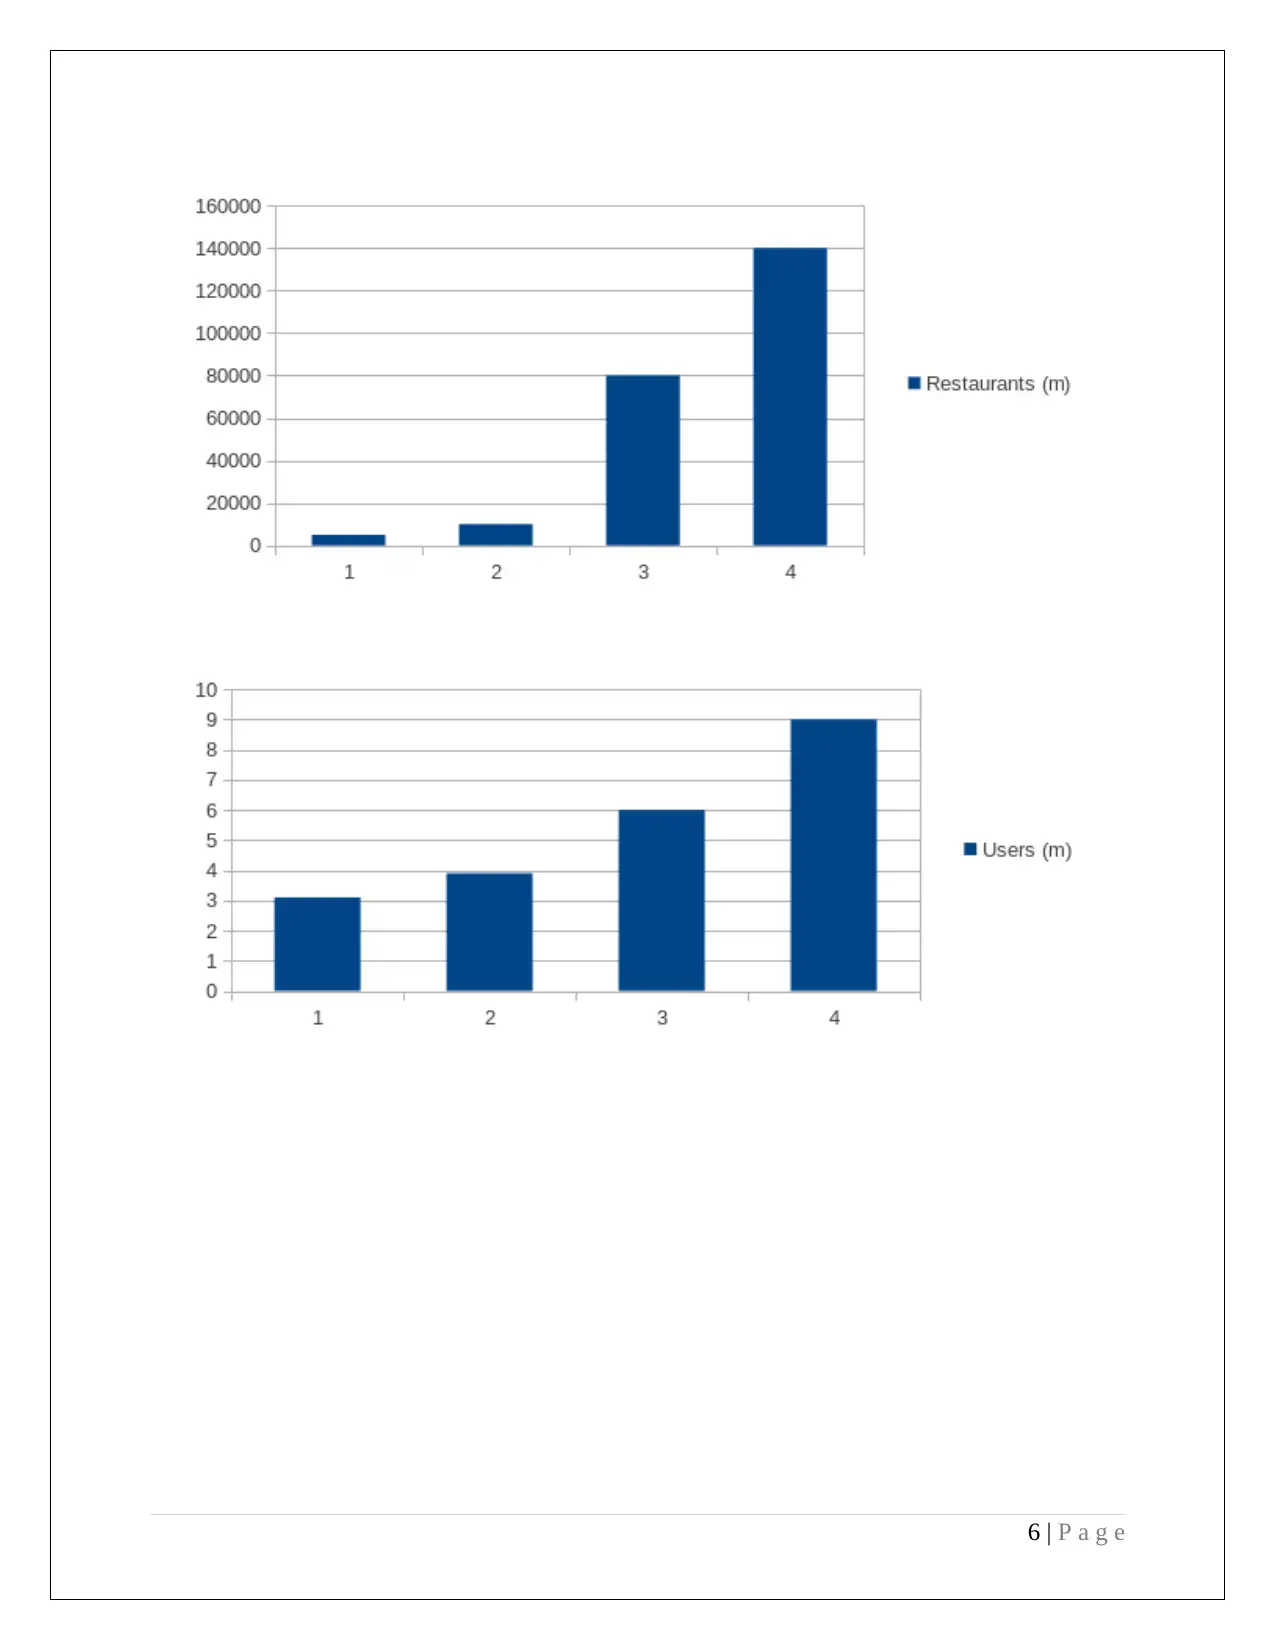
From the data provided, it can be said that the Deliveroo has grown very fast. It has
almost doubled its users from the year 2018 to 2019 and to 2020. Its number of restaurants has
also increased multiple number of times. As per the information given, it owned 5000 restaurants
in 5000 which increased to 140000 in year 2020. It has also expanded its business in many cities,
from 50 to 800. accordingly, the profits of company has also show a great hike.
5 | P a g e
Wrong data extraction- if the person fetching data from different sources, does not posses
much knowledge, then the complete result can become wrong.
Expert knowledge- this tool is nor everyone's cup of tea. There is a need of person who is
expert in its work.
Confidentiality- it is the biggest hurdle of this tool. It is very difficult to get data because
no one wants to give their information to some other person as there are lots of security
issues.
Summarise the conclusions.
From the data provided, it can be said that the Deliveroo has grown very fast. It has
almost doubled its users from the year 2018 to 2019 and to 2020. Its number of restaurants has
also increased multiple number of times. As per the information given, it owned 5000 restaurants
in 5000 which increased to 140000 in year 2020. It has also expanded its business in many cities,
from 50 to 800. accordingly, the profits of company has also show a great hike.
5 | P a g e
6 | P a g e
⊘ This is a preview!⊘
Do you want full access?
Subscribe today to unlock all pages.
Trusted by 1+ million students worldwide
1 2 3 4 5 6
0
200
400
600
800
1000
1200
1400
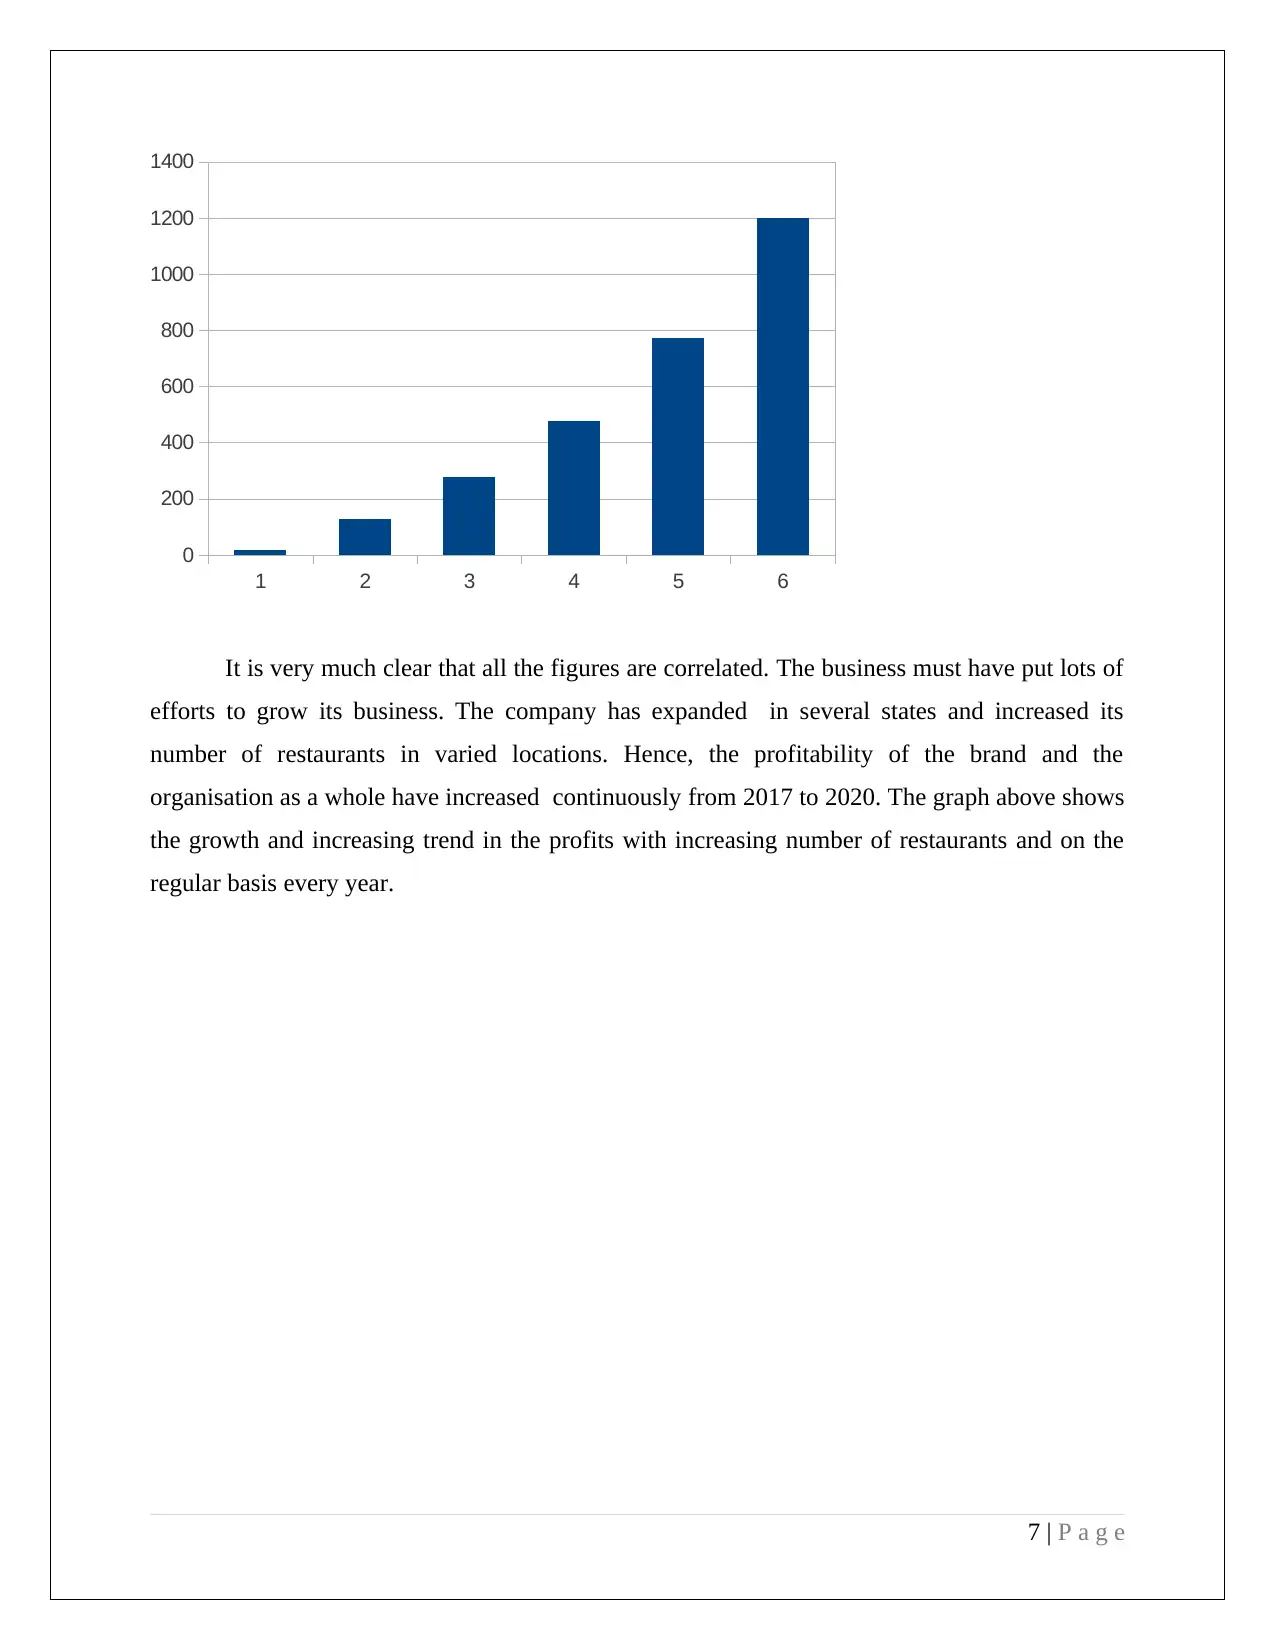
It is very much clear that all the figures are correlated. The business must have put lots of
efforts to grow its business. The company has expanded in several states and increased its
number of restaurants in varied locations. Hence, the profitability of the brand and the
organisation as a whole have increased continuously from 2017 to 2020. The graph above shows
the growth and increasing trend in the profits with increasing number of restaurants and on the
regular basis every year.
7 | P a g e
0
200
400
600
800
1000
1200
1400
It is very much clear that all the figures are correlated. The business must have put lots of
efforts to grow its business. The company has expanded in several states and increased its
number of restaurants in varied locations. Hence, the profitability of the brand and the
organisation as a whole have increased continuously from 2017 to 2020. The graph above shows
the growth and increasing trend in the profits with increasing number of restaurants and on the
regular basis every year.
7 | P a g e
Paraphrase This Document
Need a fresh take? Get an instant paraphrase of this document with our AI Paraphraser
TASK- 2
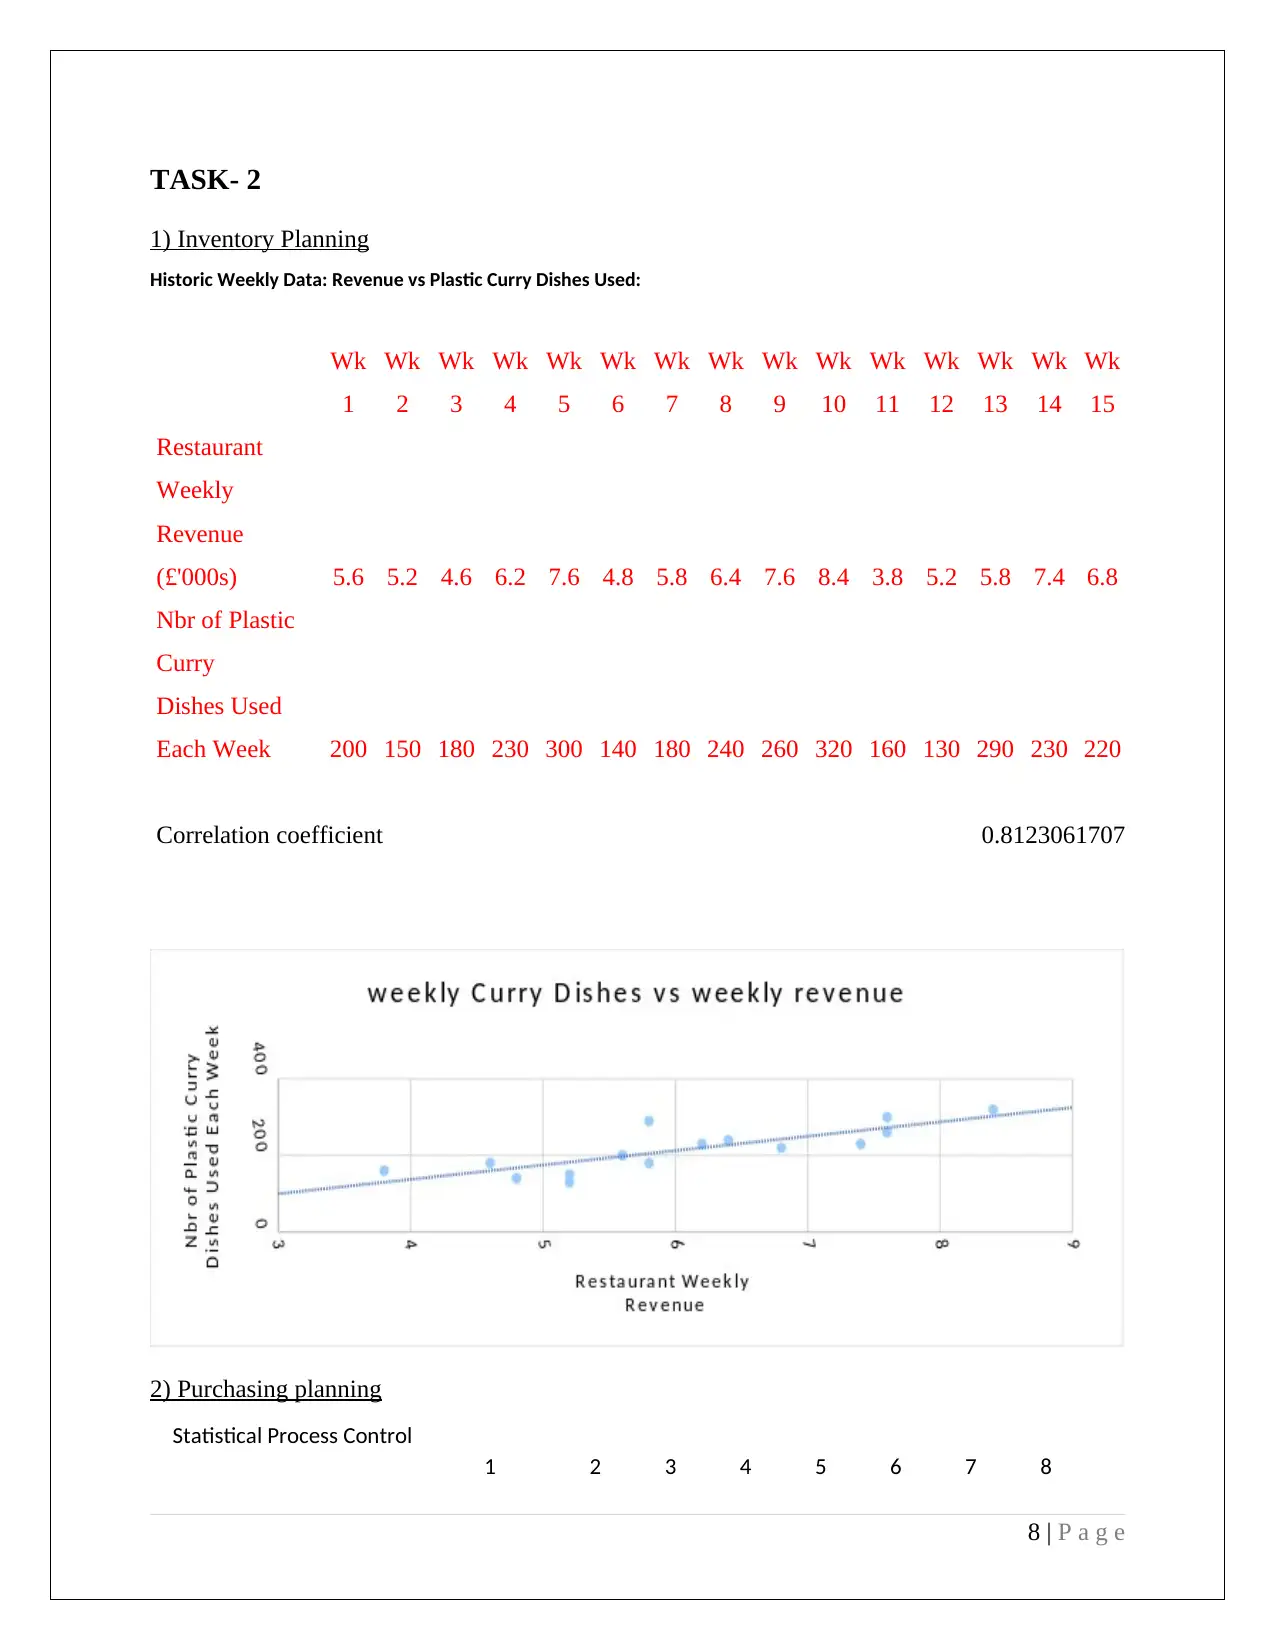
1) Inventory Planning
Historic Weekly Data: Revenue vs Plastic Curry Dishes Used:
Wk
1
Wk
2
Wk
3
Wk
4
Wk
5
Wk
6
Wk
7
Wk
8
Wk
9
Wk
10
Wk
11
Wk
12
Wk
13
Wk
14
Wk
15
Restaurant
Weekly
Revenue
(£'000s) 5.6 5.2 4.6 6.2 7.6 4.8 5.8 6.4 7.6 8.4 3.8 5.2 5.8 7.4 6.8
Nbr of Plastic
Curry
Dishes Used
Each Week 200 150 180 230 300 140 180 240 260 320 160 130 290 230 220
Correlation coefficient 0.8123061707
2) Purchasing planning
Statistical Process Control
1 2 3 4 5 6 7 8
8 | P a g e
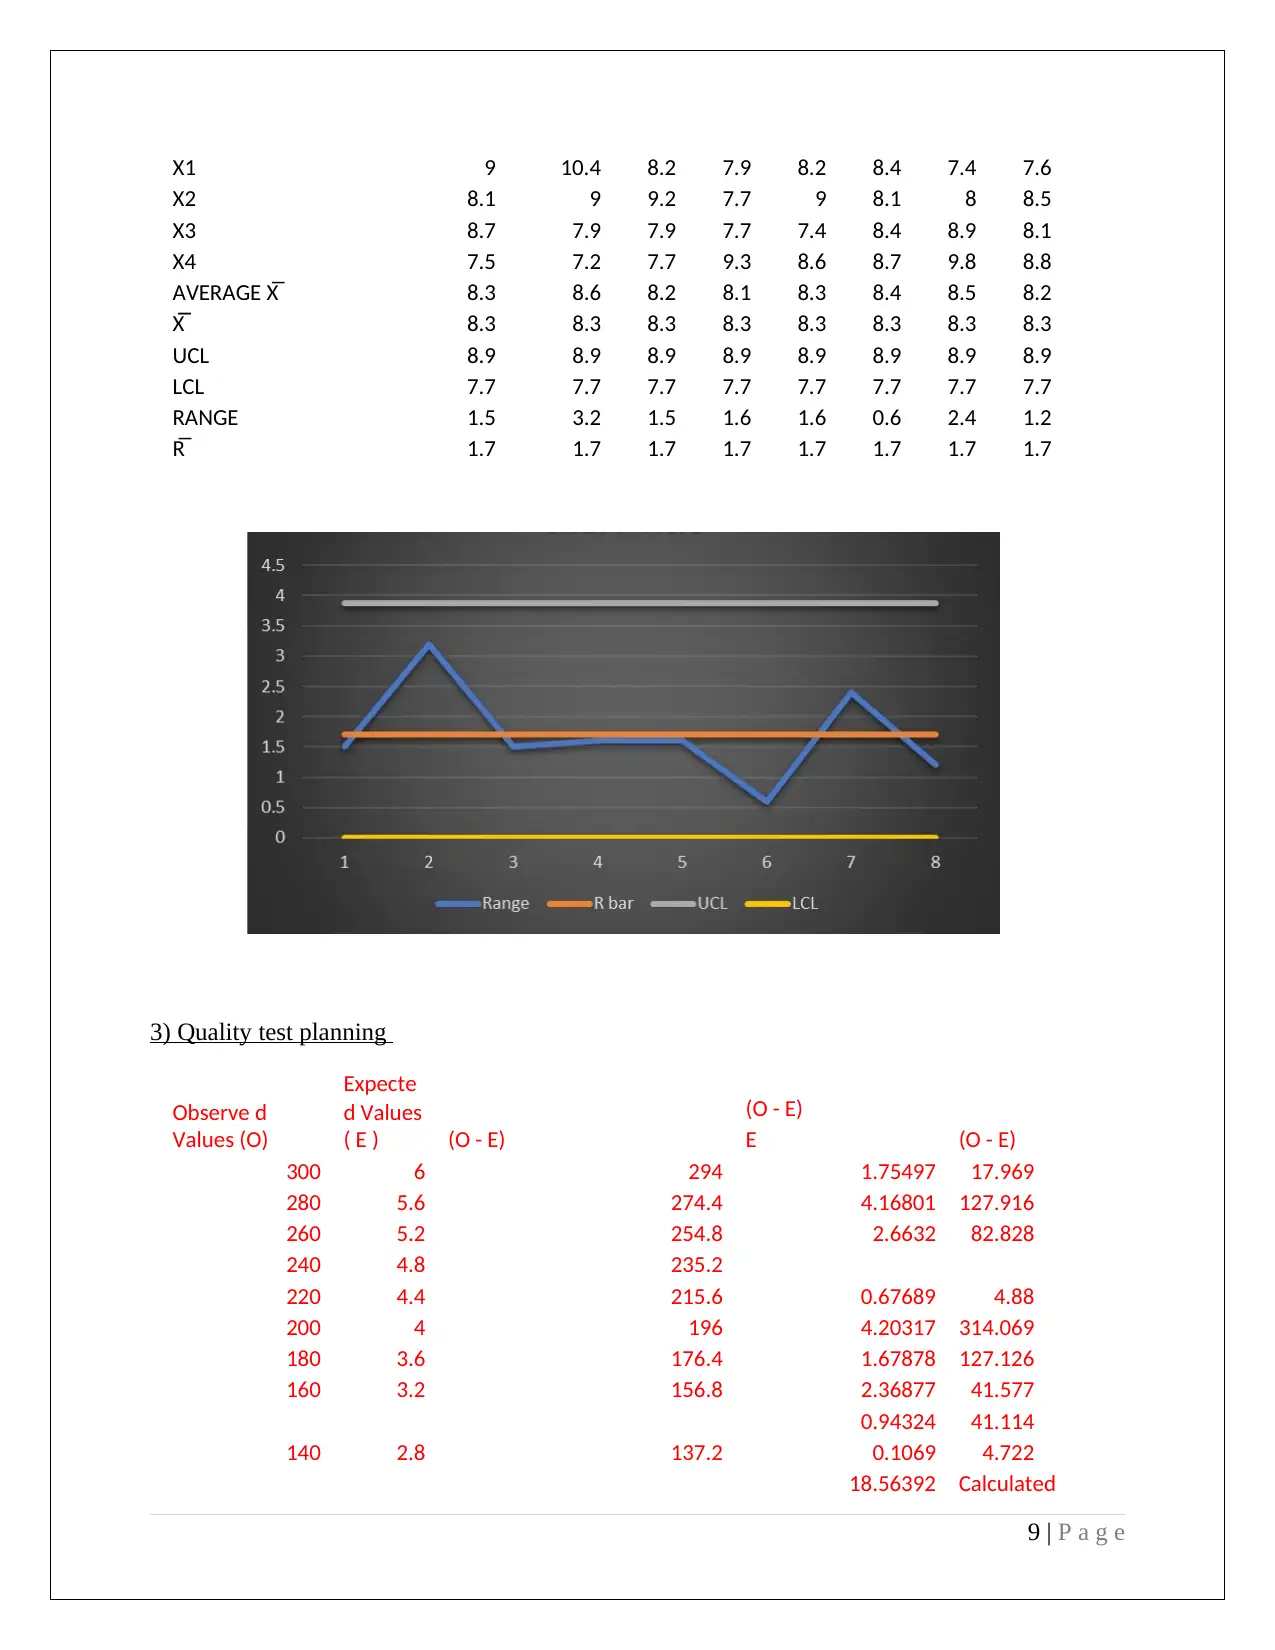
X1 9 10.4 8.2 7.9 8.2 8.4 7.4 7.6
X2 8.1 9 9.2 7.7 9 8.1 8 8.5
X3 8.7 7.9 7.9 7.7 7.4 8.4 8.9 8.1
X4 7.5 7.2 7.7 9.3 8.6 8.7 9.8 8.8
AVERAGE X̅ 8.3 8.6 8.2 8.1 8.3 8.4 8.5 8.2
X̅̅ 8.3 8.3 8.3 8.3 8.3 8.3 8.3 8.3
UCL 8.9 8.9 8.9 8.9 8.9 8.9 8.9 8.9
LCL 7.7 7.7 7.7 7.7 7.7 7.7 7.7 7.7
RANGE 1.5 3.2 1.5 1.6 1.6 0.6 2.4 1.2
R̅ 1.7 1.7 1.7 1.7 1.7 1.7 1.7 1.7
3) Quality test planning
Observe d
Values (O)
Expecte
d Values
( E ) (O - E)
(O - E)
E (O - E)
300 6 294 1.75497 17.969
280 5.6 274.4 4.16801 127.916
260 5.2 254.8 2.6632 82.828
240 4.8 235.2
0.67689220 4.4 215.6 4.88
200 4 196 4.20317 314.069
180 3.6 176.4 1.67878 127.126
160 3.2 156.8 2.36877 41.577
140 2.8 137.2
0.94324 41.114
0.1069 4.722
18.56392 Calculated
9 | P a g e
⊘ This is a preview!⊘
Do you want full access?
Subscribe today to unlock all pages.
Trusted by 1+ million students worldwide
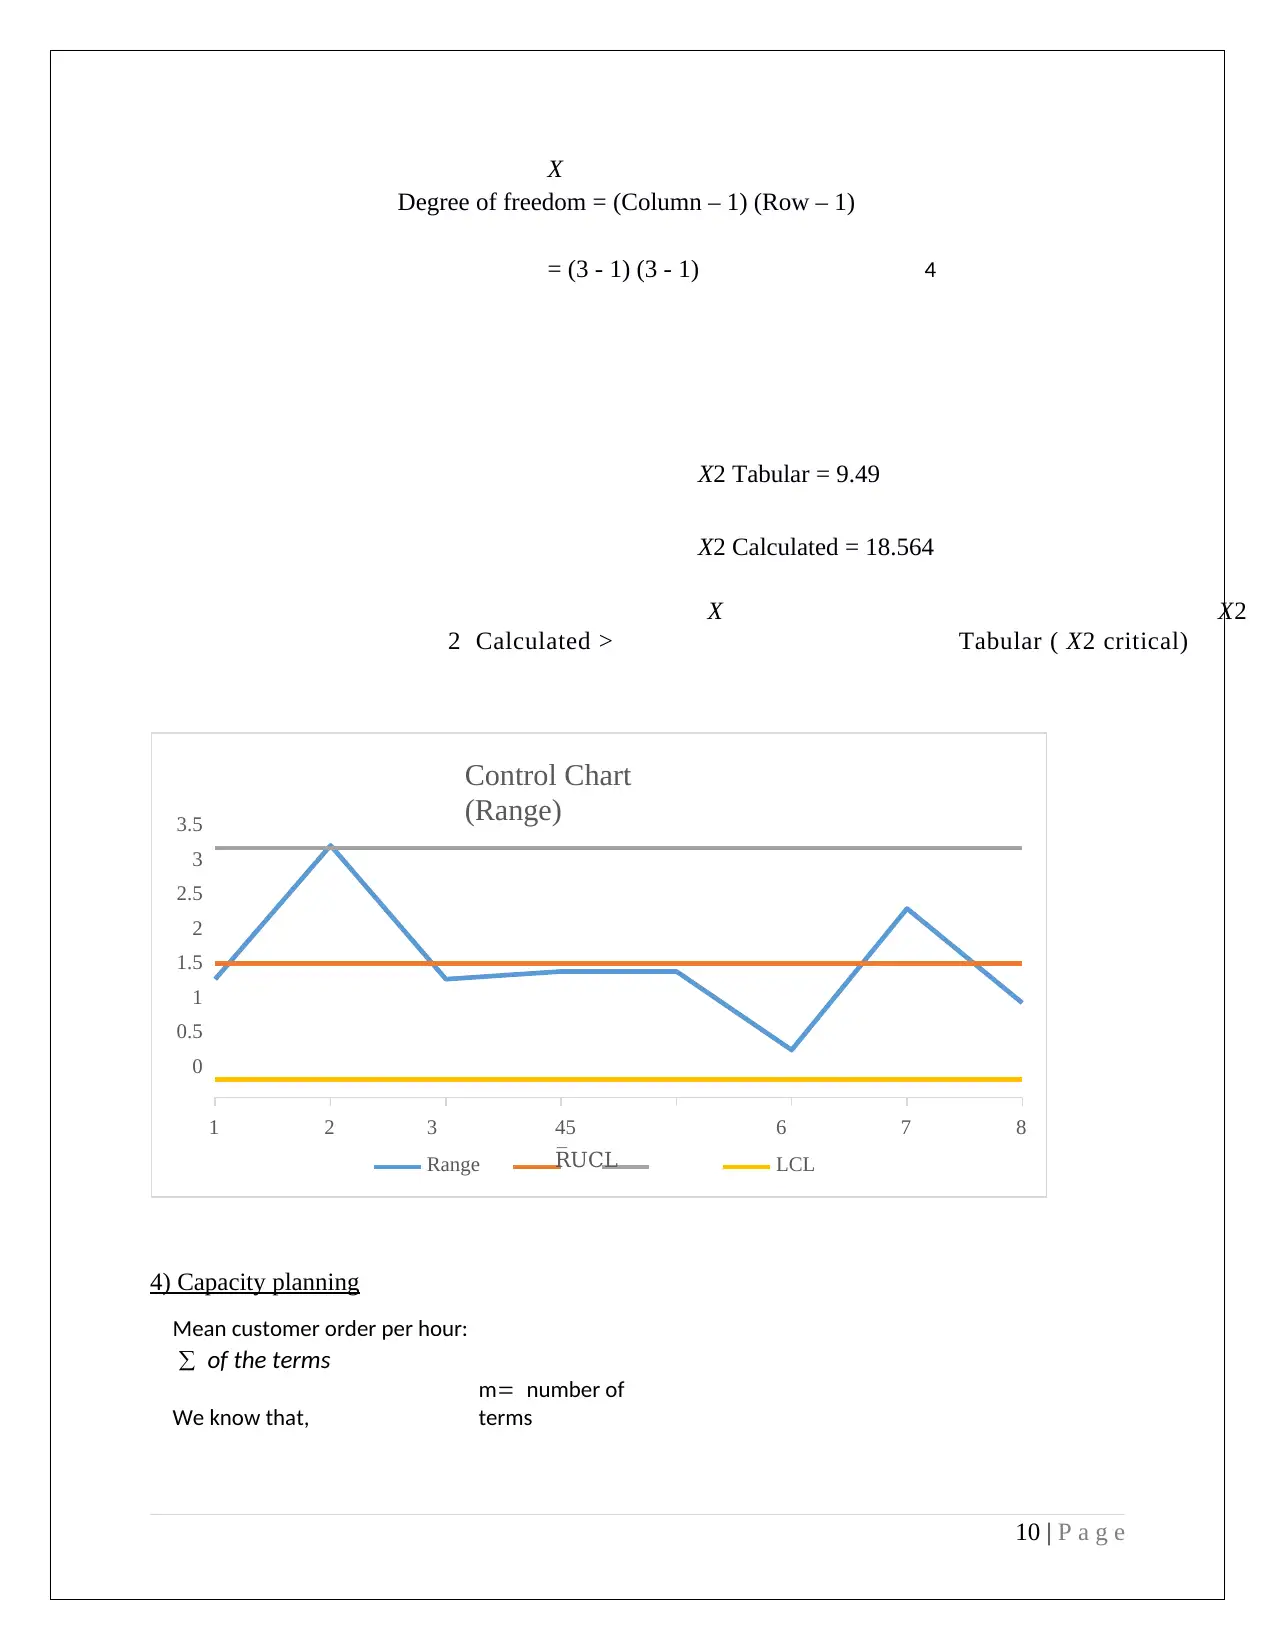
X
Degree of freedom = (Column – 1) (Row – 1)
= (3 - 1) (3 - 1) 4
X2 Tabular = 9.49
X2 Calculated = 18.564
X
2 Calculated >
X2
Tabular ( X2 critical)
4) Capacity planning
Mean customer order per hour:
∑ of the terms
We know that,
m= number of
terms
10 | P a g e
Control Chart
(Range)3.5
3
2.5
2
1.5
1
0.5
0
1 2 3
Range
45
R̅UCL
6
LCL
7 8
Paraphrase This Document
Need a fresh take? Get an instant paraphrase of this document with our AI Paraphraser
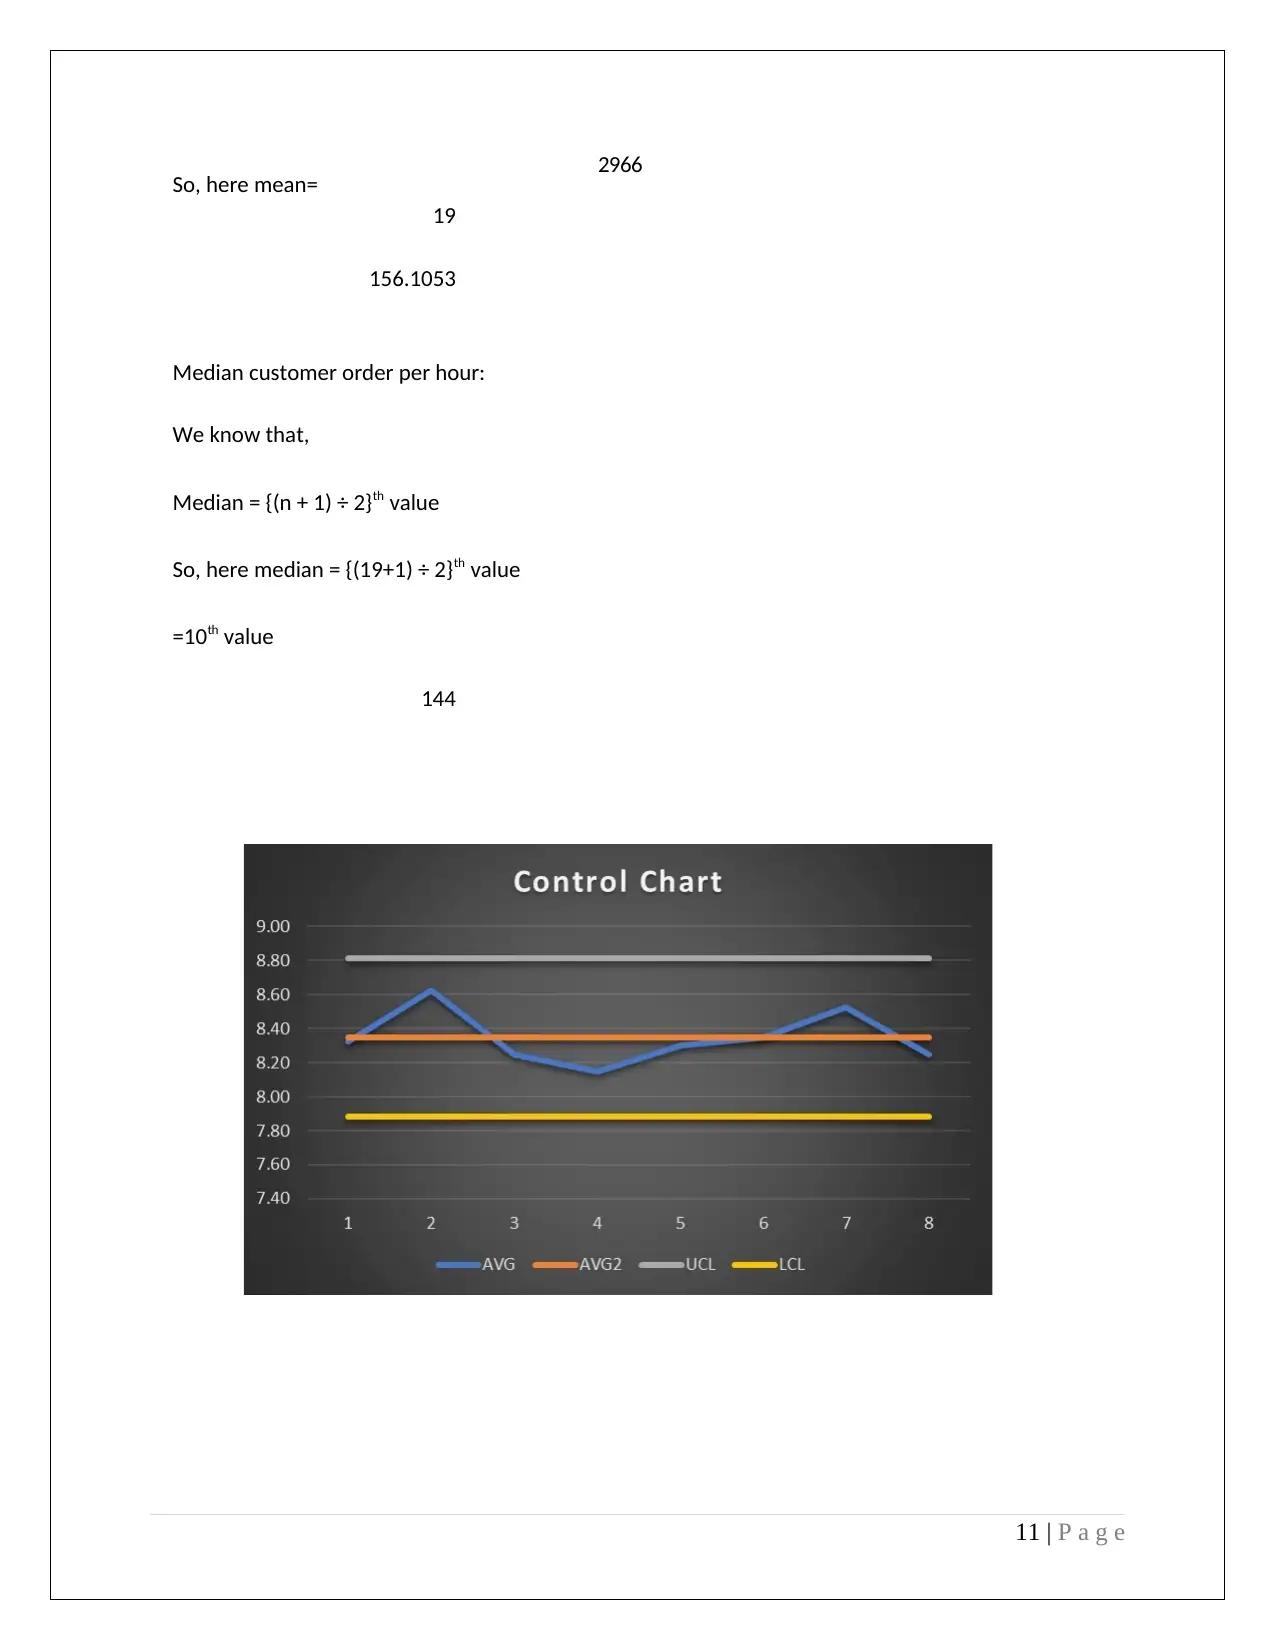
So, here mean= 2966
19
156.1053
Median customer order per hour:
We know that,
Median = {(n + 1) ÷ 2}th value
So, here median = {(19+1) ÷ 2}th value
=10th value
144
11 | P a g e
19
156.1053
Median customer order per hour:
We know that,
Median = {(n + 1) ÷ 2}th value
So, here median = {(19+1) ÷ 2}th value
=10th value
144
11 | P a g e
REFERENCES
Batabyal, A. and Nijkamp, P. (2011). Research tools in natural resource and environmental
economics. Hackensack, N.J.: World Scientific.
Ben-Horim, M. and Levy, H., 1984. Statistics, Decisions And Applications In
Business And Economics. New York: McGraw-Hill.
Hoel, P. and Jessen, R., 1982. Basic Statistics For Business And Economics.
New York: [John Wiley].
Landers, R. (2013). A step-by-step introduction to statistics for business and economics.
London: SAGE.
12 | P a g e
⊘ This is a preview!⊘
Do you want full access?
Subscribe today to unlock all pages.
Trusted by 1+ million students worldwide
1 out of 12