Statistics for Management: Evaluating Business Information Report
VerifiedAdded on 2020/10/22
|11
|3331
|462
Report
AI Summary
This report provides a comprehensive overview of statistical methods and their application in business management. It begins with an introduction to statistics and its importance in achieving business objectives, followed by a discussion on the evaluation of business and economic information from published sources. The report then delves into data evaluation using various statistical methods, including mean, median, mode, standard deviation, trend analysis, correlation, and quartile/percentile analysis. It evaluates the advantages and disadvantages of different analytical methods. The report concludes by applying these statistical techniques in planning for inventory, capacity, and quality management, providing organizational examples to support the analysis. Overall, the report emphasizes the significance of statistical data analysis in informed decision-making for business success.

Statistics for Management
Paraphrase This Document
Need a fresh take? Get an instant paraphrase of this document with our AI Paraphraser
TABLE OF CONTENTS
INTRODUCTION...........................................................................................................................3
MAIN BODY...................................................................................................................................3
LO 1.................................................................................................................................................3
P1. Evaluating nature & process of business and economic information from published
sources..........................................................................................................................................3
P2. Data evaluation from a variety of sources with the help of different methods of analysis.. .5
M1. Evaluating methods used to analyse business information .................................................8
P4. Applying a range of the statistical methods used in the planning for the inventory, capacity
and the quality..............................................................................................................................9
CONCLUSION..............................................................................................................................10
REFERENCES .............................................................................................................................11
INTRODUCTION
Statistics is considered as branch of mathematics which directly deal with organization,
data collection, interpretation and presentation. In the present scenario, to ensure effective
management business lays focus on high level to undertake different statistical techniques and
tools. The present report will give brief discussion about statistics, key features and benefits to
statistical data for purpose of attaining business objectives. It would give brief discussion about
sources and types of data along with information of business could access. It will evaluate
economic and business data information through published sources as in this appropriate
evaluation of process and nature of economic data and information with various ranges.
Moreover, it will apply numerous range of statistical methods implied in business planning for
capacity, quality and inventory management. Therefore, it will also give evaluation and
justification with application of statistical methods supported through different organizational
examples. Lastly, it will provide critical evaluation of differences in use of descriptive,
confirmatory and explanatory analysis of economic and business data.
MAIN BODY
LO 1
P1. Evaluating nature & process of business and economic information from published sources.
As per the Legner, C., and et.al., (2017) point of view, every company is required to have
sound and effective business strategies and business plans for smooth functioning of business
operations. Business information helps the management of the company in formulation of
different business policies, frameworks, concepts which assist the management in decision
making process. Information related to statistical and financial data helps in understanding the
current business position of the company in comparison with other competitors. Information
should have characteristics of timely, correctly, accuracy, relevancy, reliability and cost friendly.
With the availability of accurate and correct information, not only the management gets
benefited but it also helps stakeholders as well as the shareholders of the company.
On this Chang (2016), identifies as well as argued that the information related to business
and business management creates impact on the market position as well as the performance
level. Positive information brings changes in company market position in form of increase in
share market prices, creation of brand image or goodwill, high profit returns etc. But on the same
⊘ This is a preview!⊘
Do you want full access?
Subscribe today to unlock all pages.
Trusted by 1+ million students worldwide
time, if any rumours or negative information is prevailing in the market then it will create an
adverse effect on the business operations and performance functions of the company. This
negative news or information leads to fall in the market price of share, loss of customer, low
profitability and customer retention.
As per the evaluation of Cassidy (2016), the information related to business and
economics can come in form of data, articles, references, and internal records. This can be use by
business in developing business related planning, operations, concepts. Such information can be
collected by conducting general surveys, questionnaire, books, search-engines or from friends,
customers, business associates, suppliers and vendors. Business related information can be
gathered with the help of interview process, conducted with the employees or other business
professionals.
As per the assessment of Wiersema, and León (2016), information related to the
economics is considered as the branch of micro economic theory which helps in studying the
effect relationship between how information and information systems has been creating impact
on economy and economic decisions as a whole. The economic information helps company in
making changes in the business processes, procedures or operations as per the changes in the
economy as a whole. Business information gets influenced with the economic information. The
current economic conditions of the country affects the business operations, plans to a large
extent. The constant changes in the government policies and plans, new taxation policies,
reforms, monetary and fiscal policies or changes in the interest rate lays emphasis on the
functioning of business operations.
As per the monitoring of Ball and Pratt (2018), economic and business related
information if utilised properly contributes towards the attainment of business goals and
objectives effectively and efficiently. Whatever the type of information it is, it assists company
in taking decision related to improvement in quality of service and products, sales process,
marketing, cost control etc.
According to the views of Ballas (2018), for making sound decision collection of data
and its correct interpretation is very significant process. As Data collected is raw in nature and
contains figures which is required to be further analysed and evaluated. By making use of proper
and correct statistical data analysis techniques, the company can interpret available data for
making decision related to investment or any business project. Different types of statistical tools
Paraphrase This Document
Need a fresh take? Get an instant paraphrase of this document with our AI Paraphraser
are there which can help in management of inventory, quality as well as capacity. With the help
of proper utilisation of information, company can earn more profit and increase its customer
base. If company is having adequate information about the current market trends, customer
demands, product like by customer mostly, then company can also grab the market share. With
the help of adoption of new and better improved techniques, technologies company can improve
its operational efficiency of business, productivity as well as performance level. Company should
always focus on the quality of service or product it is offerings to the customer in the market as
customer are considered as the most important key for business success. So it is very important
for every business organization to satisfy their customers need.
P2. Data evaluation from a variety of sources with the help of different methods of analysis.
Statistical methods are the mathematical formulas, techniques and the models that are
utilized in the statistical analysis of the data. Application of the statistical methods evaluates the
information from the research data and facilitates several ways in order to assess the reliable,
accurate and robustness of the outputs of research (Alles and et.al., 2018). There are various
statistical methods that are used in analyzing the data, also called as the descriptive statistics
which interprets the data from the sample by using the indexes like mean, median, mode,
standard deviation, correlation, Quartile and percentile.
Mean- Statistical mean is the statistical tool that is used in deriving the central tendency of
data. It is identified by computing the sum of all data in the population and dividing it by the
total number of the points. The resulted number will be treated as the mean. It is not only used in
mathematics but also in the sociology, history and economics. It provides the essential
information relating to the data set and facilitates deep insight into nature and the experiment of
data.
Median- It is the simplest measure of the central tendency which depicts the mid-value of
the data. Median is calculated by arranging all the observations in an order from smallest value
to the largest value. If odd figure of observation is resulted then, median is said to be the mid-
value. However, If the observation is resulted as even number then the average of mid value is
considered as the median.
Mode- It is the tool used in statistical analysis which reflects the number that is frequently
occurring in the data-set. This number is founded by the organizing and collecting the data in
relation to frequency count for each of the result. The number which has the highest count of the
frequency is said to be the mode of that data. It is also known as the modal value.
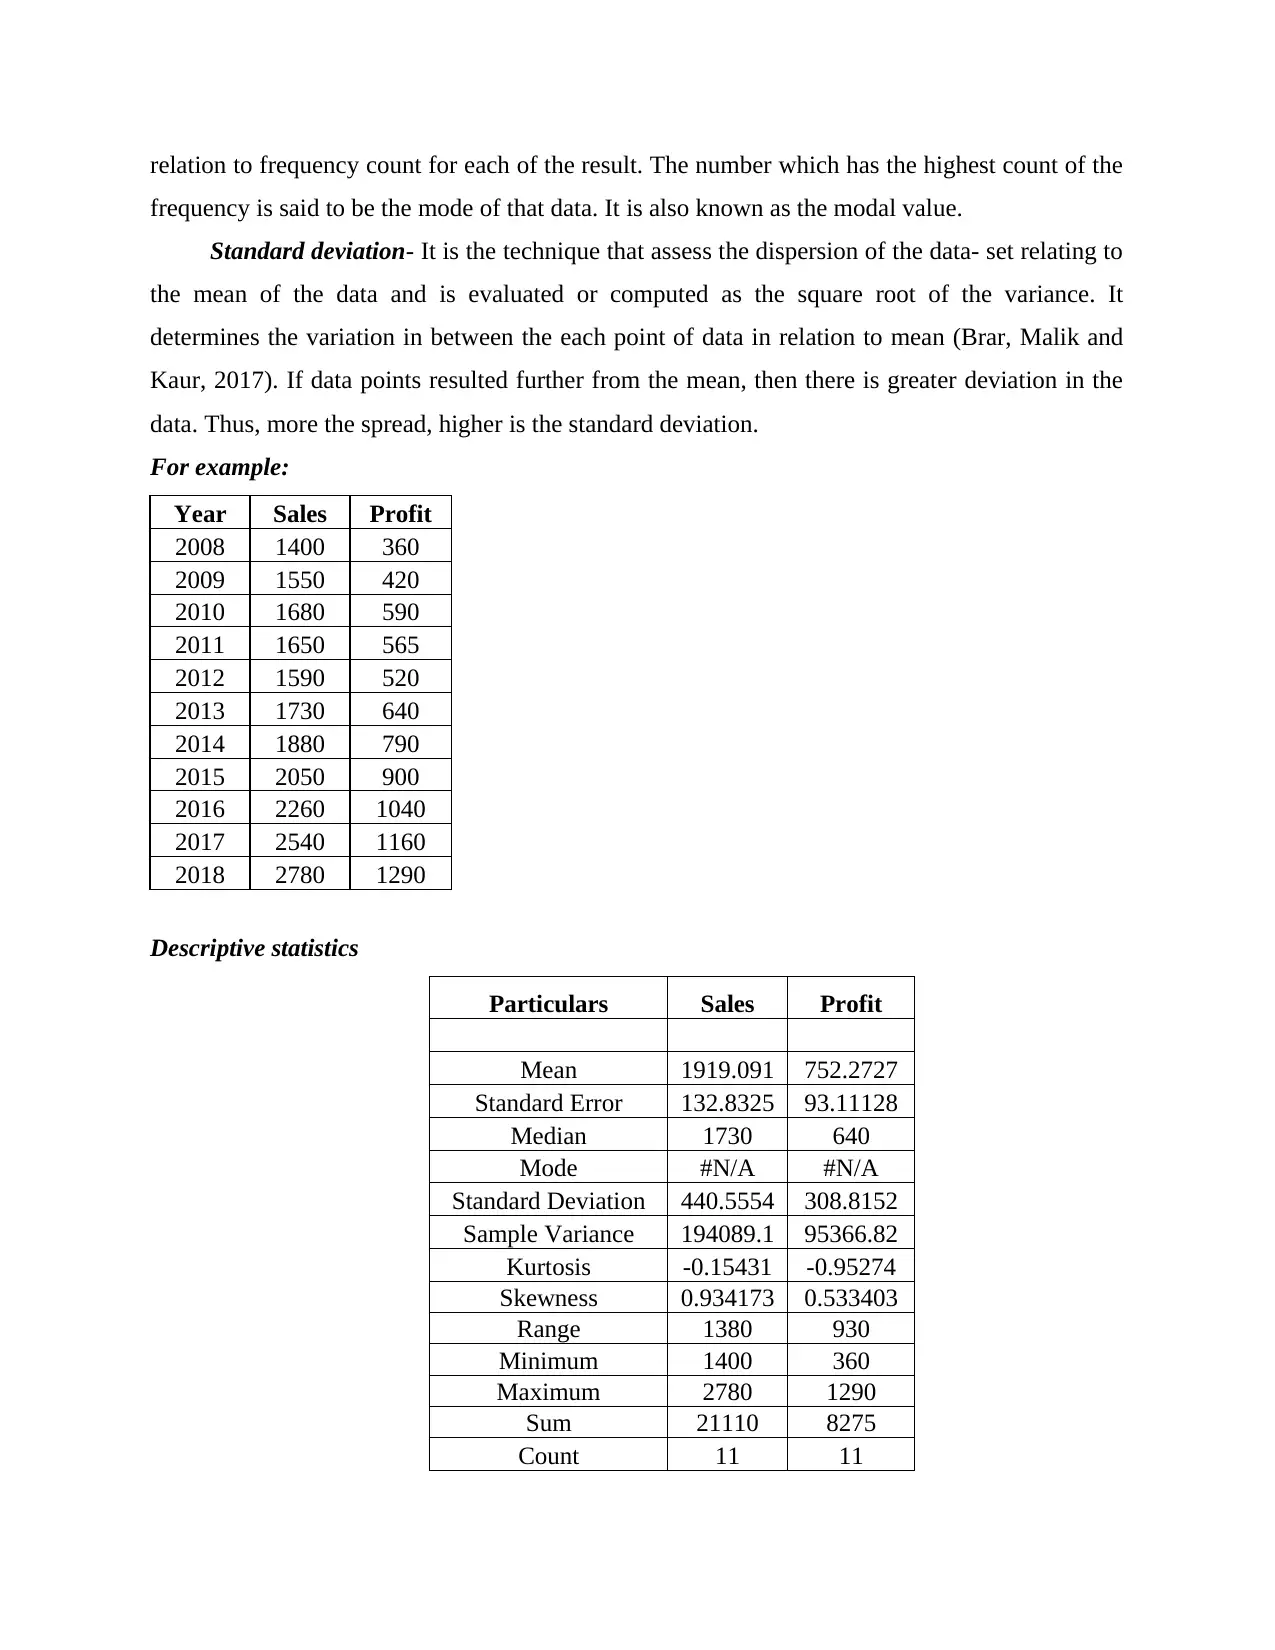
Standard deviation- It is the technique that assess the dispersion of the data- set relating to
the mean of the data and is evaluated or computed as the square root of the variance. It
determines the variation in between the each point of data in relation to mean (Brar, Malik and
Kaur, 2017). If data points resulted further from the mean, then there is greater deviation in the
data. Thus, more the spread, higher is the standard deviation.
For example:
Year Sales Profit
2008 1400 360
2009 1550 420
2010 1680 590
2011 1650 565
2012 1590 520
2013 1730 640
2014 1880 790
2015 2050 900
2016 2260 1040
2017 2540 1160
2018 2780 1290
Descriptive statistics
Particulars Sales Profit
Mean 1919.091 752.2727
Standard Error 132.8325 93.11128
Median 1730 640
Mode #N/A #N/A
Standard Deviation 440.5554 308.8152
Sample Variance 194089.1 95366.82
Kurtosis -0.15431 -0.95274
Skewness 0.934173 0.533403
Range 1380 930
Minimum 1400 360
Maximum 2780 1290
Sum 21110 8275
Count 11 11
frequency is said to be the mode of that data. It is also known as the modal value.
Standard deviation- It is the technique that assess the dispersion of the data- set relating to
the mean of the data and is evaluated or computed as the square root of the variance. It
determines the variation in between the each point of data in relation to mean (Brar, Malik and
Kaur, 2017). If data points resulted further from the mean, then there is greater deviation in the
data. Thus, more the spread, higher is the standard deviation.
For example:
Year Sales Profit
2008 1400 360
2009 1550 420
2010 1680 590
2011 1650 565
2012 1590 520
2013 1730 640
2014 1880 790
2015 2050 900
2016 2260 1040
2017 2540 1160
2018 2780 1290
Descriptive statistics
Particulars Sales Profit
Mean 1919.091 752.2727
Standard Error 132.8325 93.11128
Median 1730 640
Mode #N/A #N/A
Standard Deviation 440.5554 308.8152
Sample Variance 194089.1 95366.82
Kurtosis -0.15431 -0.95274
Skewness 0.934173 0.533403
Range 1380 930
Minimum 1400 360
Maximum 2780 1290
Sum 21110 8275
Count 11 11
⊘ This is a preview!⊘
Do you want full access?
Subscribe today to unlock all pages.
Trusted by 1+ million students worldwide
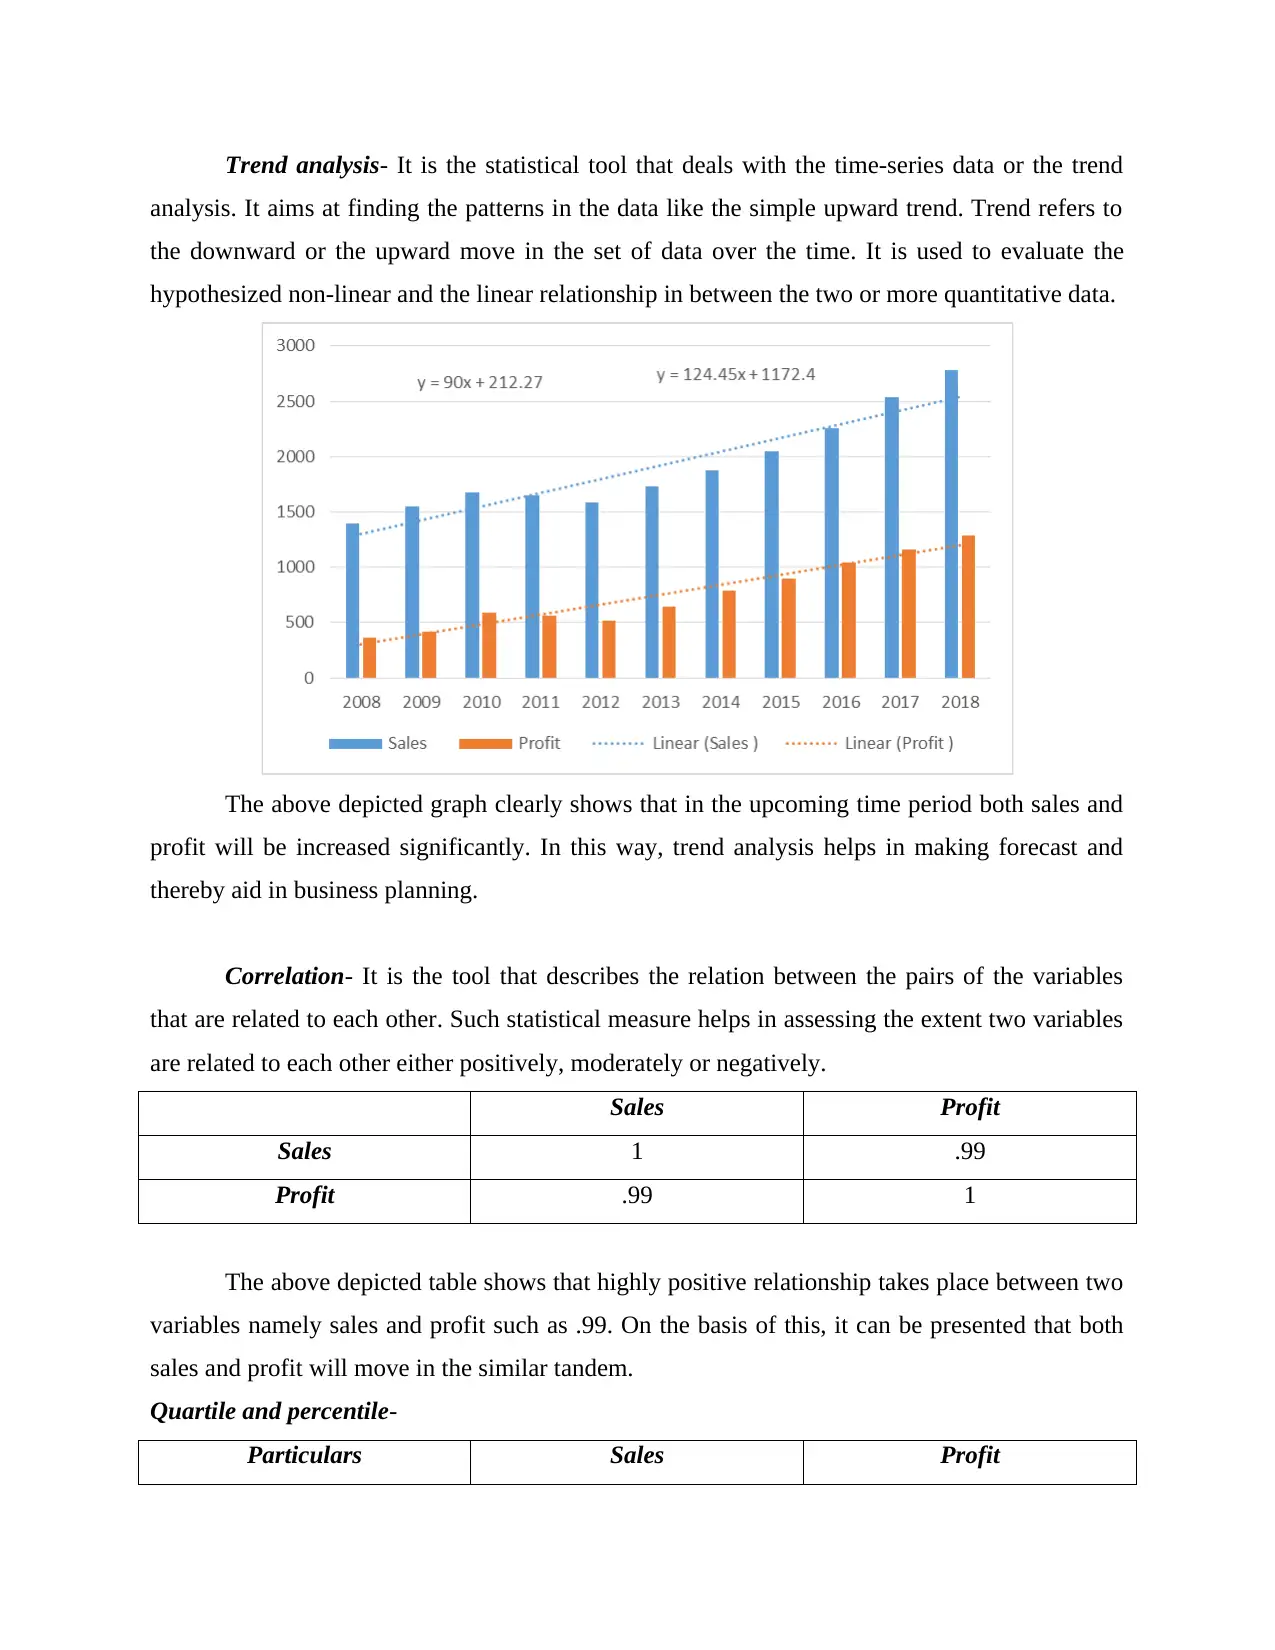
Trend analysis- It is the statistical tool that deals with the time-series data or the trend
analysis. It aims at finding the patterns in the data like the simple upward trend. Trend refers to
the downward or the upward move in the set of data over the time. It is used to evaluate the
hypothesized non-linear and the linear relationship in between the two or more quantitative data.
The above depicted graph clearly shows that in the upcoming time period both sales and
profit will be increased significantly. In this way, trend analysis helps in making forecast and
thereby aid in business planning.
Correlation- It is the tool that describes the relation between the pairs of the variables
that are related to each other. Such statistical measure helps in assessing the extent two variables
are related to each other either positively, moderately or negatively.
Sales Profit
Sales 1 .99
Profit .99 1
The above depicted table shows that highly positive relationship takes place between two
variables namely sales and profit such as .99. On the basis of this, it can be presented that both
sales and profit will move in the similar tandem.
Quartile and percentile-
Particulars Sales Profit
Paraphrase This Document
Need a fresh take? Get an instant paraphrase of this document with our AI Paraphraser
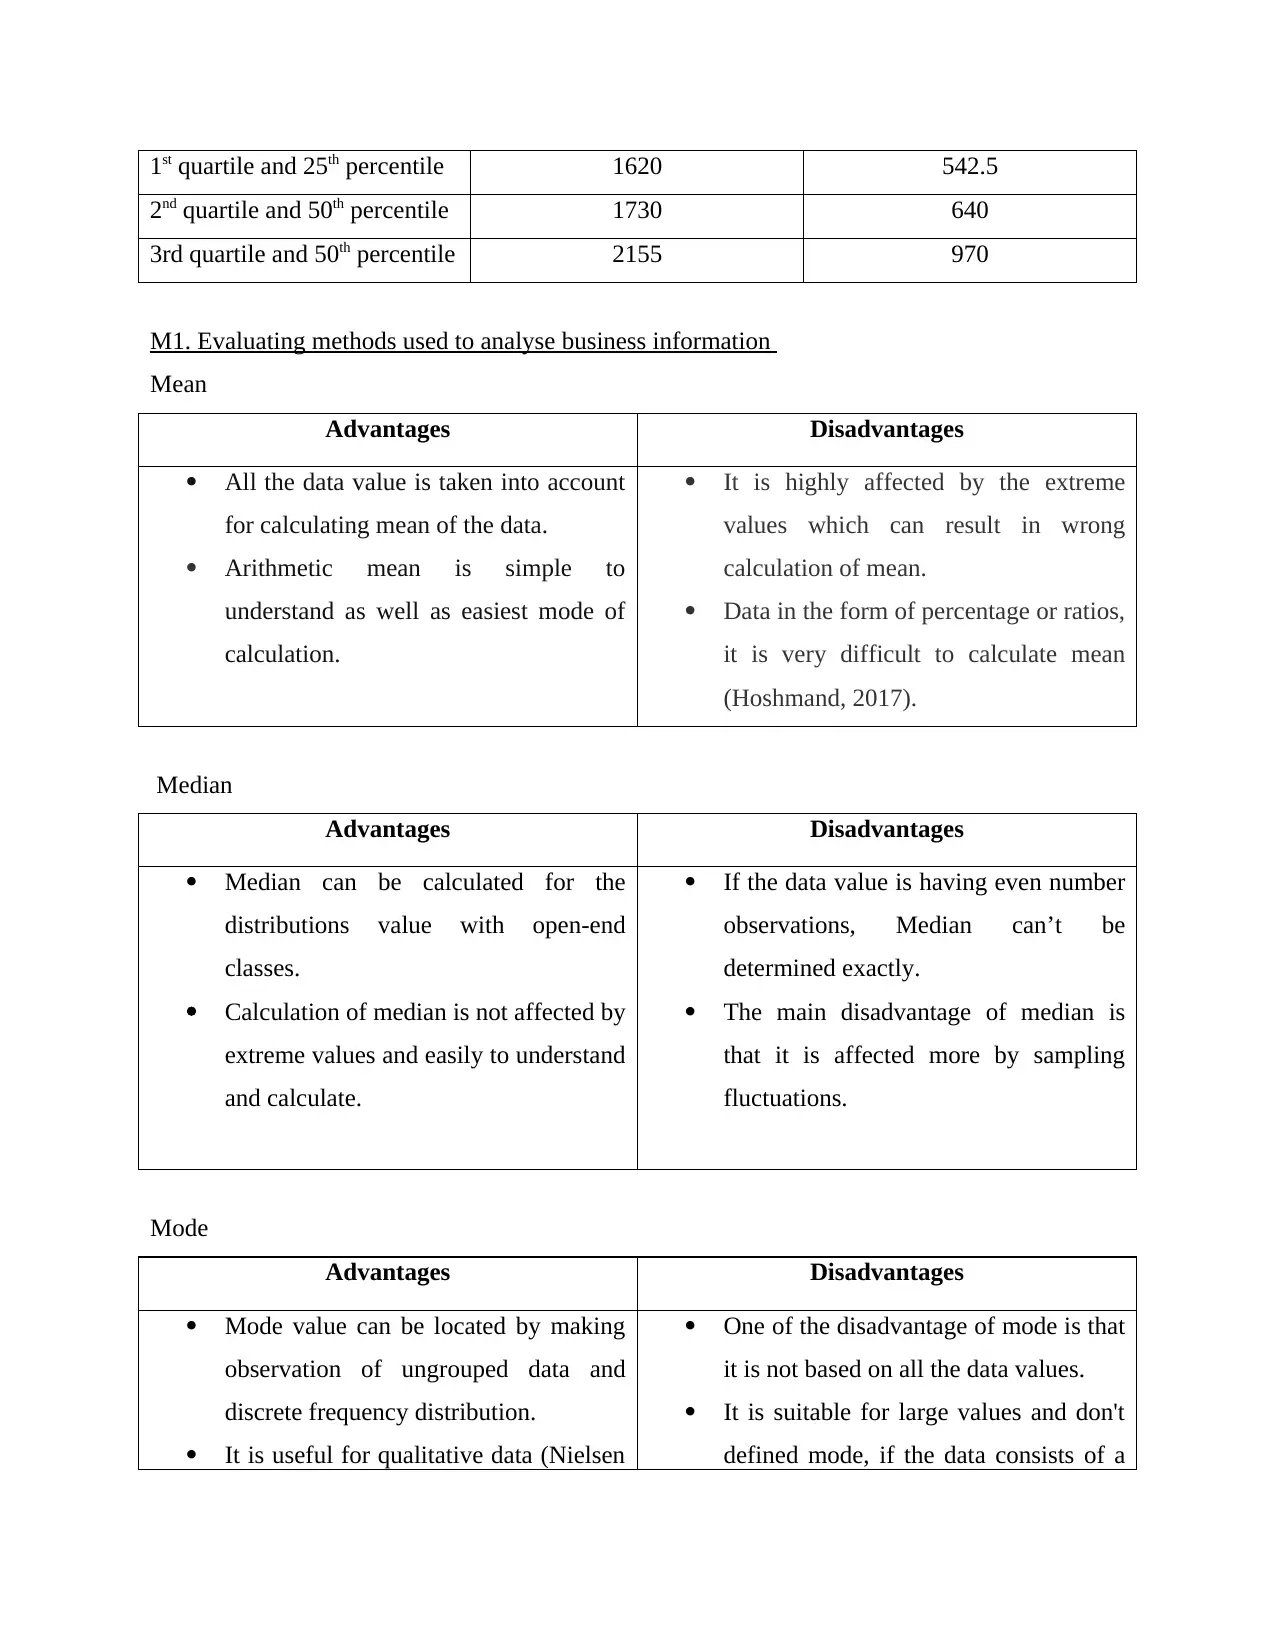
1st quartile and 25th percentile 1620 542.5
2nd quartile and 50th percentile 1730 640
3rd quartile and 50th percentile 2155 970
M1. Evaluating methods used to analyse business information
Mean
Advantages Disadvantages
All the data value is taken into account
for calculating mean of the data.
Arithmetic mean is simple to
understand as well as easiest mode of
calculation.
It is highly affected by the extreme
values which can result in wrong
calculation of mean.
Data in the form of percentage or ratios,
it is very difficult to calculate mean
(Hoshmand, 2017).
Median
Advantages Disadvantages
Median can be calculated for the
distributions value with open-end
classes.
Calculation of median is not affected by
extreme values and easily to understand
and calculate.
If the data value is having even number
observations, Median can’t be
determined exactly.
The main disadvantage of median is
that it is affected more by sampling
fluctuations.
Mode
Advantages Disadvantages
Mode value can be located by making
observation of ungrouped data and
discrete frequency distribution.
It is useful for qualitative data (Nielsen
One of the disadvantage of mode is that
it is not based on all the data values.
It is suitable for large values and don't
defined mode, if the data consists of a
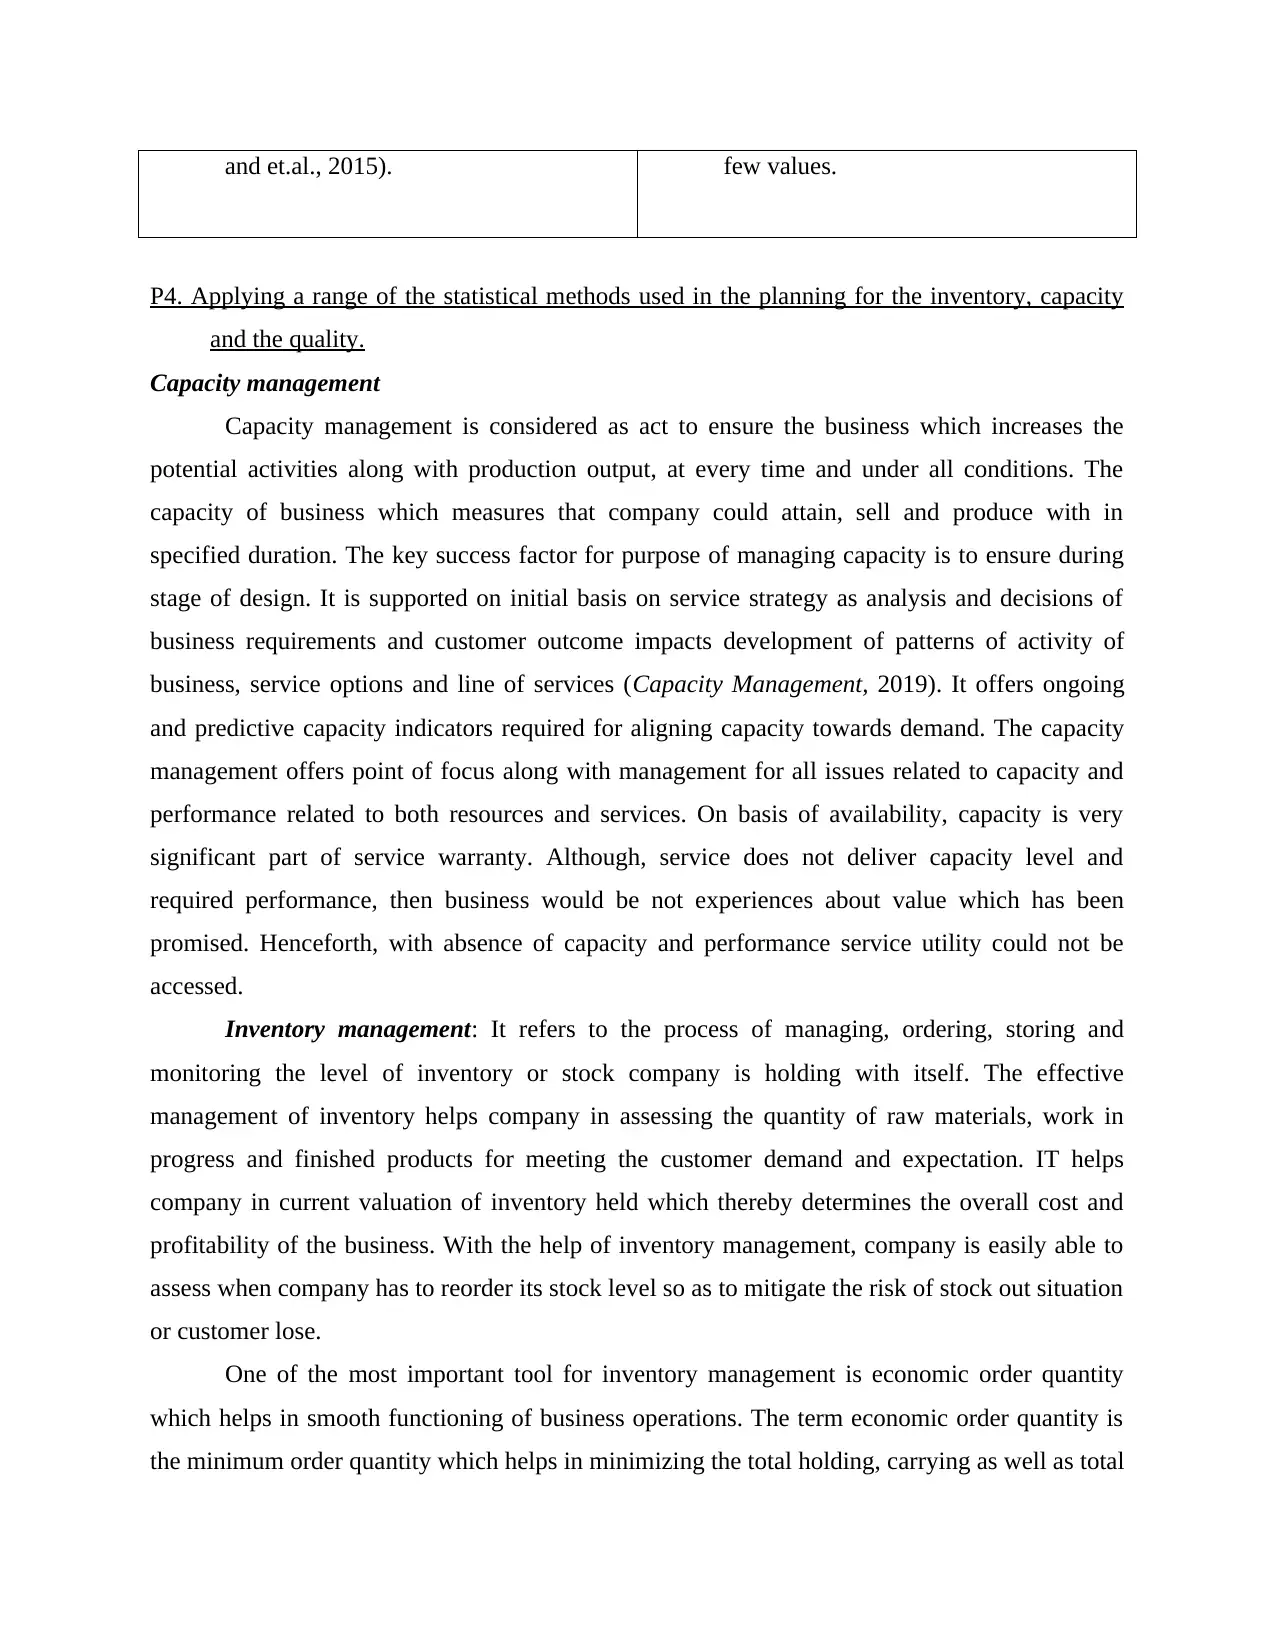
and et.al., 2015). few values.
P4. Applying a range of the statistical methods used in the planning for the inventory, capacity
and the quality.
Capacity management
Capacity management is considered as act to ensure the business which increases the
potential activities along with production output, at every time and under all conditions. The
capacity of business which measures that company could attain, sell and produce with in
specified duration. The key success factor for purpose of managing capacity is to ensure during
stage of design. It is supported on initial basis on service strategy as analysis and decisions of
business requirements and customer outcome impacts development of patterns of activity of
business, service options and line of services (Capacity Management, 2019). It offers ongoing
and predictive capacity indicators required for aligning capacity towards demand. The capacity
management offers point of focus along with management for all issues related to capacity and
performance related to both resources and services. On basis of availability, capacity is very
significant part of service warranty. Although, service does not deliver capacity level and
required performance, then business would be not experiences about value which has been
promised. Henceforth, with absence of capacity and performance service utility could not be
accessed.
Inventory management: It refers to the process of managing, ordering, storing and
monitoring the level of inventory or stock company is holding with itself. The effective
management of inventory helps company in assessing the quantity of raw materials, work in
progress and finished products for meeting the customer demand and expectation. IT helps
company in current valuation of inventory held which thereby determines the overall cost and
profitability of the business. With the help of inventory management, company is easily able to
assess when company has to reorder its stock level so as to mitigate the risk of stock out situation
or customer lose.
One of the most important tool for inventory management is economic order quantity
which helps in smooth functioning of business operations. The term economic order quantity is
the minimum order quantity which helps in minimizing the total holding, carrying as well as total
⊘ This is a preview!⊘
Do you want full access?
Subscribe today to unlock all pages.
Trusted by 1+ million students worldwide
ordering costs for a particular period. It ensures that right amount of inventory is ordered per
batch as a result of which company doesn't have to reorder too frequently. It also focuses on the
fact that company is neither have an excess amount of inventory holding nor face the situation of
stock shortage or stock out situation which brings in business loss.
Economic order quantity = SQRT(2 × Quantity × Cost Per Order/Carrying Cost Per Order)
Quality Management: The term Quality management is defined as a business practice
which includes all the business tools, techniques, solutions and processes helps in ensuring that
all the outputs & benefits delivered to stakeholders of the company are meeting their
requirements and as per their purpose. Quality Management tools makes data easy to understand
and interpret which thus enable employees in identifying the processes required for making
rectification in error, defects and find solutions to these specific problems.
The Most useful quality management tools includes Control Chart.
Control Chart – The control chart is considered as a graph which helps in studying &
showing trends of how a process is performing and making changes over time. In this tool, data
are plotted in time order series. It always consists of a central line for ascertaining the average
point, for the upper control limit there is an upper line and a lower line for controlling the lower
limit. These lines are determined with the help of historical data. These control chart graphs
helps in conducting study related to mechanisms of process changes over time. By comparing the
current data with historical control limits conclusion is drawn related to the quality.
CONCLUSION
From the above report it had been concluded that statistics play very important role for
business perspective whether it is small, medium or large enterprises. It has shown that statistical
evaluation gives valuable input to authority for purpose of decision making. Moreover, it has
reflected that descriptive statistics helps to summarize the entire data set in the best possible
aspect. Simultaneously, it has shown from graphical report which shows better aspect of data set
and helps for purpose of understanding same prominently. In the same series, it is derived
through statistical techniques and tool which helps in giving assistance with context to business
planning. Furthermore, it has been stated that objective of capacity management is for ensuring
justifiable cost which is matched to the future and current agreed requirements of business in
Paraphrase This Document
Need a fresh take? Get an instant paraphrase of this document with our AI Paraphraser

timely aspect. Thus, techniques of statistics units of business could make appropriate plan on
basis of capacity, inventory and quality management.
basis of capacity, inventory and quality management.
1 out of 11
Related Documents


Your All-in-One AI-Powered Toolkit for Academic Success.
+13062052269
info@desklib.com
Available 24*7 on WhatsApp / Email
![[object Object]](/_next/static/media/star-bottom.7253800d.svg)
Unlock your academic potential
Copyright © 2020–2026 A2Z Services. All Rights Reserved. Developed and managed by ZUCOL.