Statistics for Managerial Decisions: Analysis and Solutions
VerifiedAdded on 2023/06/05
|12
|1707
|406
Homework Assignment
AI Summary
This document presents a comprehensive solution to a statistics assignment focused on managerial decisions. It begins with data analysis, including stem and leaf plots and frequency distributions of stock prices for CSR and SFR, followed by an analysis of market capital for various organizations. The assignment then delves into statistical ratios such as dividend yield and P/E ratios to guide investment decisions. The subsequent sections explore house price distributions in capital cities, calculating standard deviations and ranges. The document also covers probability calculations related to employment statistics and rainfall patterns. Finally, it includes an analysis of normal probability plots for different variables like transportation expense and body mass index, along with confidence interval calculations for absenteeism data, providing a complete statistical analysis relevant to managerial contexts.
Running Head: STATISTICS FOR MANAGERIAL DECISIONS
Statistics for Managerial Decisions
Name of the Student
Name of the University
Author Note
Statistics for Managerial Decisions
Name of the Student
Name of the University
Author Note
Paraphrase This Document
Need a fresh take? Get an instant paraphrase of this document with our AI Paraphraser
1STATISTICS FOR MANAGERIAL DECISIONS
Table of Contents
Answer 1..........................................................................................................................................2
Part a............................................................................................................................................2
Part b............................................................................................................................................2
Part c............................................................................................................................................3
Part d............................................................................................................................................3
Answer 2..........................................................................................................................................4
Part a............................................................................................................................................4
Part b............................................................................................................................................4
Part c............................................................................................................................................4
Part d............................................................................................................................................4
Answer 3..........................................................................................................................................5
Part a............................................................................................................................................5
Part b............................................................................................................................................5
Part c............................................................................................................................................5
Part d............................................................................................................................................5
Answer 4..........................................................................................................................................6
Part a............................................................................................................................................6
Part i.............................................................................................................................................6
Part ii............................................................................................................................................6
Part b............................................................................................................................................6
Part i.............................................................................................................................................6
Part ii............................................................................................................................................6
Answer 5..........................................................................................................................................7
Part a............................................................................................................................................7
Part b............................................................................................................................................9
2STATISTICS FOR MANAGERIAL DECISIONS
Answer 1
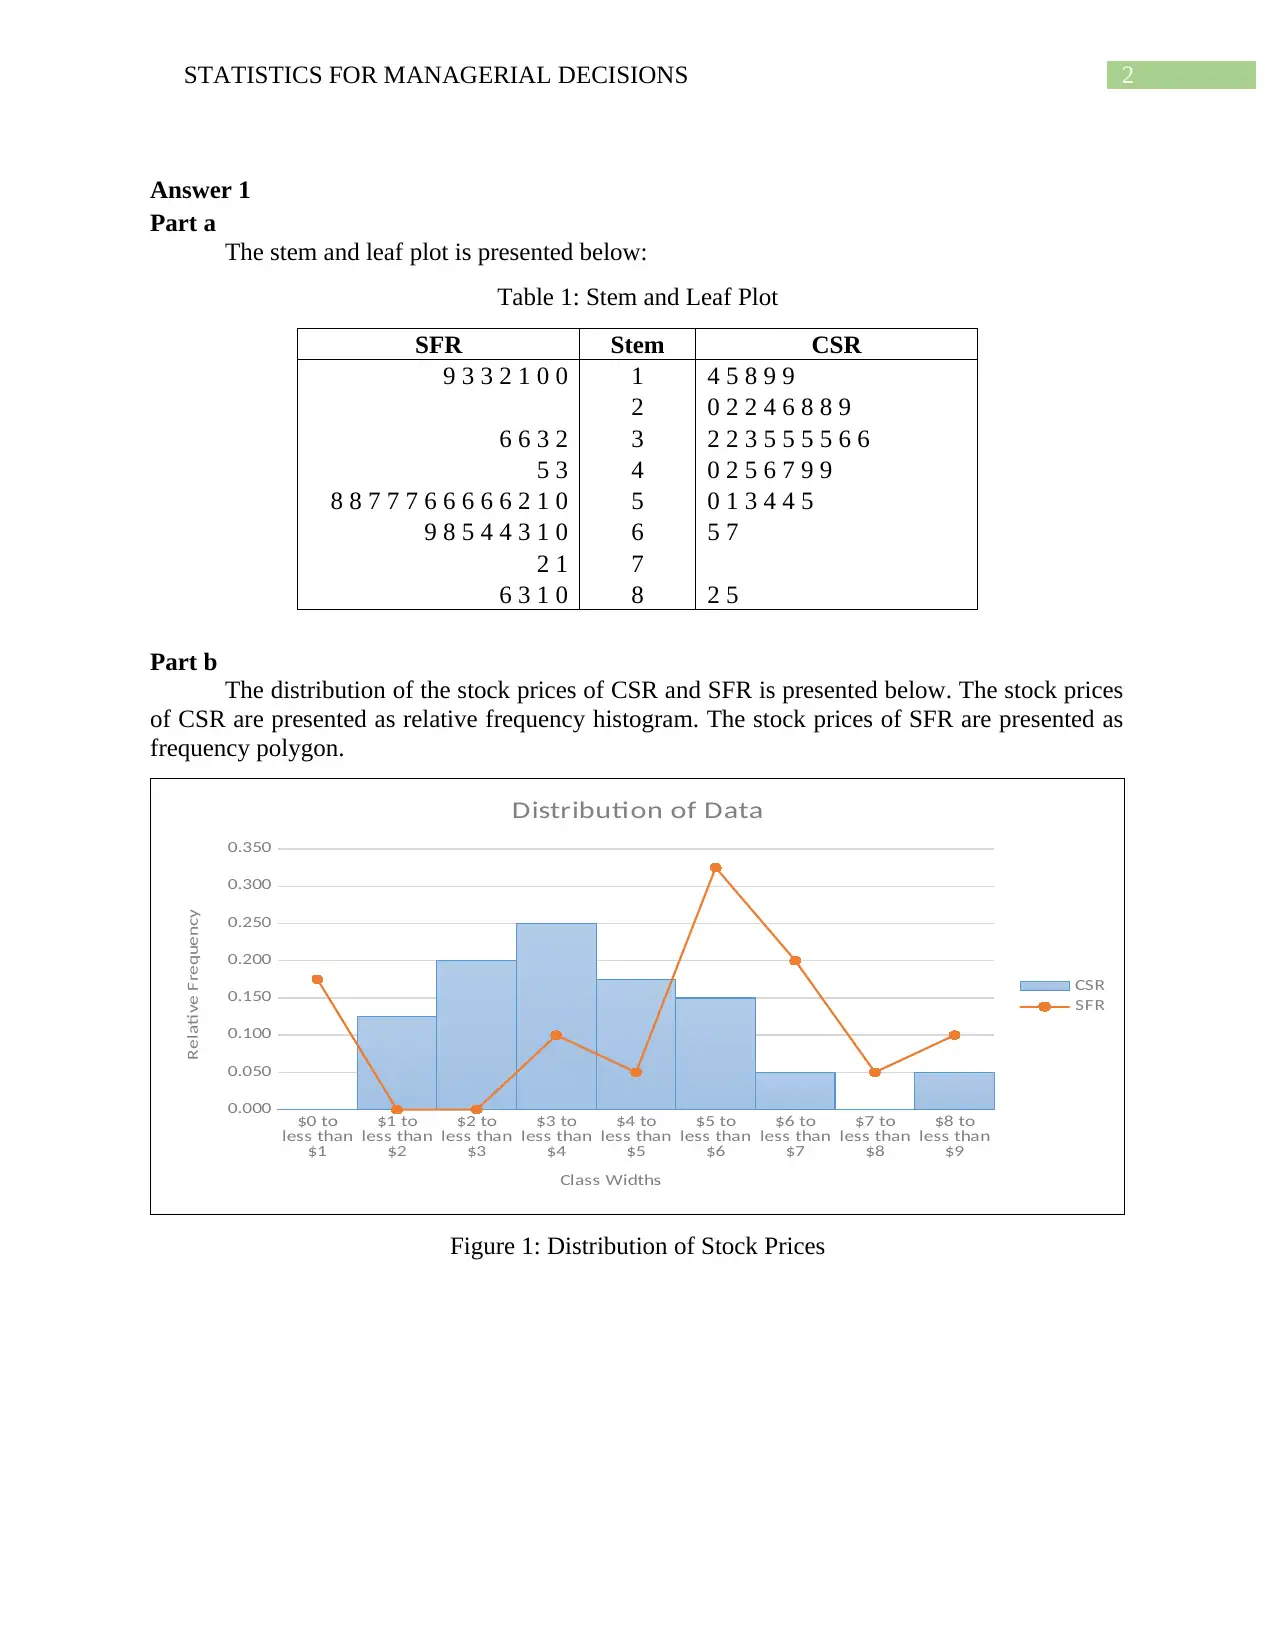
Part a
The stem and leaf plot is presented below:
Table 1: Stem and Leaf Plot
SFR Stem CSR
9 3 3 2 1 0 0 1 4 5 8 9 9
2 0 2 2 4 6 8 8 9
6 6 3 2 3 2 2 3 5 5 5 5 6 6
5 3 4 0 2 5 6 7 9 9
8 8 7 7 7 6 6 6 6 6 2 1 0 5 0 1 3 4 4 5
9 8 5 4 4 3 1 0 6 5 7
2 1 7
6 3 1 0 8 2 5
Part b
The distribution of the stock prices of CSR and SFR is presented below. The stock prices
of CSR are presented as relative frequency histogram. The stock prices of SFR are presented as
frequency polygon.
$0 to
less than
$1
$1 to
less than
$2
$2 to
less than
$3
$3 to
less than
$4
$4 to
less than
$5
$5 to
less than
$6
$6 to
less than
$7
$7 to
less than
$8
$8 to
less than
$9
0.000
0.050
0.100
0.150
0.200
0.250
0.300
0.350
Distribution of Data
CSR
SFR
Class Widths
Relative Frequency
Figure 1: Distribution of Stock Prices
Answer 1
Part a
The stem and leaf plot is presented below:
Table 1: Stem and Leaf Plot
SFR Stem CSR
9 3 3 2 1 0 0 1 4 5 8 9 9
2 0 2 2 4 6 8 8 9
6 6 3 2 3 2 2 3 5 5 5 5 6 6
5 3 4 0 2 5 6 7 9 9
8 8 7 7 7 6 6 6 6 6 2 1 0 5 0 1 3 4 4 5
9 8 5 4 4 3 1 0 6 5 7
2 1 7
6 3 1 0 8 2 5
Part b
The distribution of the stock prices of CSR and SFR is presented below. The stock prices
of CSR are presented as relative frequency histogram. The stock prices of SFR are presented as
frequency polygon.
$0 to
less than
$1
$1 to
less than
$2
$2 to
less than
$3
$3 to
less than
$4
$4 to
less than
$5
$5 to
less than
$6
$6 to
less than
$7
$7 to
less than
$8
$8 to
less than
$9
0.000
0.050
0.100
0.150
0.200
0.250
0.300
0.350
Distribution of Data
CSR
SFR
Class Widths
Relative Frequency
Figure 1: Distribution of Stock Prices
⊘ This is a preview!⊘
Do you want full access?
Subscribe today to unlock all pages.
Trusted by 1+ million students worldwide
3STATISTICS FOR MANAGERIAL DECISIONS
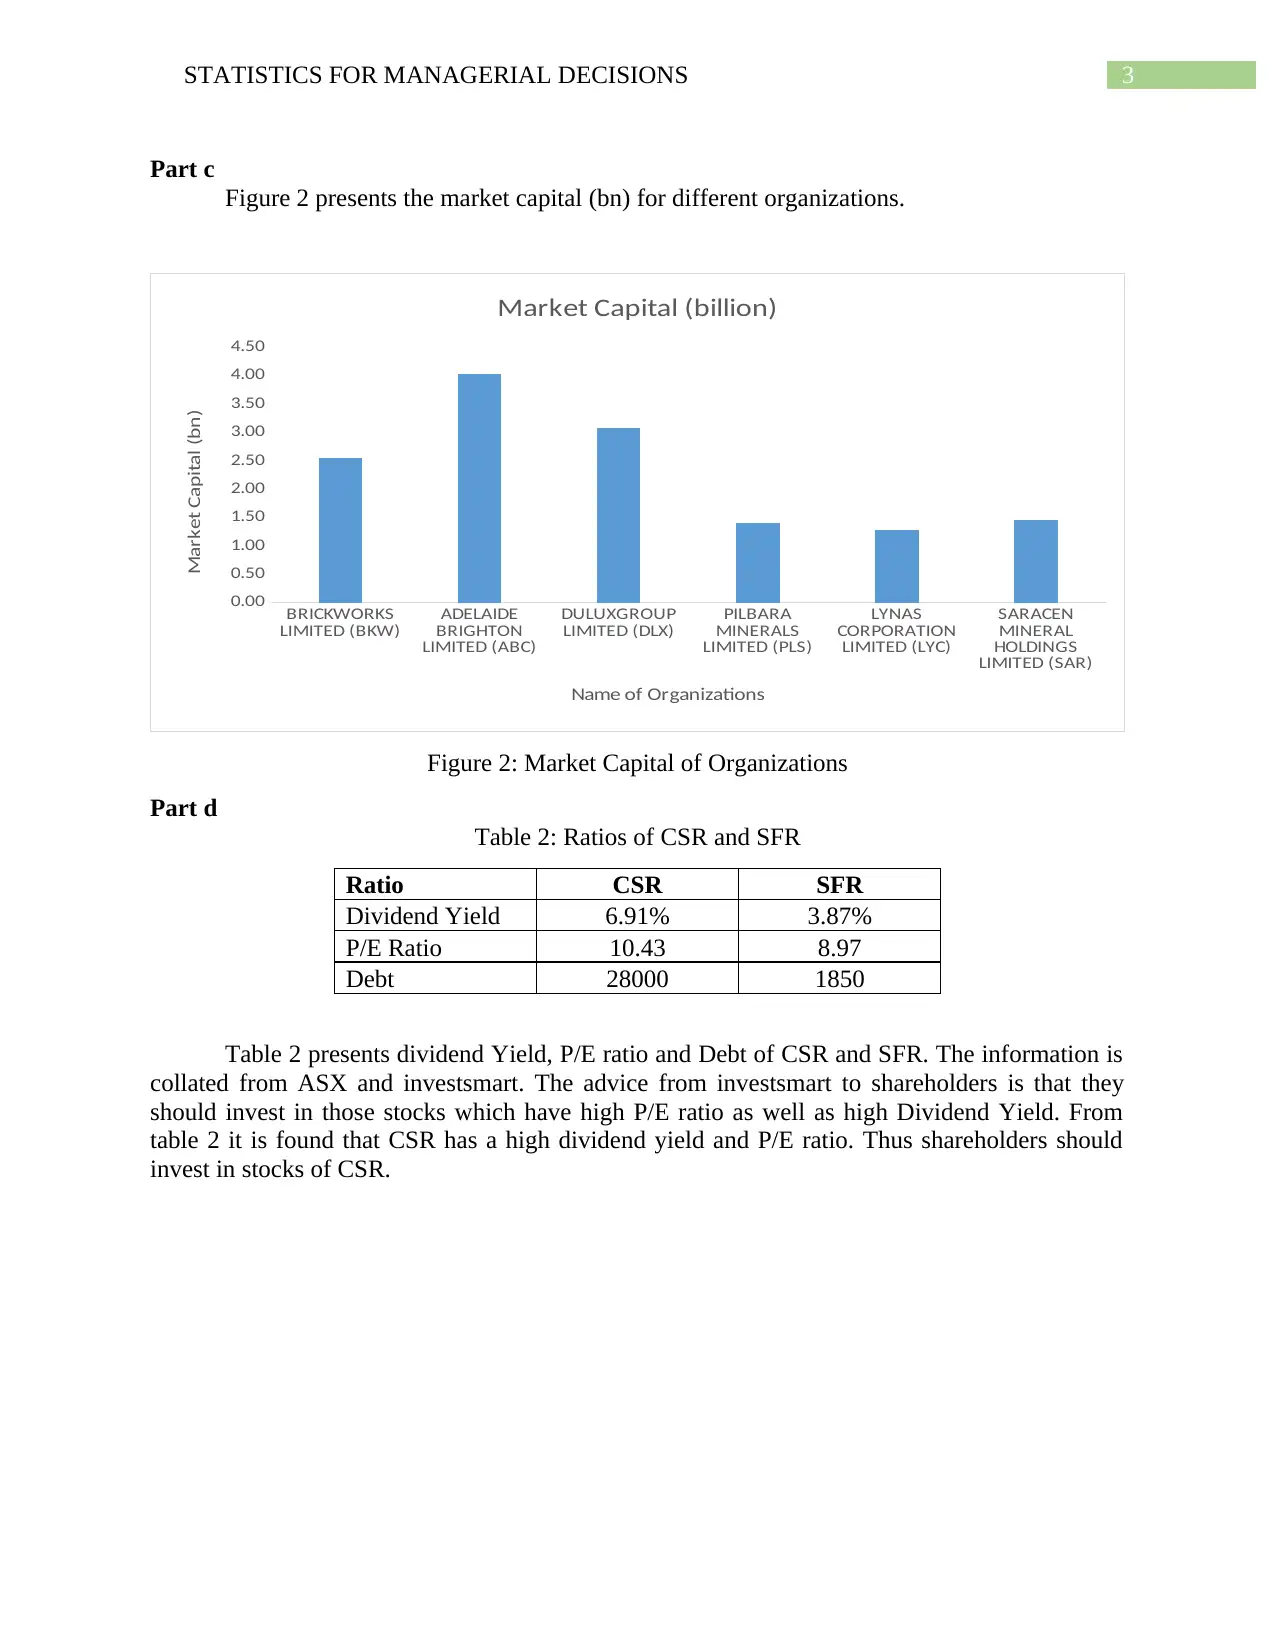
Part c
Figure 2 presents the market capital (bn) for different organizations.
BRICKWORKS
LIMITED (BKW) ADELAIDE
BRIGHTON
LIMITED (ABC)
DULUXGROUP
LIMITED (DLX) PILBARA
MINERALS
LIMITED (PLS)
LYNAS
CORPORATION
LIMITED (LYC)
SARACEN
MINERAL
HOLDINGS
LIMITED (SAR)
0.00
0.50
1.00
1.50
2.00
2.50
3.00
3.50
4.00
4.50
Market Capital (billion)
Name of Organizations
Market Capital (bn)
Figure 2: Market Capital of Organizations
Part d
Table 2: Ratios of CSR and SFR
Ratio CSR SFR
Dividend Yield 6.91% 3.87%
P/E Ratio 10.43 8.97
Debt 28000 1850
Table 2 presents dividend Yield, P/E ratio and Debt of CSR and SFR. The information is
collated from ASX and investsmart. The advice from investsmart to shareholders is that they
should invest in those stocks which have high P/E ratio as well as high Dividend Yield. From
table 2 it is found that CSR has a high dividend yield and P/E ratio. Thus shareholders should
invest in stocks of CSR.
Paraphrase This Document
Need a fresh take? Get an instant paraphrase of this document with our AI Paraphraser
4STATISTICS FOR MANAGERIAL DECISIONS
Answer 2
Part a
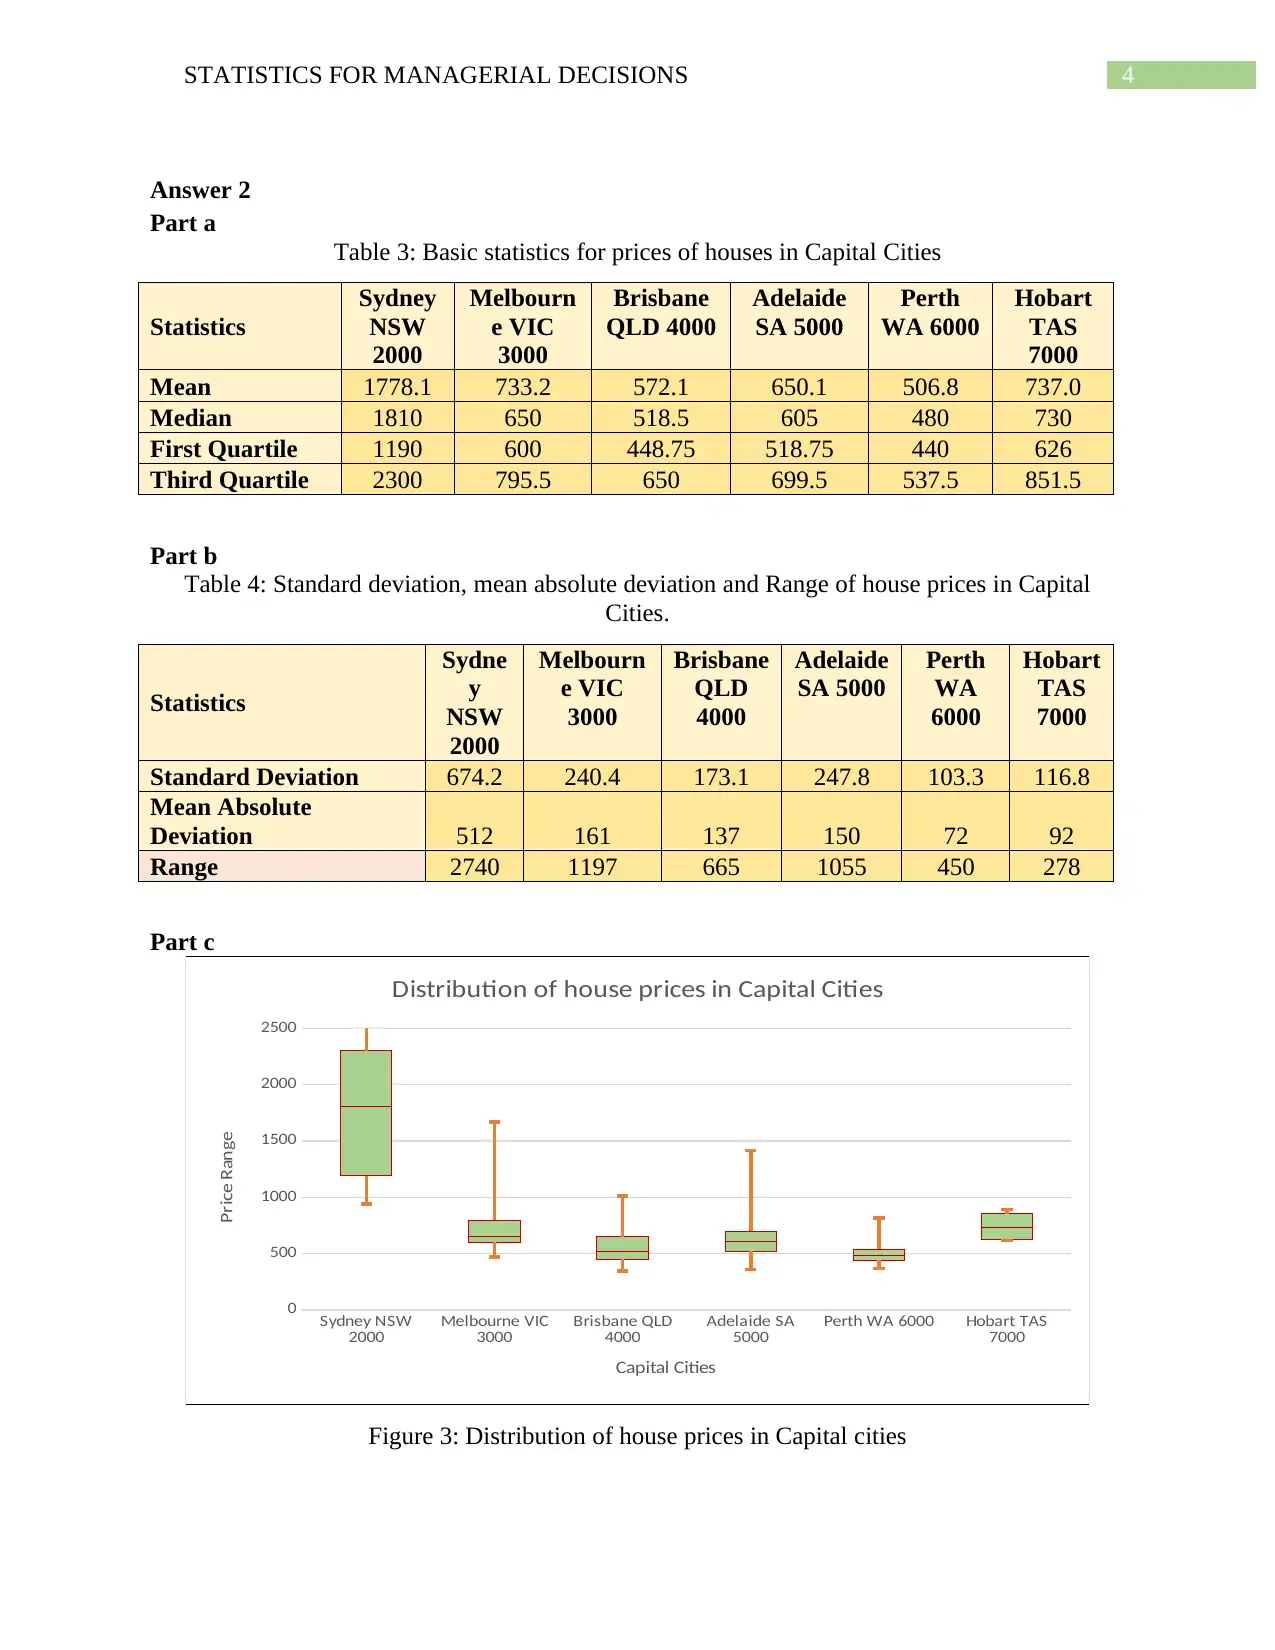
Table 3: Basic statistics for prices of houses in Capital Cities
Statistics
Sydney
NSW
2000
Melbourn
e VIC
3000
Brisbane
QLD 4000
Adelaide
SA 5000
Perth
WA 6000
Hobart
TAS
7000
Mean 1778.1 733.2 572.1 650.1 506.8 737.0
Median 1810 650 518.5 605 480 730
First Quartile 1190 600 448.75 518.75 440 626
Third Quartile 2300 795.5 650 699.5 537.5 851.5
Part b
Table 4: Standard deviation, mean absolute deviation and Range of house prices in Capital
Cities.
Statistics
Sydne
y
NSW
2000
Melbourn
e VIC
3000
Brisbane
QLD
4000
Adelaide
SA 5000
Perth
WA
6000
Hobart
TAS
7000
Standard Deviation 674.2 240.4 173.1 247.8 103.3 116.8
Mean Absolute
Deviation 512 161 137 150 72 92
Range 2740 1197 665 1055 450 278
Part c
Sydney NSW
2000 Melbourne VIC
3000 Brisbane QLD
4000 Adelaide SA
5000 Perth WA 6000 Hobart TAS
7000
0
500
1000
1500
2000
2500
Distribution of house prices in Capital Cities
Capital Cities
Price Range
Figure 3: Distribution of house prices in Capital cities
Answer 2
Part a
Table 3: Basic statistics for prices of houses in Capital Cities
Statistics
Sydney
NSW
2000
Melbourn
e VIC
3000
Brisbane
QLD 4000
Adelaide
SA 5000
Perth
WA 6000
Hobart
TAS
7000
Mean 1778.1 733.2 572.1 650.1 506.8 737.0
Median 1810 650 518.5 605 480 730
First Quartile 1190 600 448.75 518.75 440 626
Third Quartile 2300 795.5 650 699.5 537.5 851.5
Part b
Table 4: Standard deviation, mean absolute deviation and Range of house prices in Capital
Cities.
Statistics
Sydne
y
NSW
2000
Melbourn
e VIC
3000
Brisbane
QLD
4000
Adelaide
SA 5000
Perth
WA
6000
Hobart
TAS
7000
Standard Deviation 674.2 240.4 173.1 247.8 103.3 116.8
Mean Absolute
Deviation 512 161 137 150 72 92
Range 2740 1197 665 1055 450 278
Part c
Sydney NSW
2000 Melbourne VIC
3000 Brisbane QLD
4000 Adelaide SA
5000 Perth WA 6000 Hobart TAS
7000
0
500
1000
1500
2000
2500
Distribution of house prices in Capital Cities
Capital Cities
Price Range
Figure 3: Distribution of house prices in Capital cities
5STATISTICS FOR MANAGERIAL DECISIONS
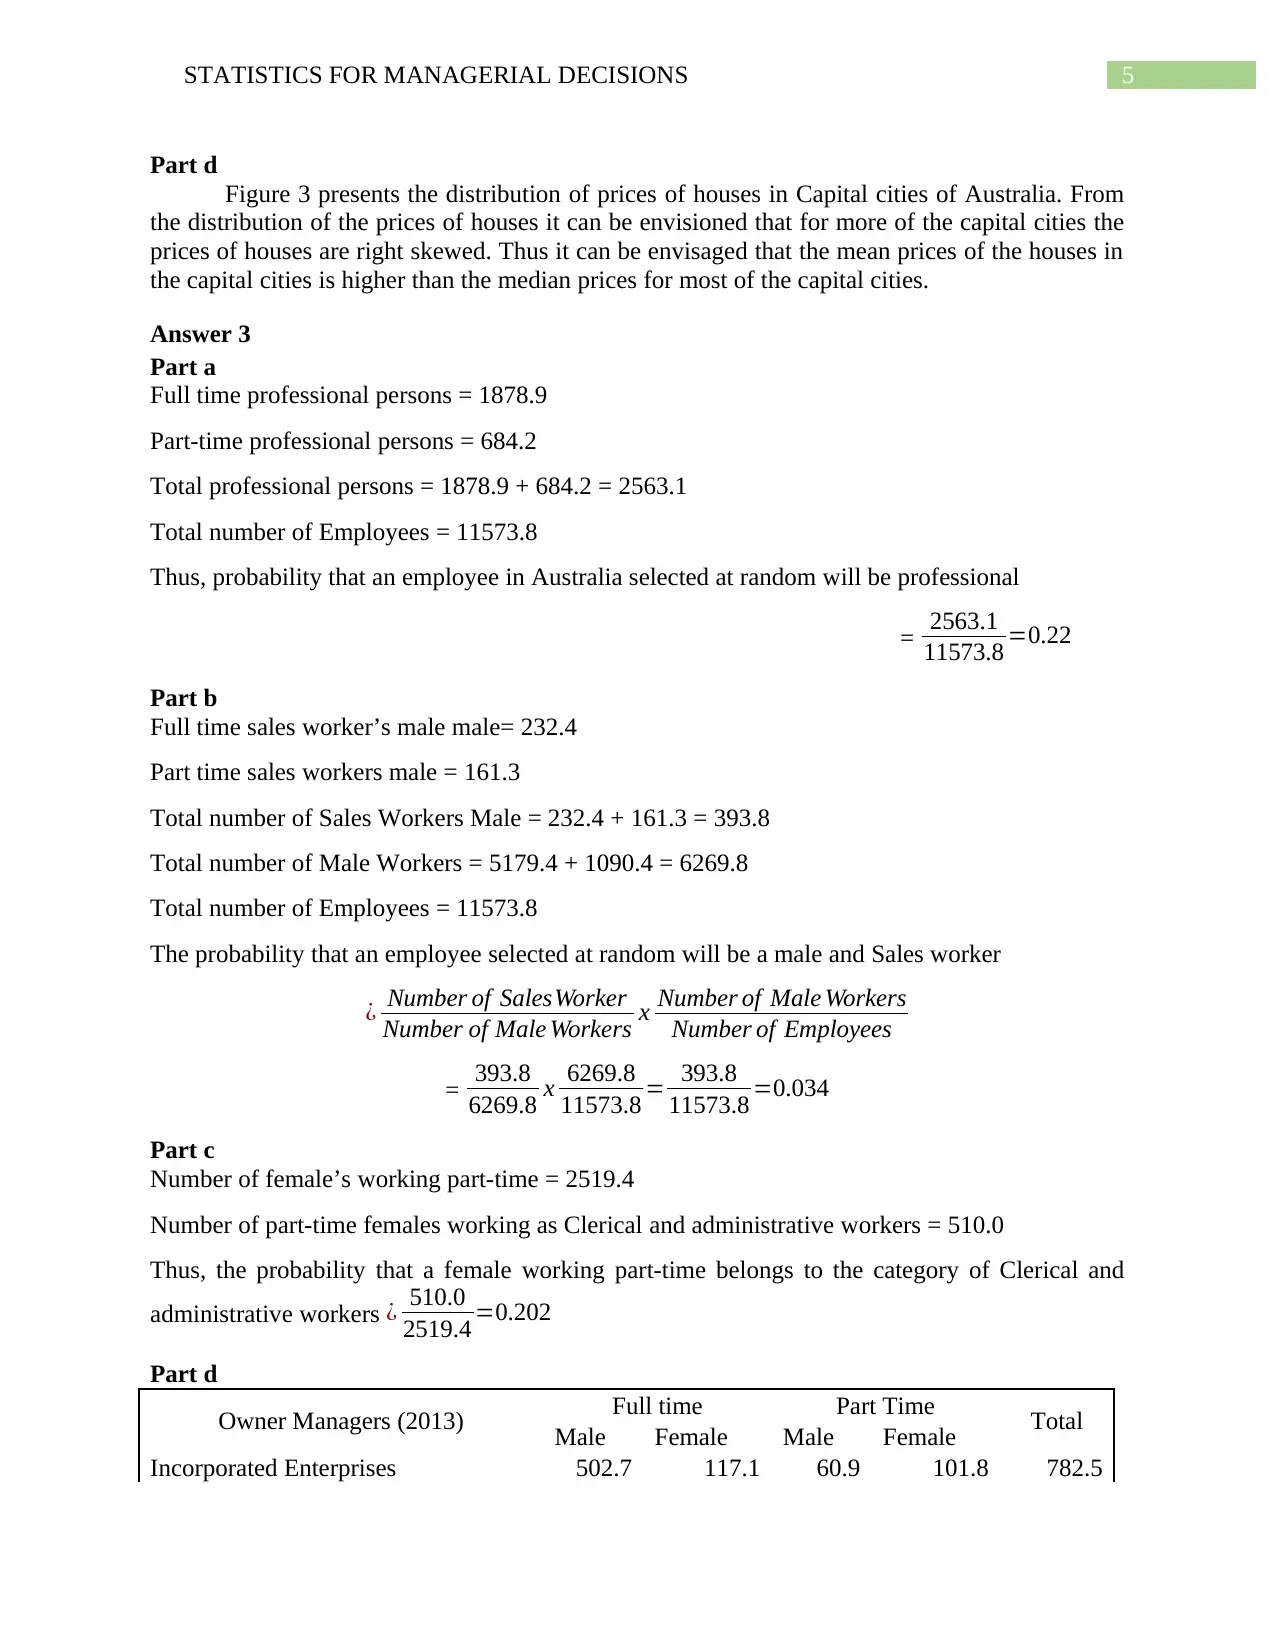
Part d
Figure 3 presents the distribution of prices of houses in Capital cities of Australia. From
the distribution of the prices of houses it can be envisioned that for more of the capital cities the
prices of houses are right skewed. Thus it can be envisaged that the mean prices of the houses in
the capital cities is higher than the median prices for most of the capital cities.
Answer 3
Part a
Full time professional persons = 1878.9
Part-time professional persons = 684.2
Total professional persons = 1878.9 + 684.2 = 2563.1
Total number of Employees = 11573.8
Thus, probability that an employee in Australia selected at random will be professional
= 2563.1
11573.8 =0.22
Part b
Full time sales worker’s male male= 232.4
Part time sales workers male = 161.3
Total number of Sales Workers Male = 232.4 + 161.3 = 393.8
Total number of Male Workers = 5179.4 + 1090.4 = 6269.8
Total number of Employees = 11573.8
The probability that an employee selected at random will be a male and Sales worker
¿ Number of SalesWorker
Number of Male Workers x Number of Male Workers
Number of Employees
= 393.8
6269.8 x 6269.8
11573.8 = 393.8
11573.8 =0.034
Part c
Number of female’s working part-time = 2519.4
Number of part-time females working as Clerical and administrative workers = 510.0
Thus, the probability that a female working part-time belongs to the category of Clerical and
administrative workers ¿ 510.0
2519.4 =0.202
Part d
Owner Managers (2013) Full time Part Time Total
Male Female Male Female
Incorporated Enterprises 502.7 117.1 60.9 101.8 782.5
Part d
Figure 3 presents the distribution of prices of houses in Capital cities of Australia. From
the distribution of the prices of houses it can be envisioned that for more of the capital cities the
prices of houses are right skewed. Thus it can be envisaged that the mean prices of the houses in
the capital cities is higher than the median prices for most of the capital cities.
Answer 3
Part a
Full time professional persons = 1878.9
Part-time professional persons = 684.2
Total professional persons = 1878.9 + 684.2 = 2563.1
Total number of Employees = 11573.8
Thus, probability that an employee in Australia selected at random will be professional
= 2563.1
11573.8 =0.22
Part b
Full time sales worker’s male male= 232.4
Part time sales workers male = 161.3
Total number of Sales Workers Male = 232.4 + 161.3 = 393.8
Total number of Male Workers = 5179.4 + 1090.4 = 6269.8
Total number of Employees = 11573.8
The probability that an employee selected at random will be a male and Sales worker
¿ Number of SalesWorker
Number of Male Workers x Number of Male Workers
Number of Employees
= 393.8
6269.8 x 6269.8
11573.8 = 393.8
11573.8 =0.034
Part c
Number of female’s working part-time = 2519.4
Number of part-time females working as Clerical and administrative workers = 510.0
Thus, the probability that a female working part-time belongs to the category of Clerical and
administrative workers ¿ 510.0
2519.4 =0.202
Part d
Owner Managers (2013) Full time Part Time Total
Male Female Male Female
Incorporated Enterprises 502.7 117.1 60.9 101.8 782.5
⊘ This is a preview!⊘
Do you want full access?
Subscribe today to unlock all pages.
Trusted by 1+ million students worldwide
6STATISTICS FOR MANAGERIAL DECISIONS
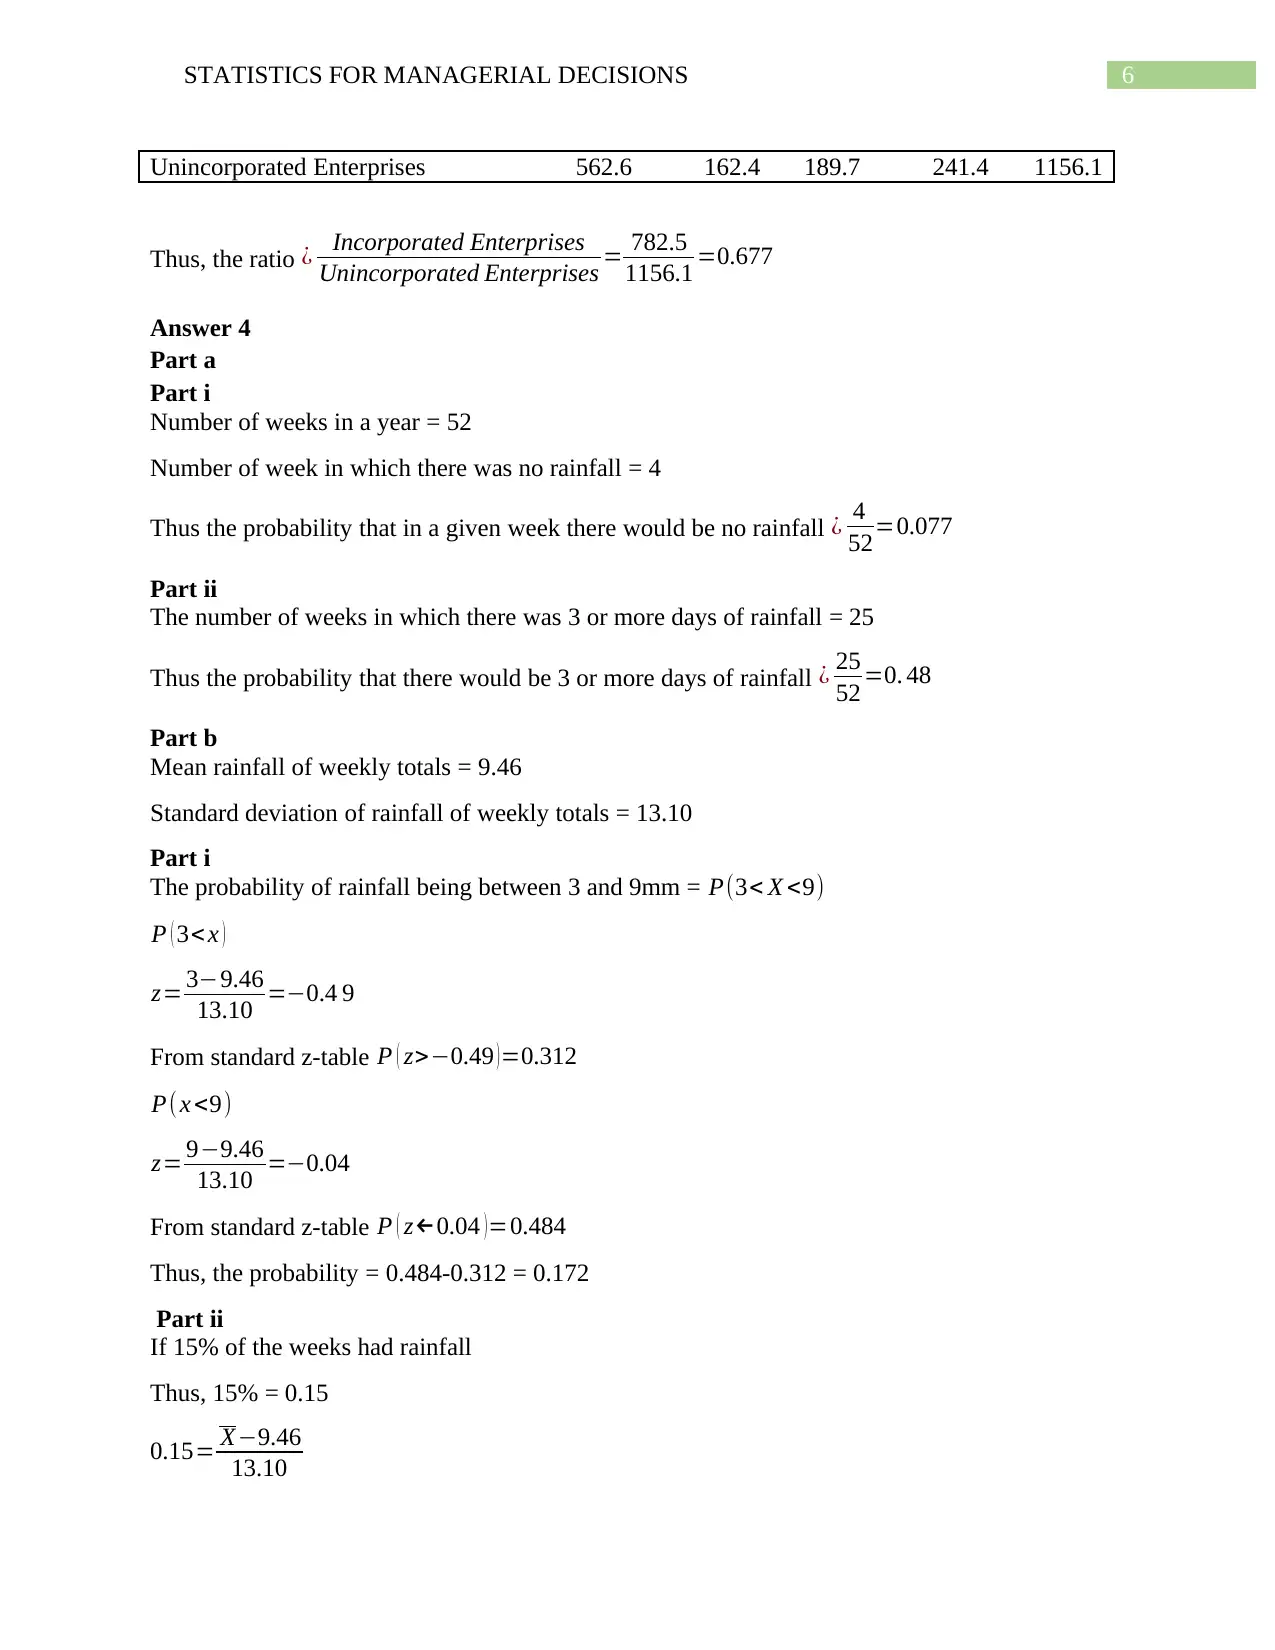
Unincorporated Enterprises 562.6 162.4 189.7 241.4 1156.1
Thus, the ratio ¿ Incorporated Enterprises
Unincorporated Enterprises = 782.5
1156.1 =0.677
Answer 4
Part a
Part i
Number of weeks in a year = 52
Number of week in which there was no rainfall = 4
Thus the probability that in a given week there would be no rainfall ¿ 4
52=0.077
Part ii
The number of weeks in which there was 3 or more days of rainfall = 25
Thus the probability that there would be 3 or more days of rainfall ¿ 25
52 =0. 48
Part b
Mean rainfall of weekly totals = 9.46
Standard deviation of rainfall of weekly totals = 13.10
Part i
The probability of rainfall being between 3 and 9mm = P(3< X <9)
P ( 3< x )
z= 3−9.46
13.10 =−0.4 9
From standard z-table P ( z>−0.49 )=0.312
P(x <9)
z= 9−9.46
13.10 =−0.04
From standard z-table P ( z←0.04 )=0.484
Thus, the probability = 0.484-0.312 = 0.172
Part ii
If 15% of the weeks had rainfall
Thus, 15% = 0.15
0.15= X−9.46
13.10
Paraphrase This Document
Need a fresh take? Get an instant paraphrase of this document with our AI Paraphraser
7STATISTICS FOR MANAGERIAL DECISIONS
Thus X =13.10∗0.15+9.46=11.425
Thus the average rainfall would be 11.425 mm or higher
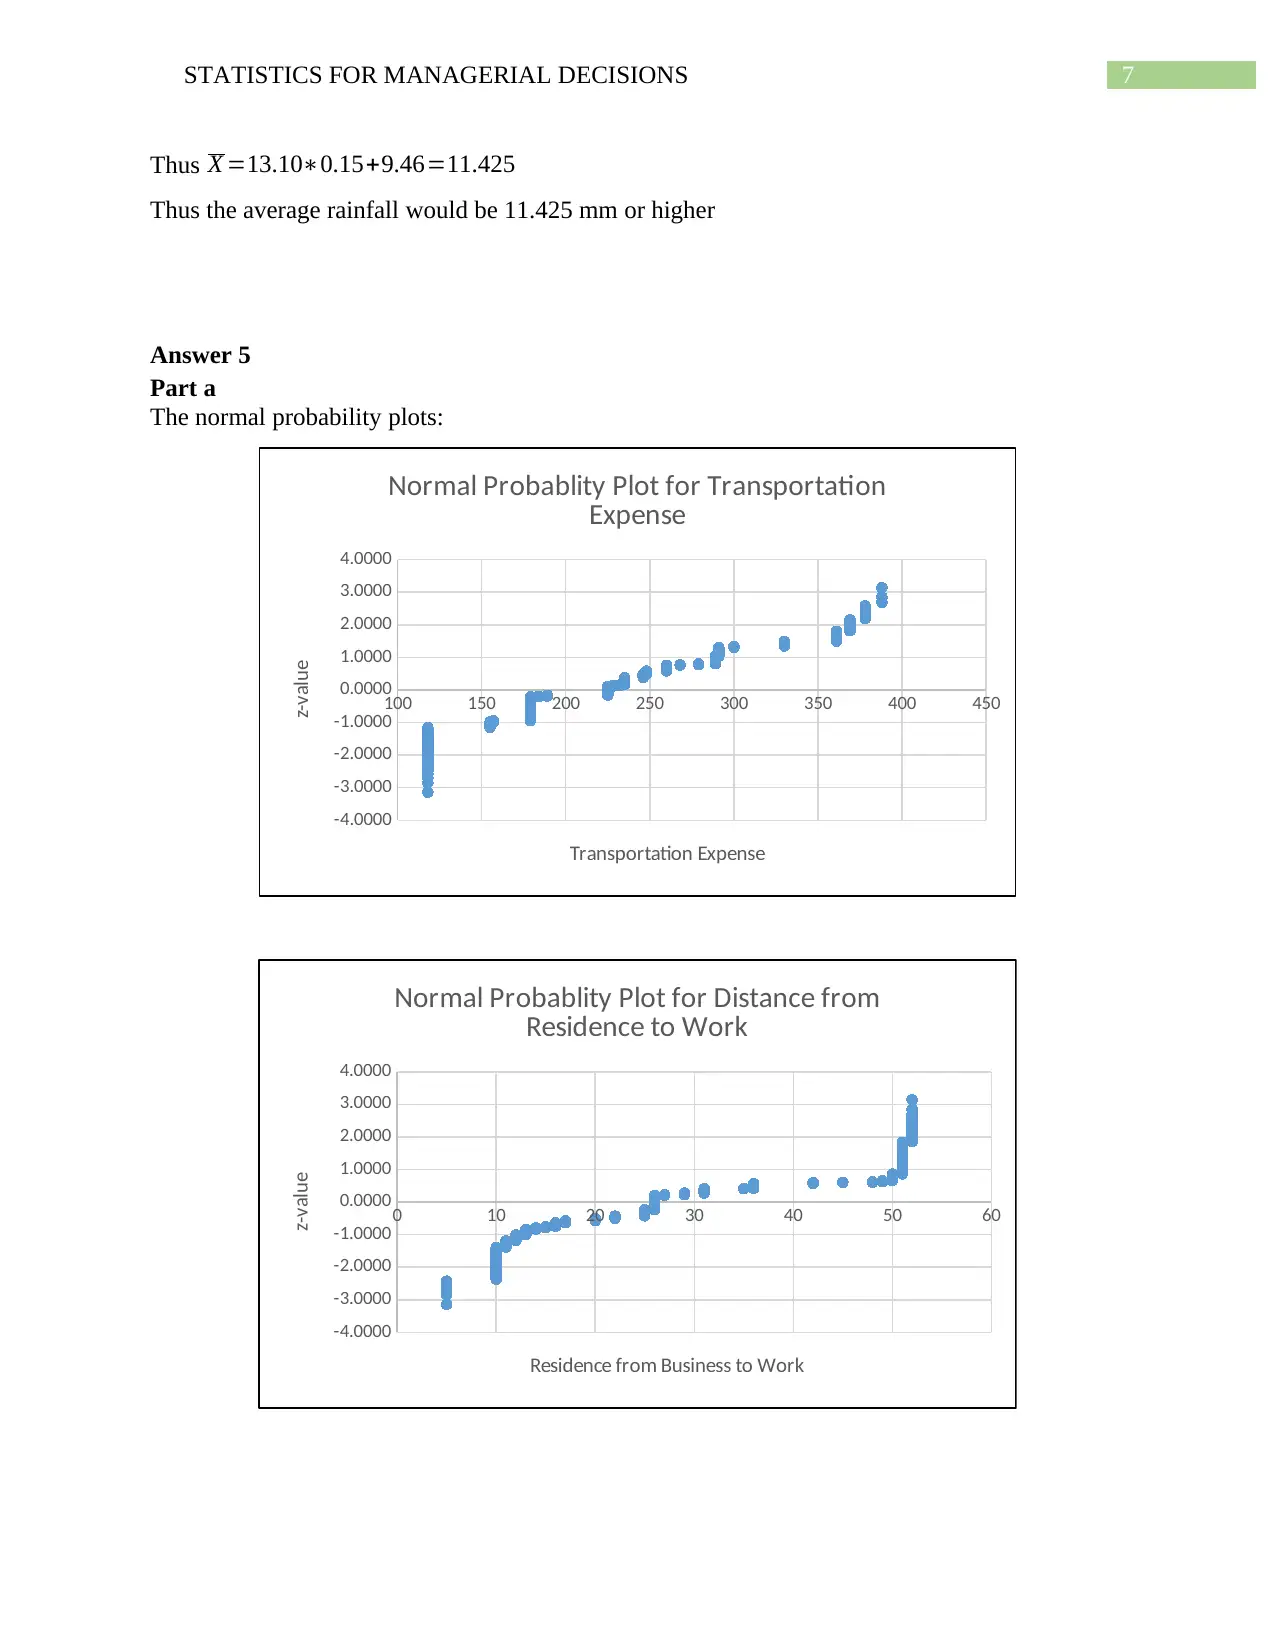
Answer 5
Part a
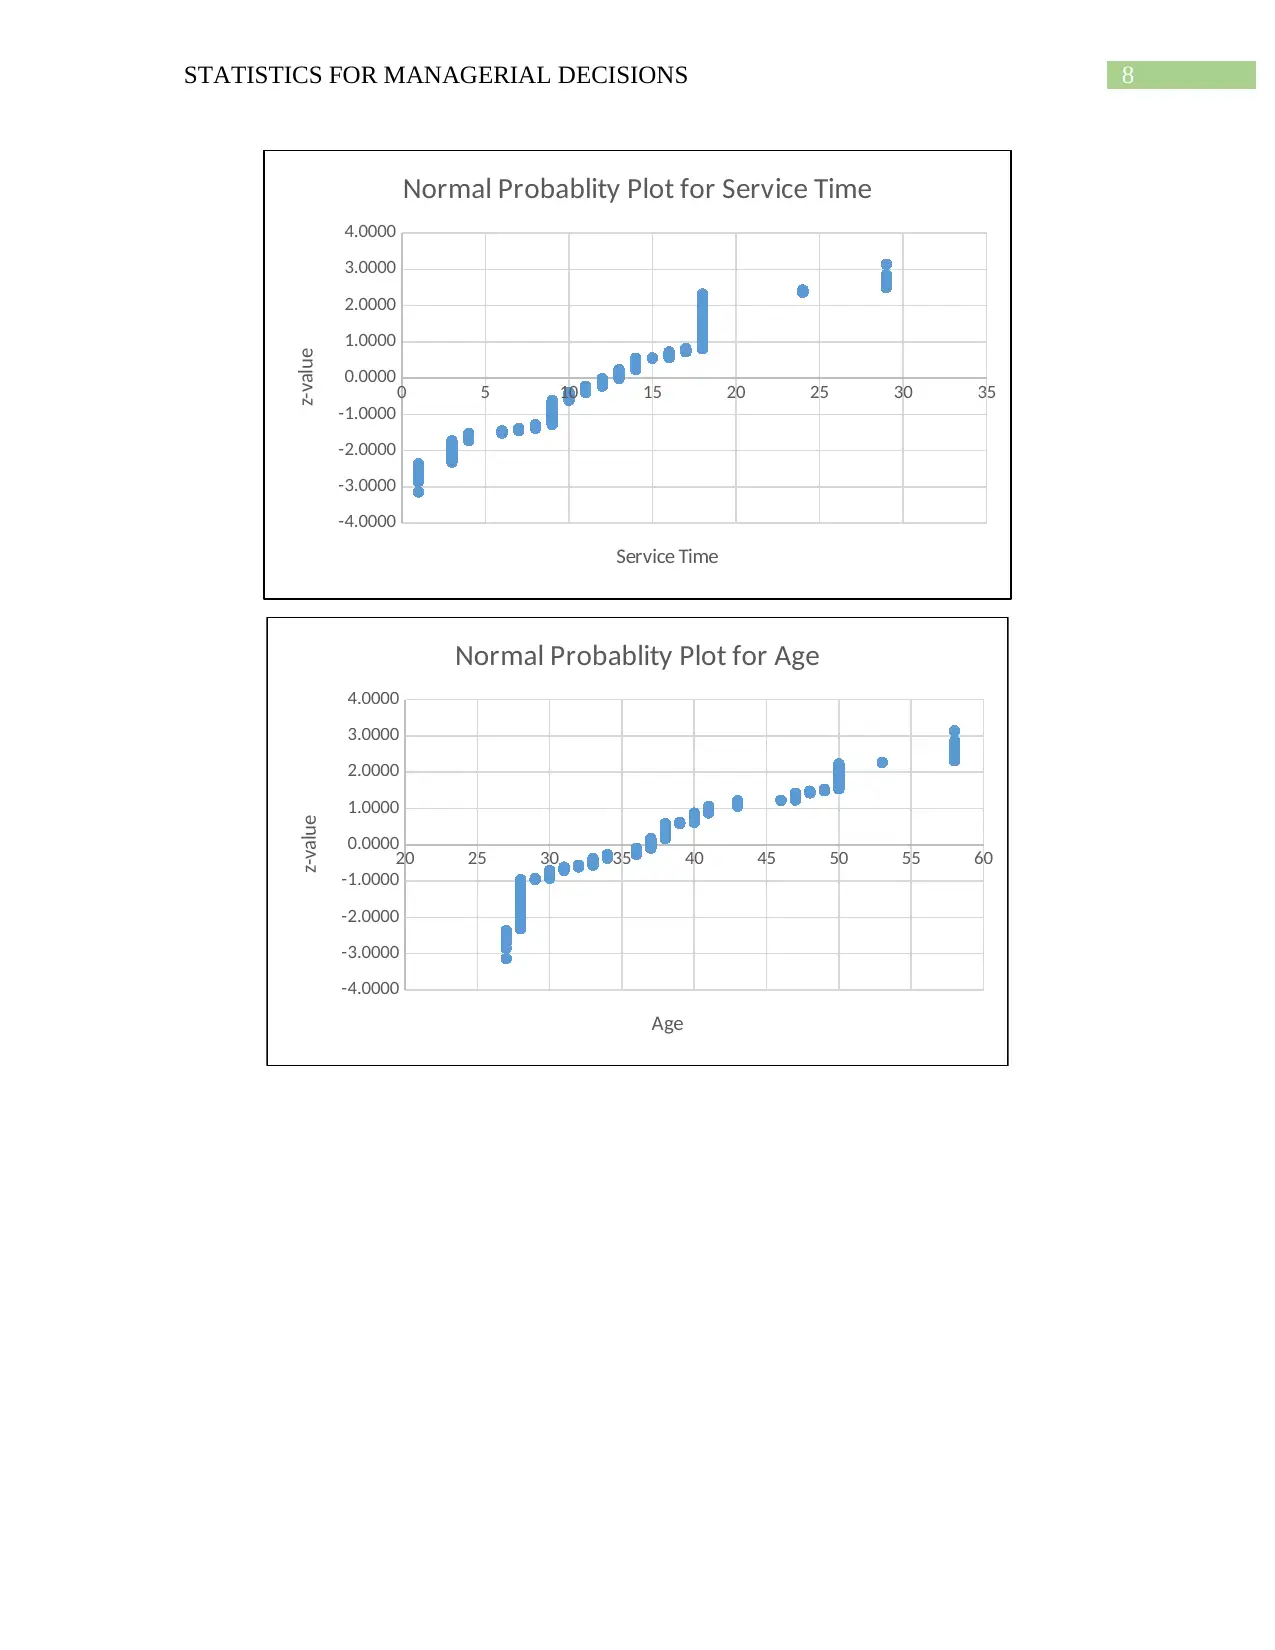
The normal probability plots:
100 150 200 250 300 350 400 450
-4.0000
-3.0000
-2.0000
-1.0000
0.0000
1.0000
2.0000
3.0000
4.0000
Normal Probablity Plot for Transportation
Expense
Transportation Expense
z-value
0 10 20 30 40 50 60
-4.0000
-3.0000
-2.0000
-1.0000
0.0000
1.0000
2.0000
3.0000
4.0000
Normal Probablity Plot for Distance from
Residence to Work
Residence from Business to Work
z-value
Thus X =13.10∗0.15+9.46=11.425
Thus the average rainfall would be 11.425 mm or higher
Answer 5
Part a
The normal probability plots:
100 150 200 250 300 350 400 450
-4.0000
-3.0000
-2.0000
-1.0000
0.0000
1.0000
2.0000
3.0000
4.0000
Normal Probablity Plot for Transportation
Expense
Transportation Expense
z-value
0 10 20 30 40 50 60
-4.0000
-3.0000
-2.0000
-1.0000
0.0000
1.0000
2.0000
3.0000
4.0000
Normal Probablity Plot for Distance from
Residence to Work
Residence from Business to Work
z-value
8STATISTICS FOR MANAGERIAL DECISIONS
0 5 10 15 20 25 30 35
-4.0000
-3.0000
-2.0000
-1.0000
0.0000
1.0000
2.0000
3.0000
4.0000
Normal Probablity Plot for Service Time
Service Time
z-value
20 25 30 35 40 45 50 55 60
-4.0000
-3.0000
-2.0000
-1.0000
0.0000
1.0000
2.0000
3.0000
4.0000
Normal Probablity Plot for Age
Age
z-value
0 5 10 15 20 25 30 35
-4.0000
-3.0000
-2.0000
-1.0000
0.0000
1.0000
2.0000
3.0000
4.0000
Normal Probablity Plot for Service Time
Service Time
z-value
20 25 30 35 40 45 50 55 60
-4.0000
-3.0000
-2.0000
-1.0000
0.0000
1.0000
2.0000
3.0000
4.0000
Normal Probablity Plot for Age
Age
z-value
⊘ This is a preview!⊘
Do you want full access?
Subscribe today to unlock all pages.
Trusted by 1+ million students worldwide
9STATISTICS FOR MANAGERIAL DECISIONS
15 20 25 30 35 40
-4.0000
-3.0000
-2.0000
-1.0000
0.0000
1.0000
2.0000
3.0000
4.0000
Normal Probablity Plot for Body Mass Index
Body Mass Index
z-value
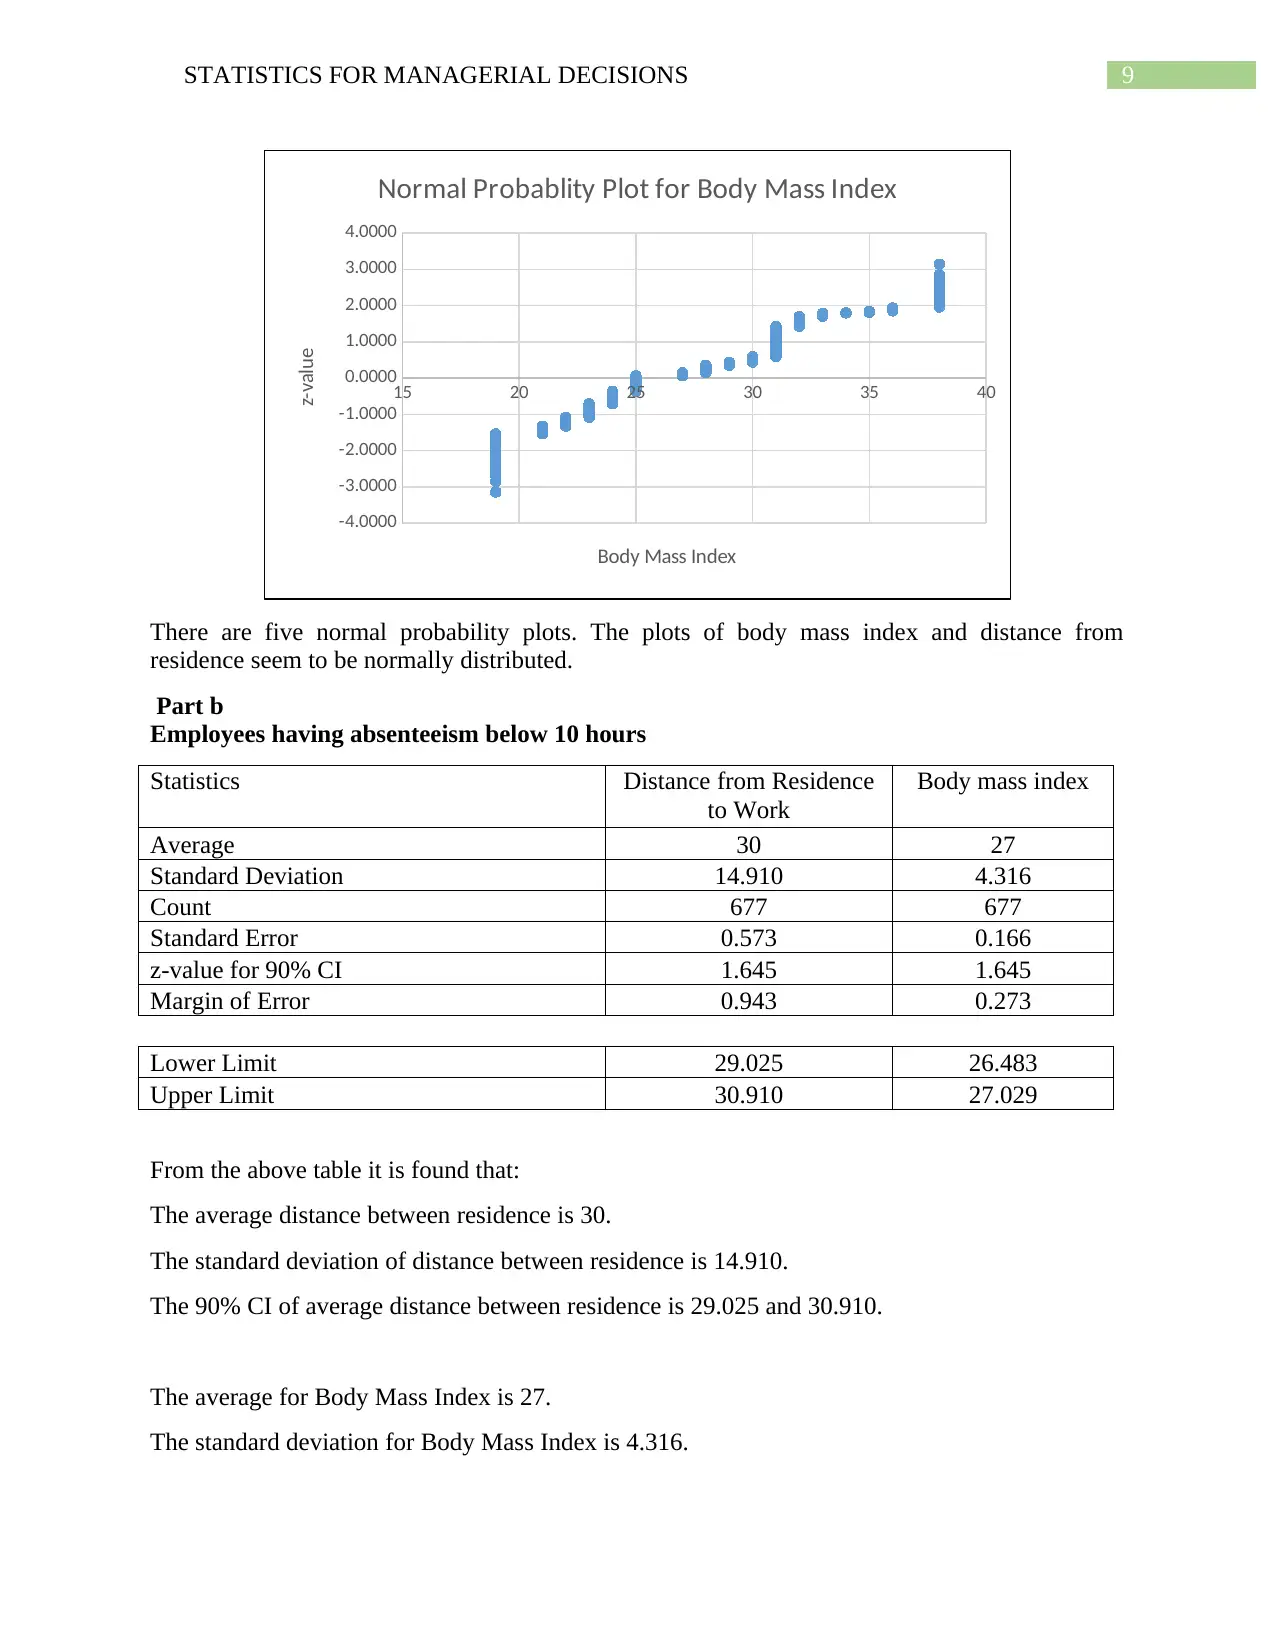
There are five normal probability plots. The plots of body mass index and distance from
residence seem to be normally distributed.
Part b
Employees having absenteeism below 10 hours
Statistics Distance from Residence
to Work
Body mass index
Average 30 27
Standard Deviation 14.910 4.316
Count 677 677
Standard Error 0.573 0.166
z-value for 90% CI 1.645 1.645
Margin of Error 0.943 0.273
Lower Limit 29.025 26.483
Upper Limit 30.910 27.029
From the above table it is found that:
The average distance between residence is 30.
The standard deviation of distance between residence is 14.910.
The 90% CI of average distance between residence is 29.025 and 30.910.
The average for Body Mass Index is 27.
The standard deviation for Body Mass Index is 4.316.
15 20 25 30 35 40
-4.0000
-3.0000
-2.0000
-1.0000
0.0000
1.0000
2.0000
3.0000
4.0000
Normal Probablity Plot for Body Mass Index
Body Mass Index
z-value
There are five normal probability plots. The plots of body mass index and distance from
residence seem to be normally distributed.
Part b
Employees having absenteeism below 10 hours
Statistics Distance from Residence
to Work
Body mass index
Average 30 27
Standard Deviation 14.910 4.316
Count 677 677
Standard Error 0.573 0.166
z-value for 90% CI 1.645 1.645
Margin of Error 0.943 0.273
Lower Limit 29.025 26.483
Upper Limit 30.910 27.029
From the above table it is found that:
The average distance between residence is 30.
The standard deviation of distance between residence is 14.910.
The 90% CI of average distance between residence is 29.025 and 30.910.
The average for Body Mass Index is 27.
The standard deviation for Body Mass Index is 4.316.
Paraphrase This Document
Need a fresh take? Get an instant paraphrase of this document with our AI Paraphraser
10STATISTICS FOR MANAGERIAL DECISIONS
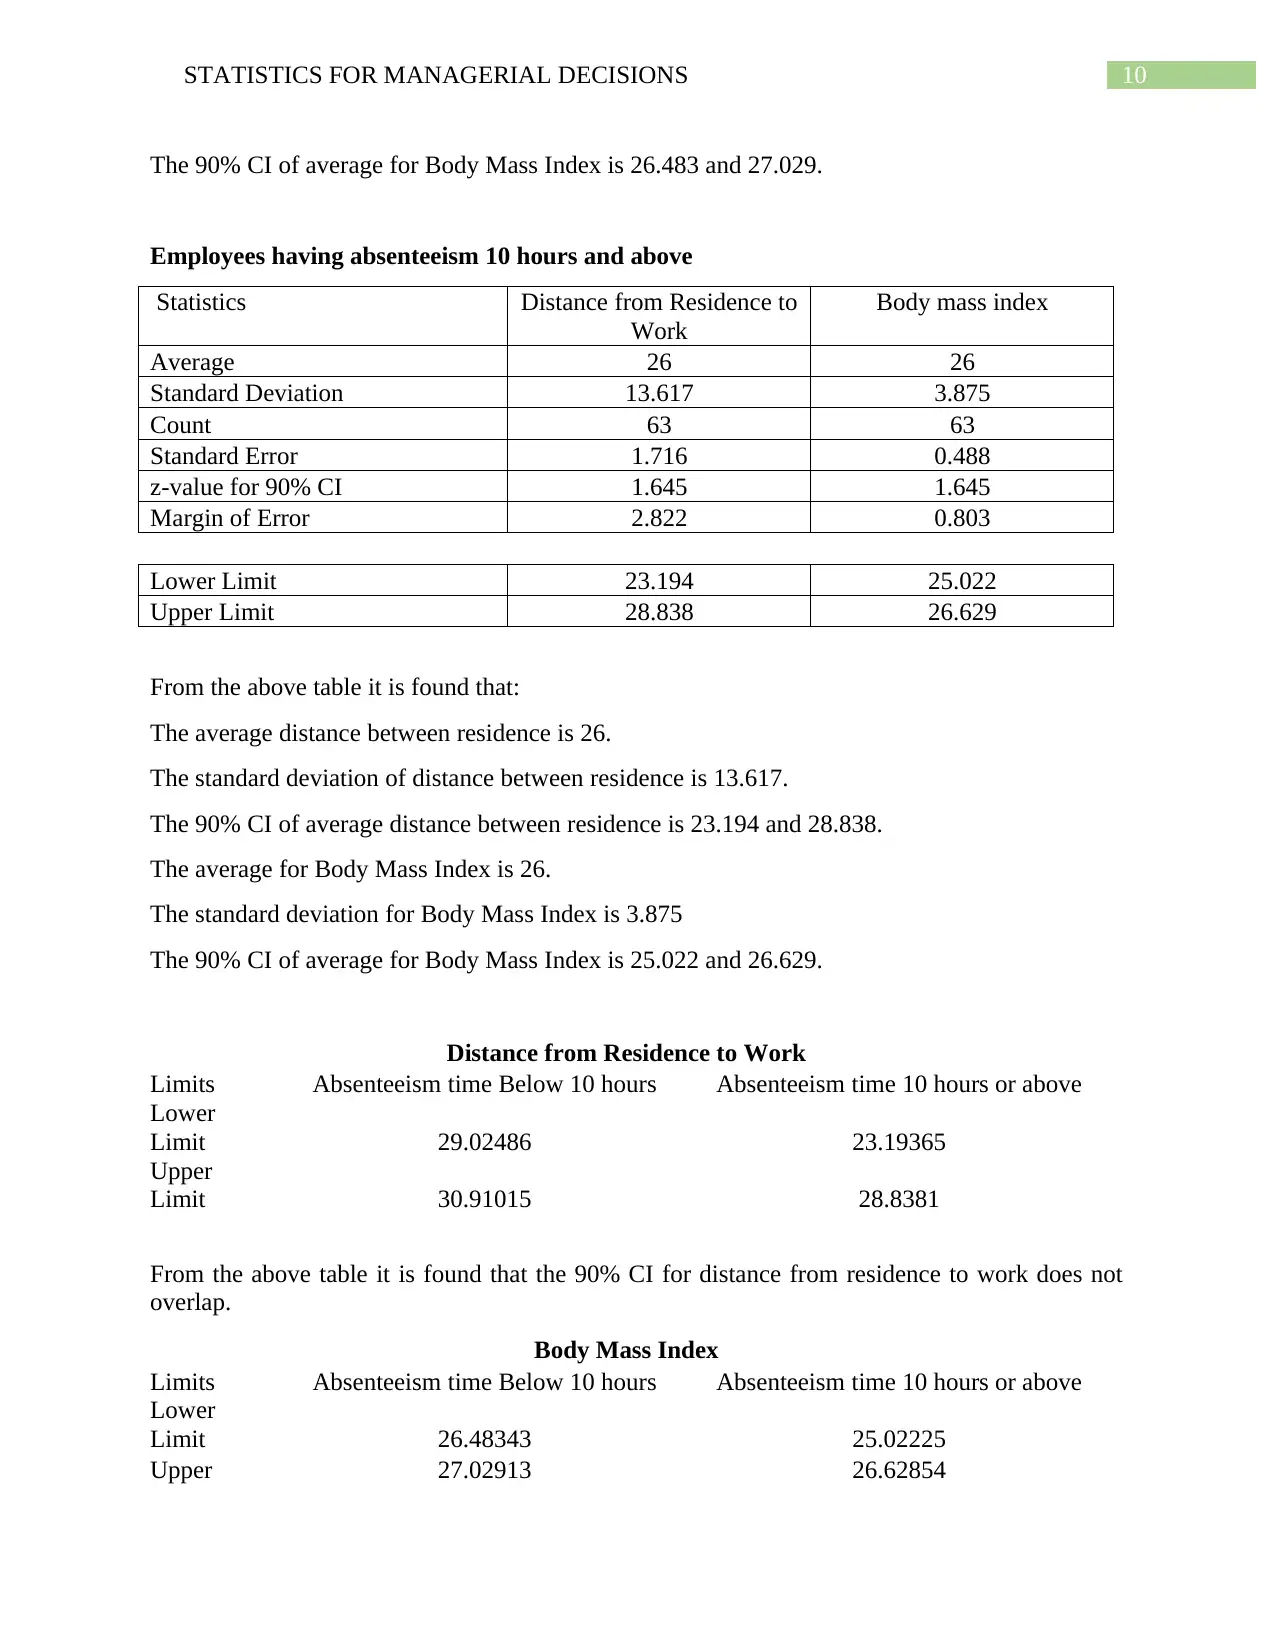
The 90% CI of average for Body Mass Index is 26.483 and 27.029.
Employees having absenteeism 10 hours and above
Statistics Distance from Residence to
Work
Body mass index
Average 26 26
Standard Deviation 13.617 3.875
Count 63 63
Standard Error 1.716 0.488
z-value for 90% CI 1.645 1.645
Margin of Error 2.822 0.803
Lower Limit 23.194 25.022
Upper Limit 28.838 26.629
From the above table it is found that:
The average distance between residence is 26.
The standard deviation of distance between residence is 13.617.
The 90% CI of average distance between residence is 23.194 and 28.838.
The average for Body Mass Index is 26.
The standard deviation for Body Mass Index is 3.875
The 90% CI of average for Body Mass Index is 25.022 and 26.629.
Distance from Residence to Work
Limits Absenteeism time Below 10 hours Absenteeism time 10 hours or above
Lower
Limit 29.02486 23.19365
Upper
Limit 30.91015 28.8381
From the above table it is found that the 90% CI for distance from residence to work does not
overlap.
Body Mass Index
Limits Absenteeism time Below 10 hours Absenteeism time 10 hours or above
Lower
Limit 26.48343 25.02225
Upper 27.02913 26.62854

11STATISTICS FOR MANAGERIAL DECISIONS
Limit
From the above table it is found that the 90% CI for Body Mass Index overlaps.
Limit
From the above table it is found that the 90% CI for Body Mass Index overlaps.
⊘ This is a preview!⊘
Do you want full access?
Subscribe today to unlock all pages.
Trusted by 1+ million students worldwide
1 out of 12
Related Documents


Your All-in-One AI-Powered Toolkit for Academic Success.
+13062052269
info@desklib.com
Available 24*7 on WhatsApp / Email
![[object Object]](/_next/static/media/star-bottom.7253800d.svg)
Unlock your academic potential
Copyright © 2020–2026 A2Z Services. All Rights Reserved. Developed and managed by ZUCOL.