Statistics of Business & Finance: Stock Investment Recommendation
VerifiedAdded on 2022/11/13
|8
|1191
|326
Project
AI Summary
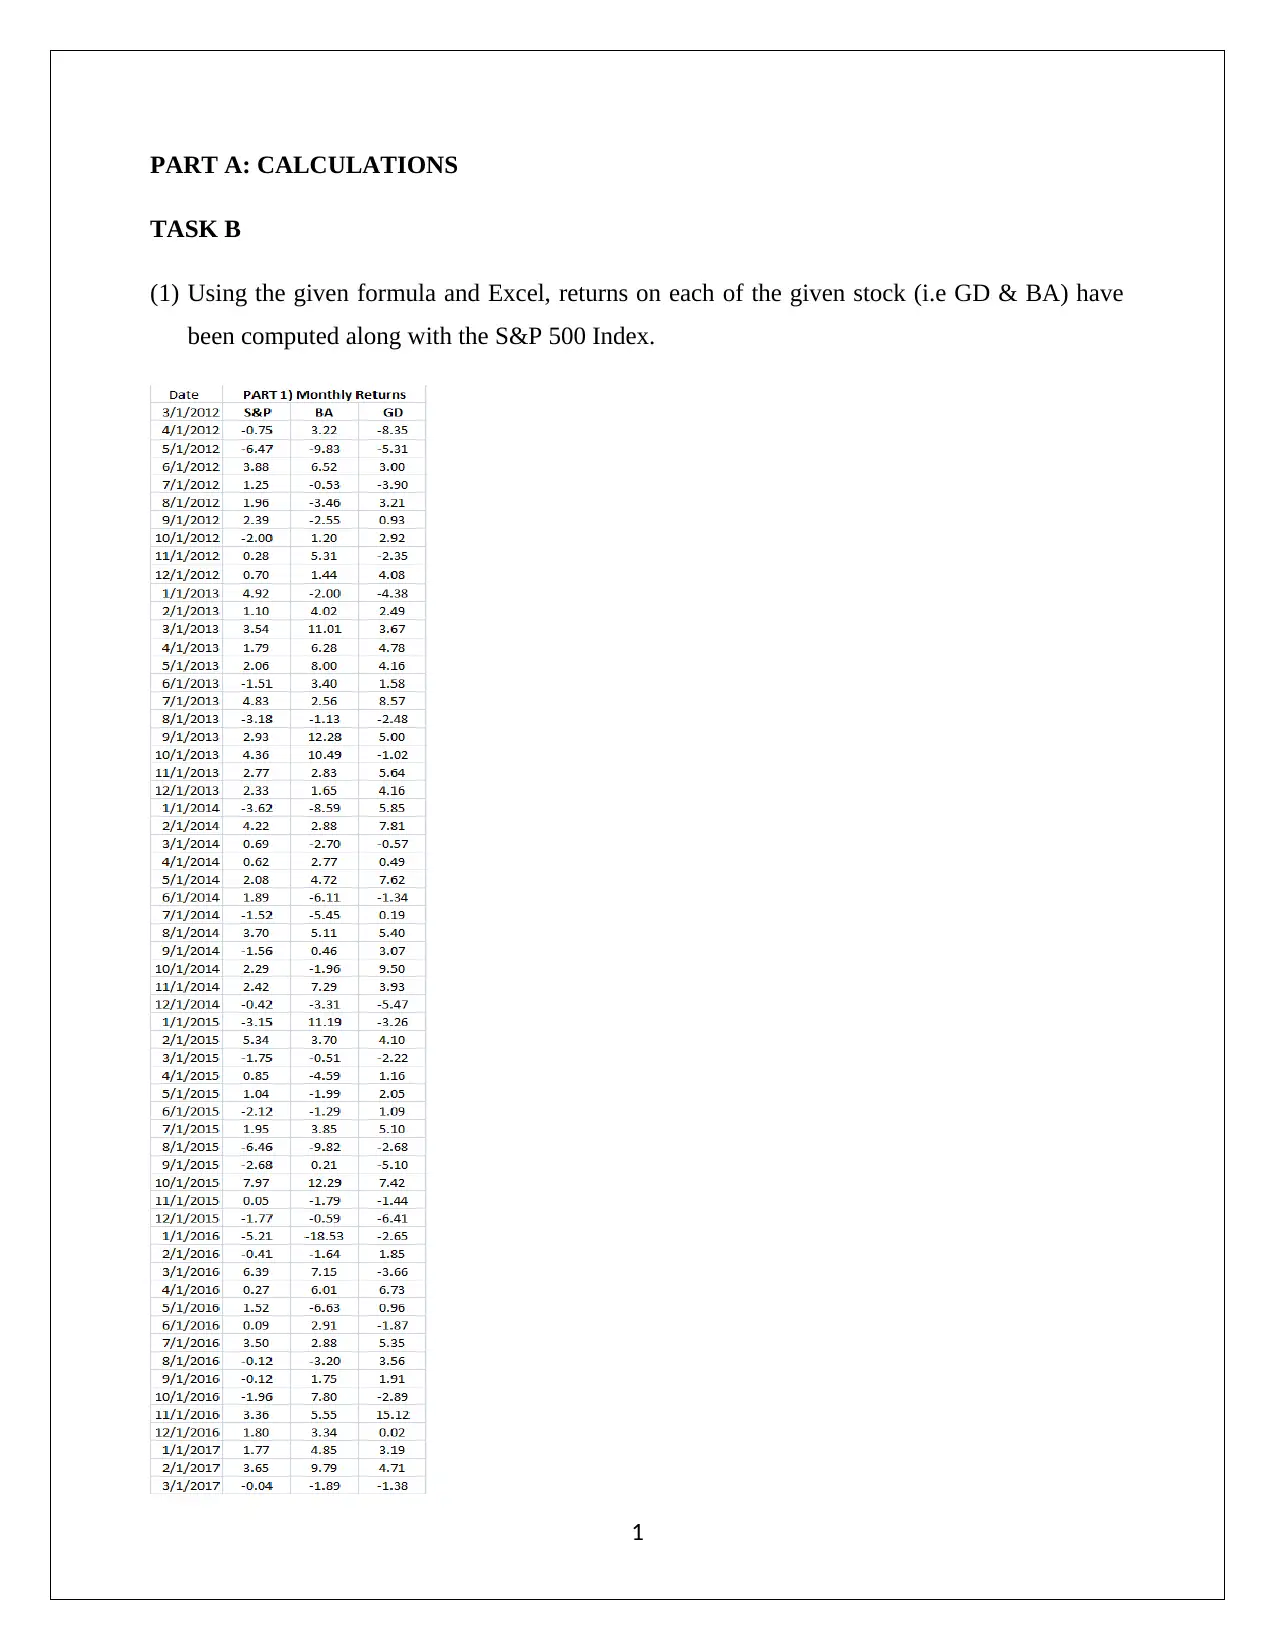
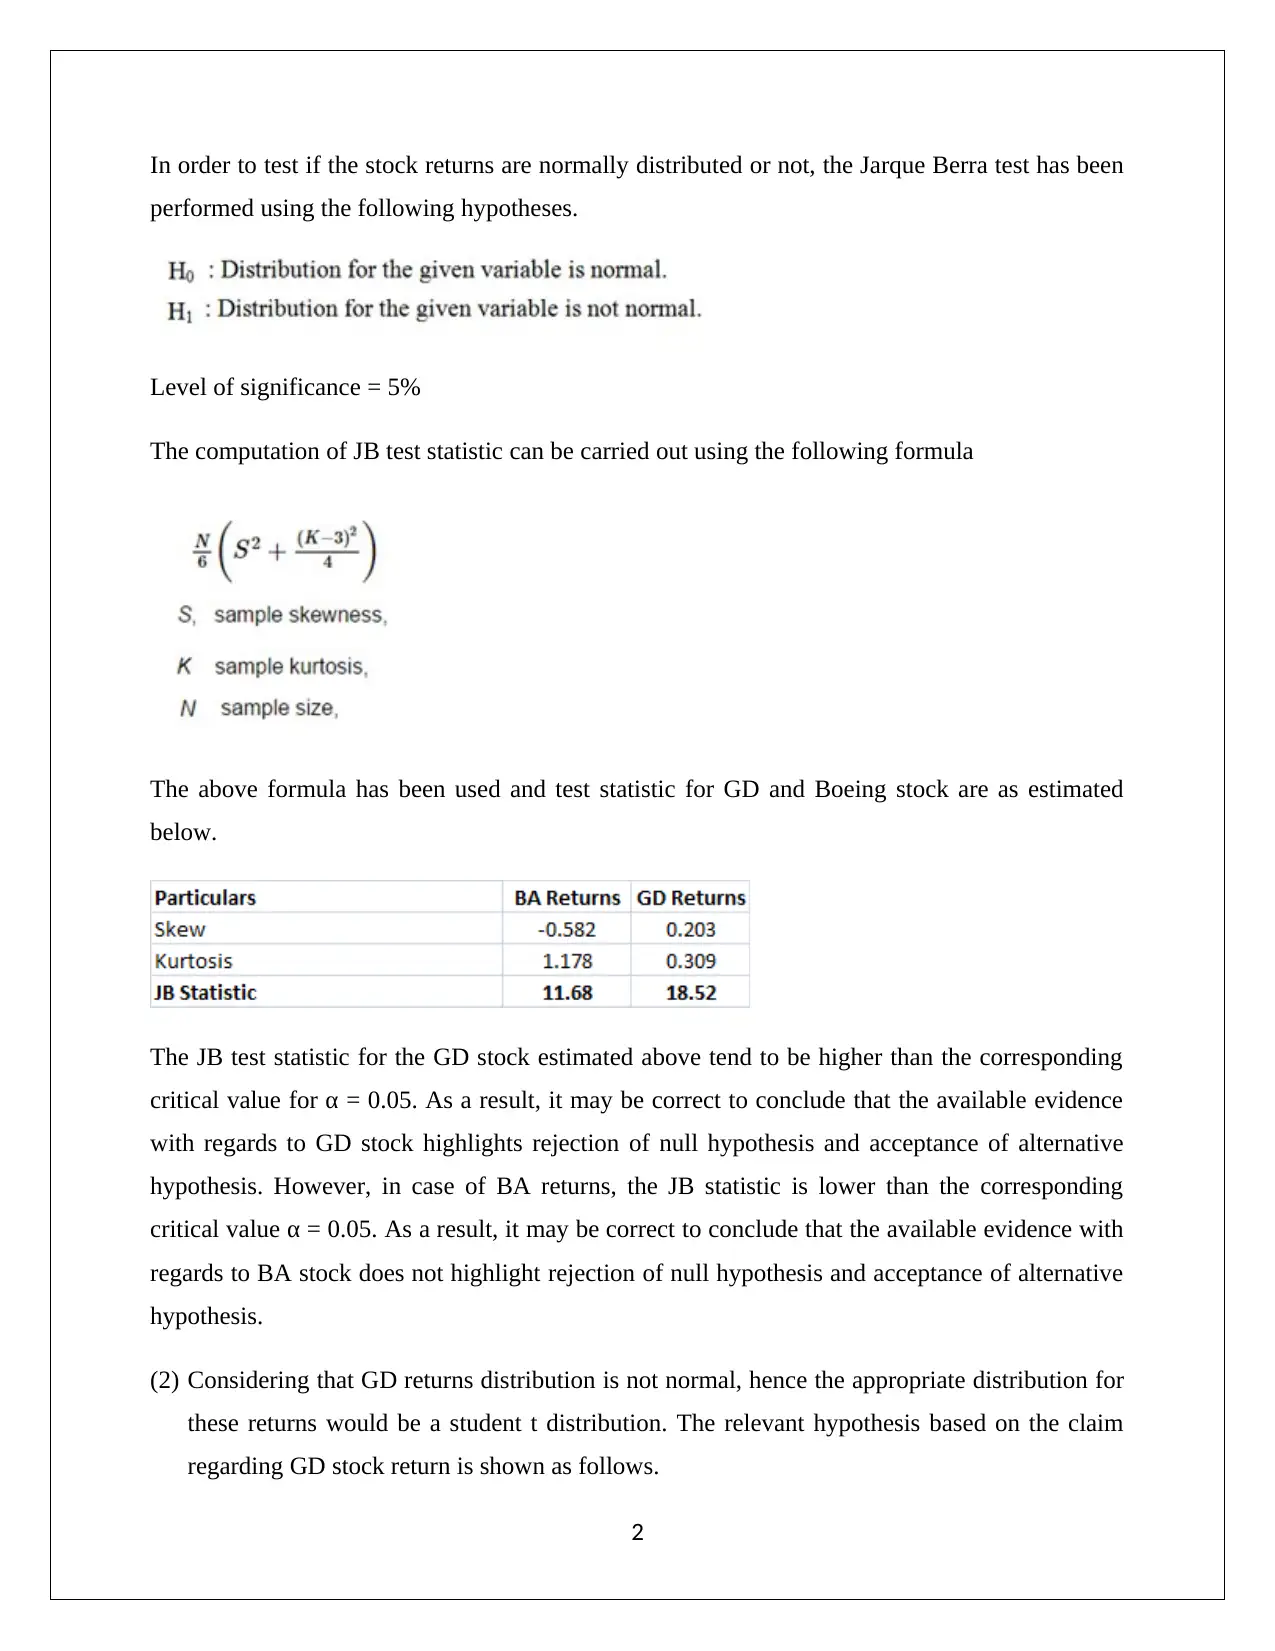
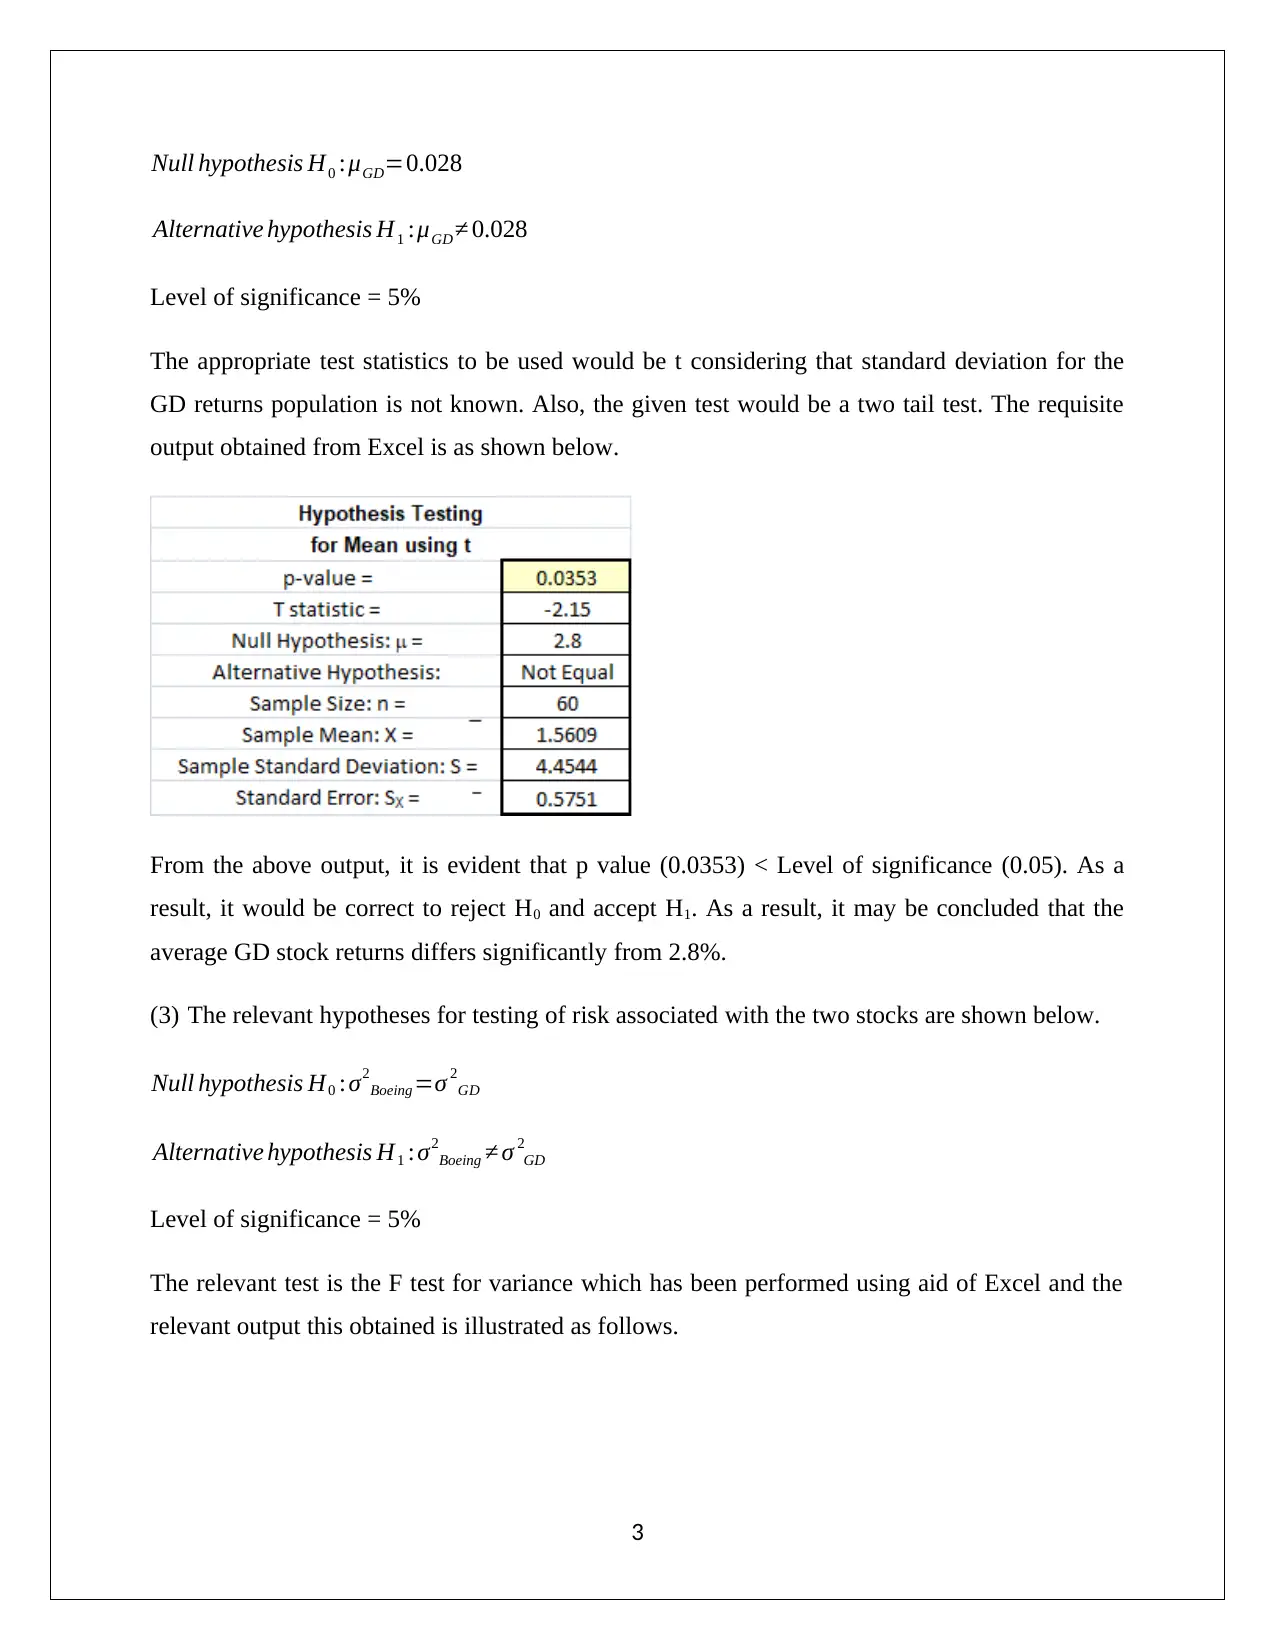
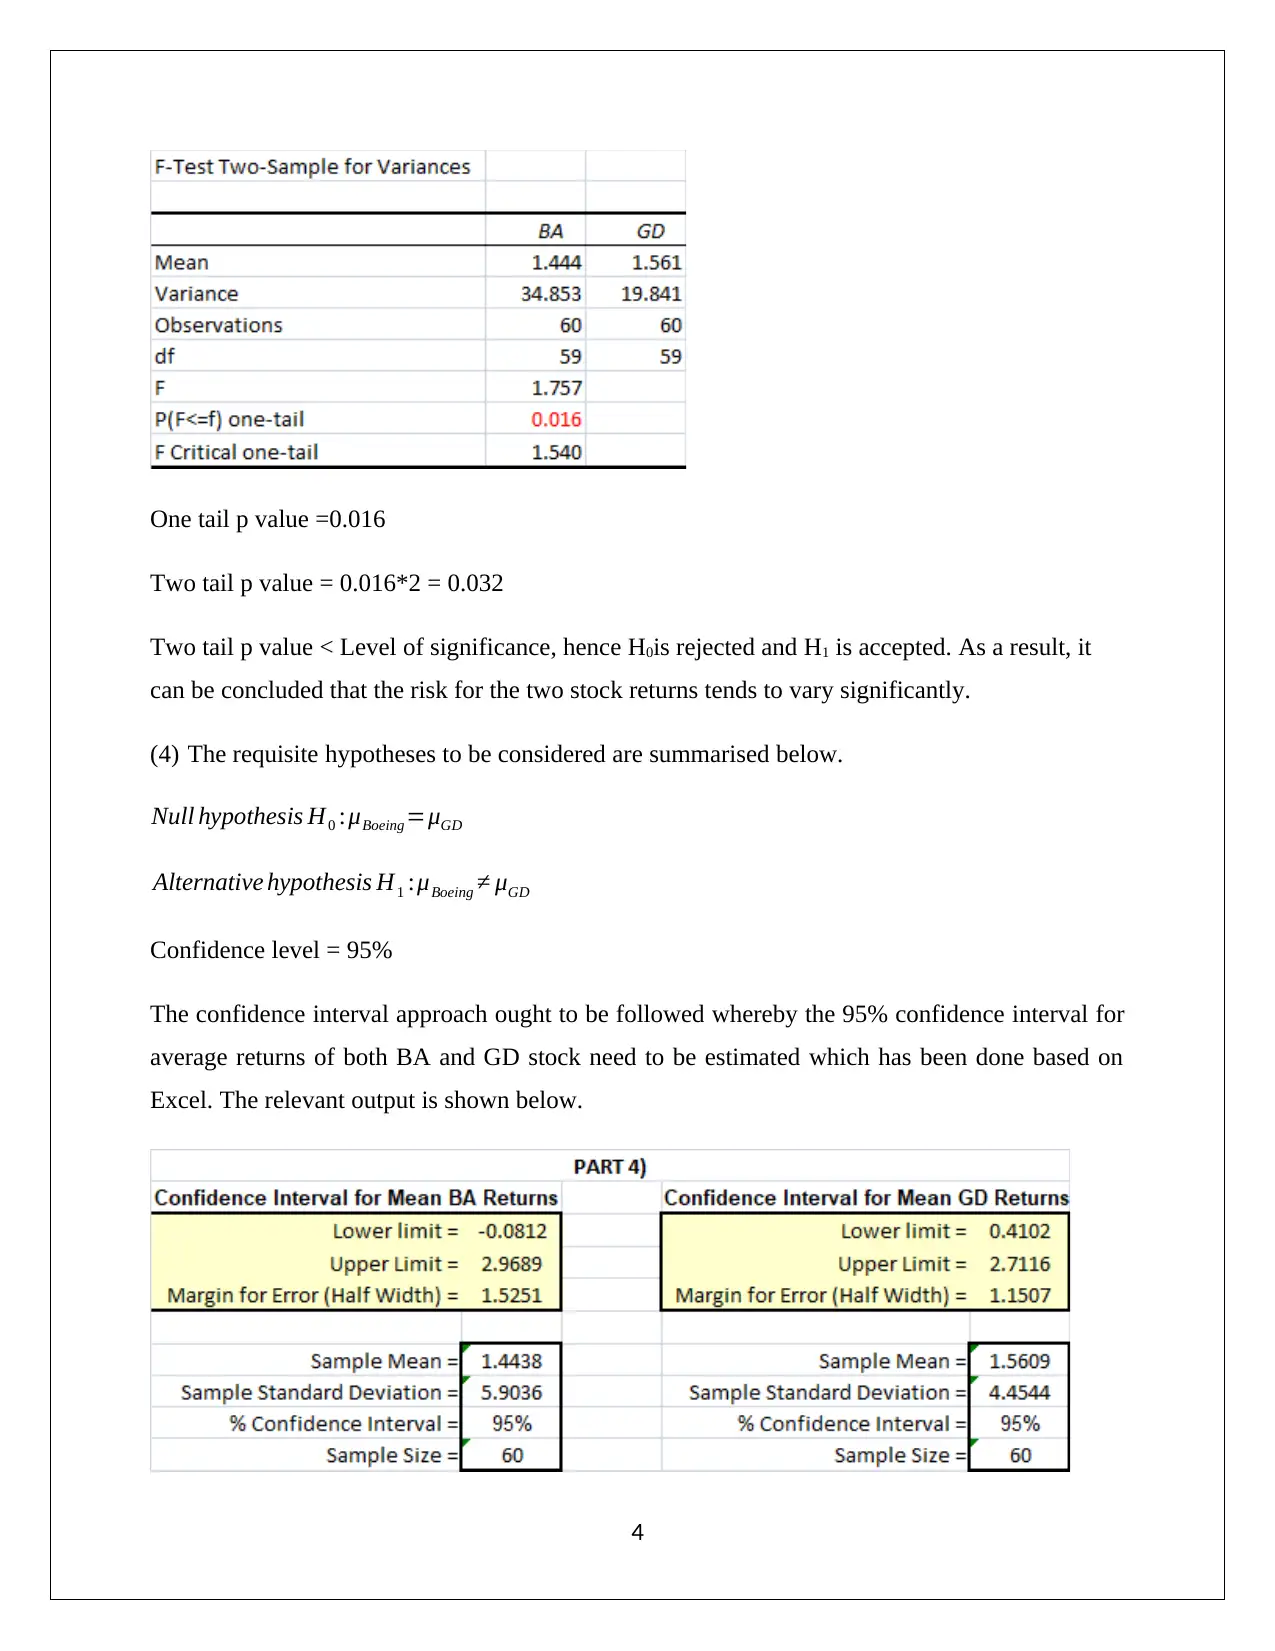
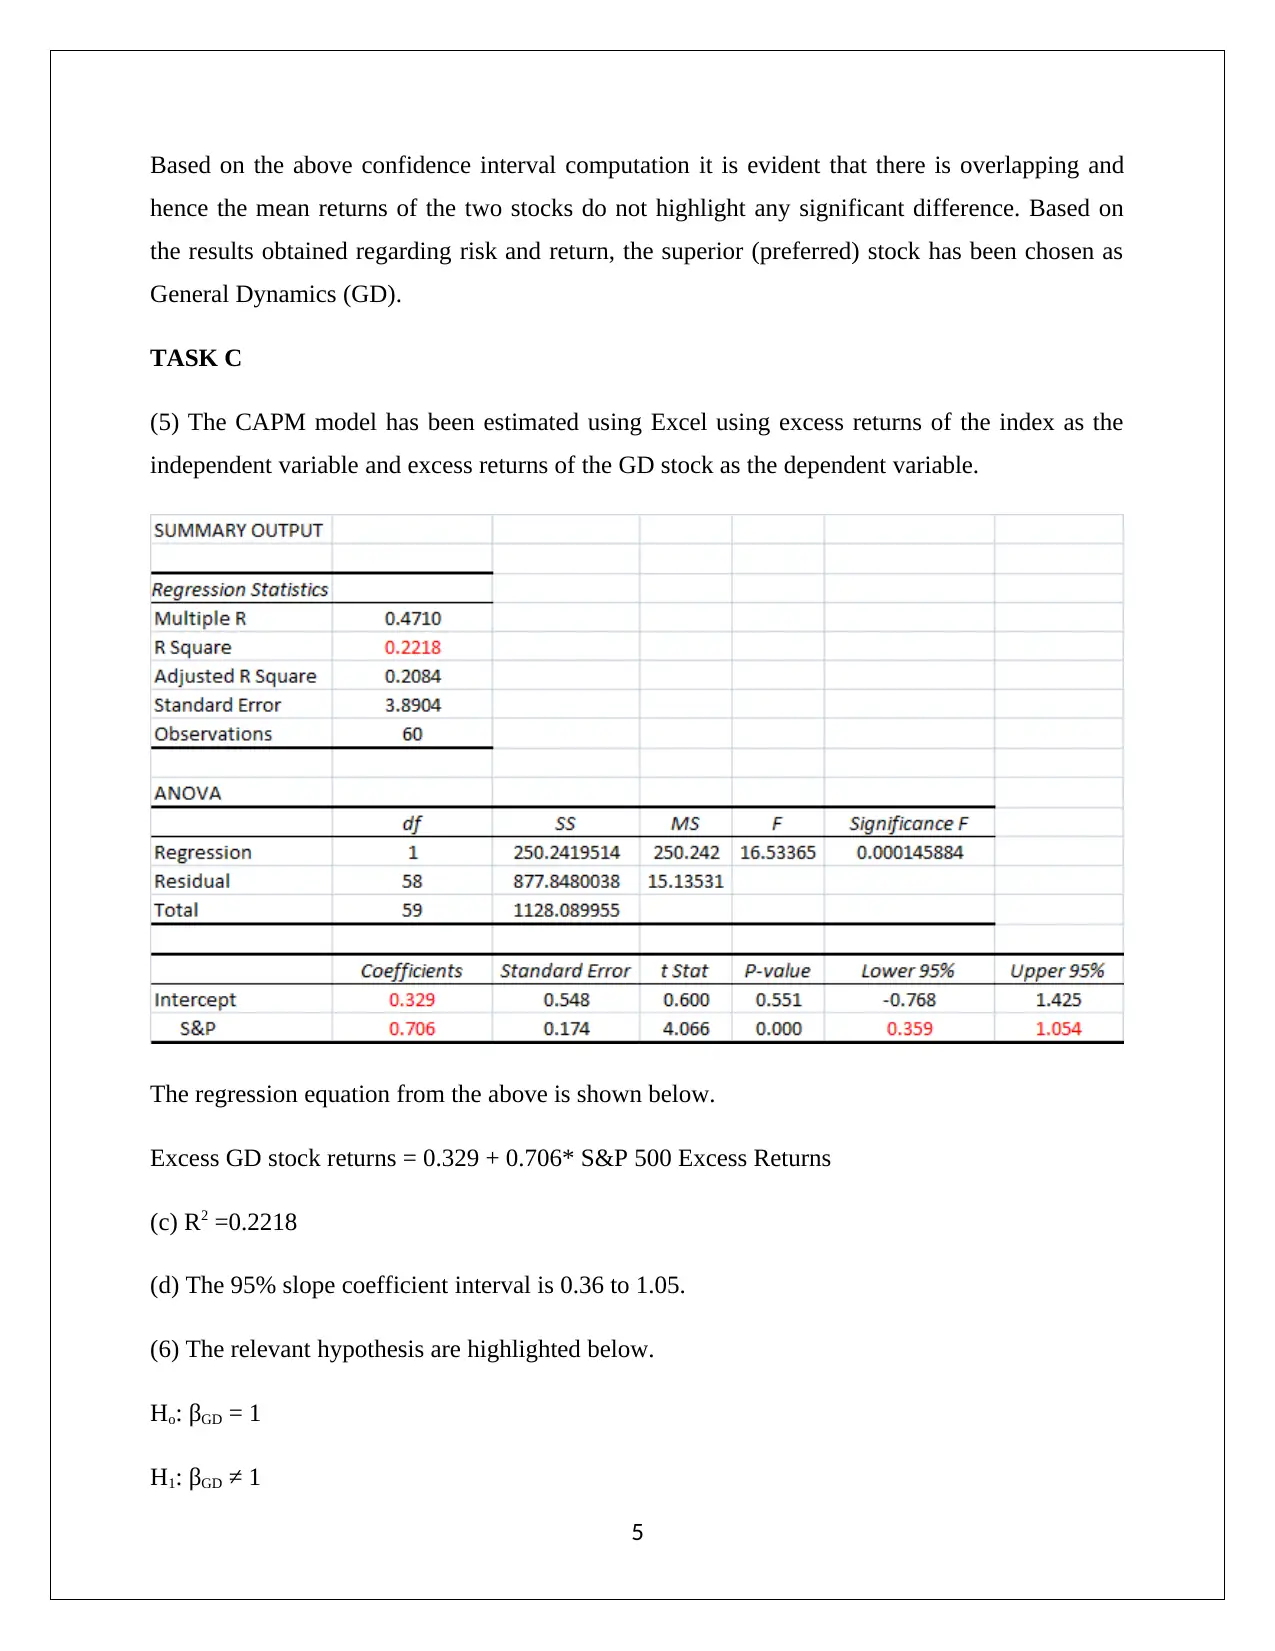
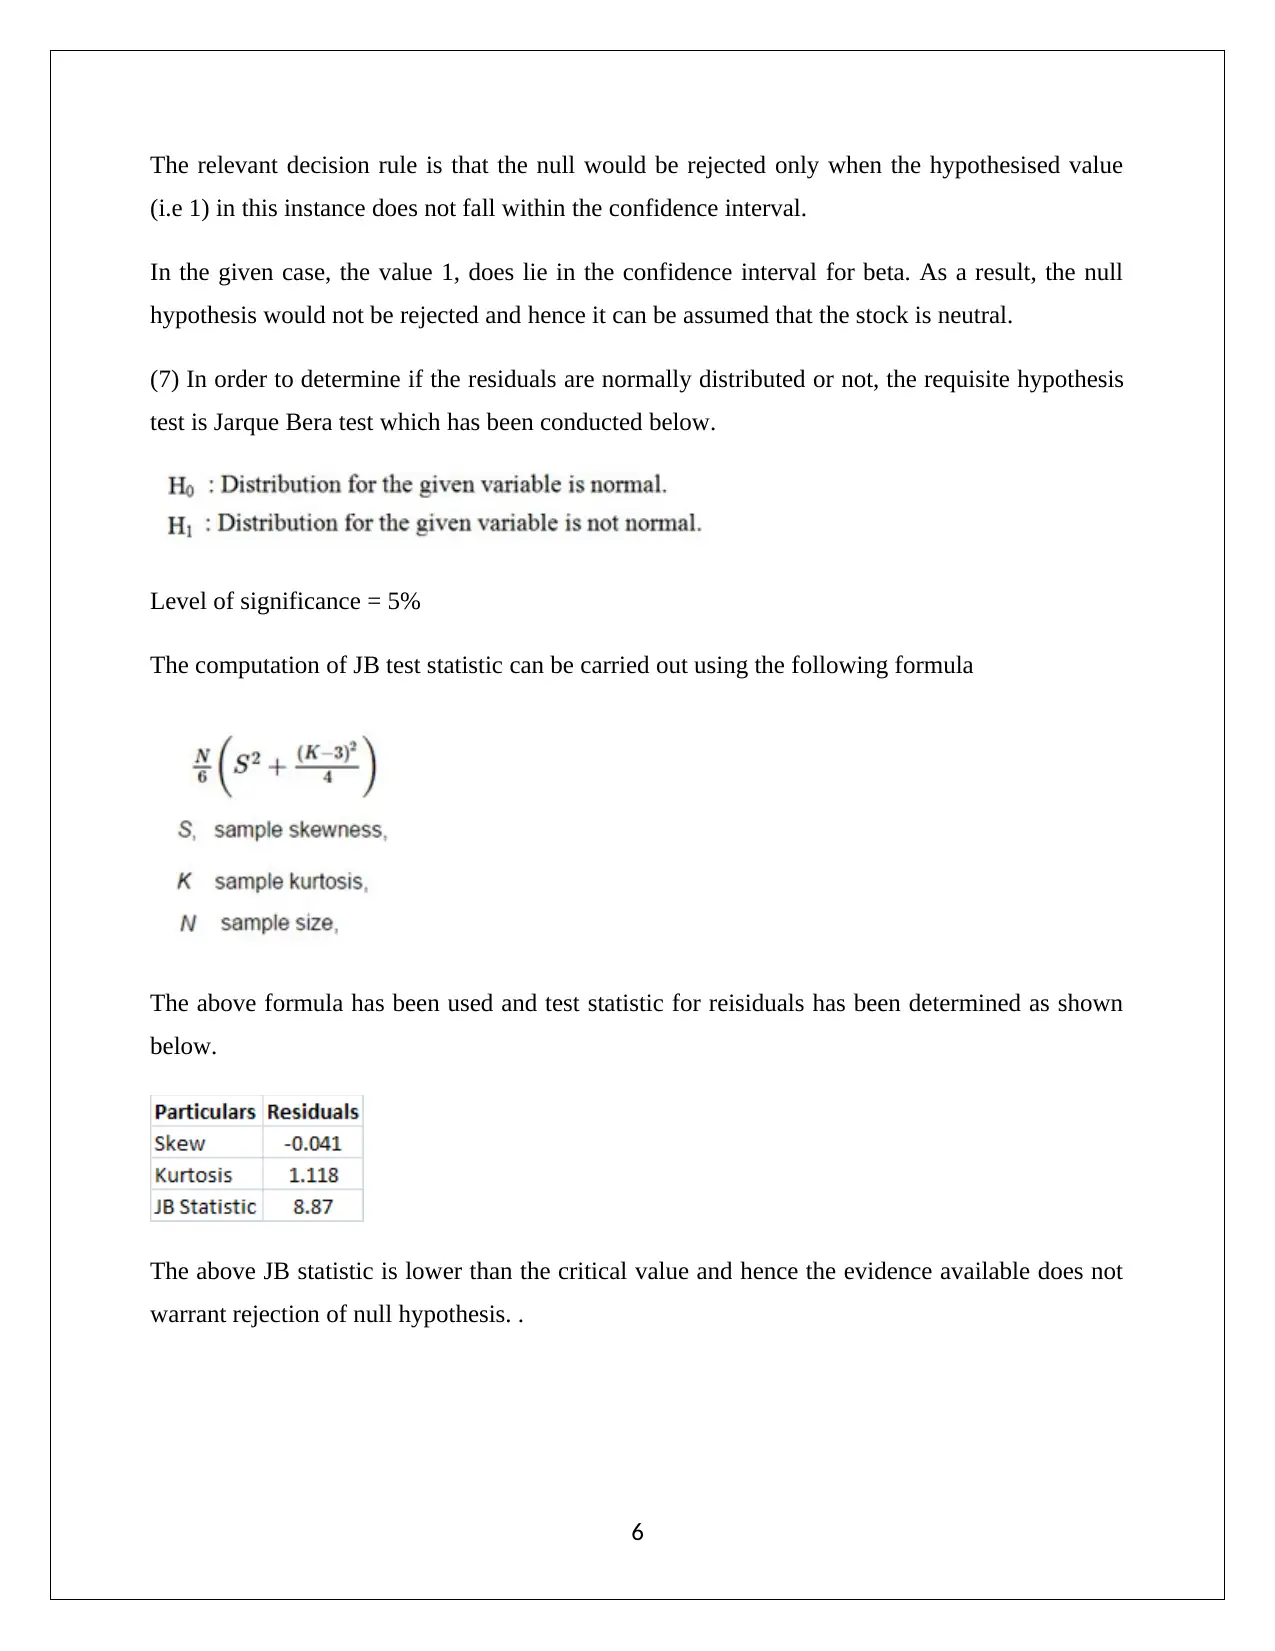
This project analyzes the risk and return characteristics of two stocks, GD and BA, using statistical methods. The analysis includes calculating stock returns, performing the Jarque-Bera test to assess normality, conducting hypothesis tests on average returns and variances, and constructing confidence intervals. The Capital Asset Pricing Model (CAPM) is employed to estimate the beta of GD stock. The project concludes with a comparison of the stocks based on risk and return, recommending GD as the preferred investment due to its lower risk profile despite similar returns. The student's analysis includes interpretation of statistical outputs, such as p-values and R-squared, to inform investment decisions.

1 out of 8
Related Documents


Your All-in-One AI-Powered Toolkit for Academic Success.
+13062052269
info@desklib.com
Available 24*7 on WhatsApp / Email
![[object Object]](/_next/static/media/star-bottom.7253800d.svg)
Copyright © 2020–2026 A2Z Services. All Rights Reserved. Developed and managed by ZUCOL.