University Statistics of Management Analysis Report - Module 1
VerifiedAdded on 2020/06/05
|22
|4330
|43
Report
AI Summary
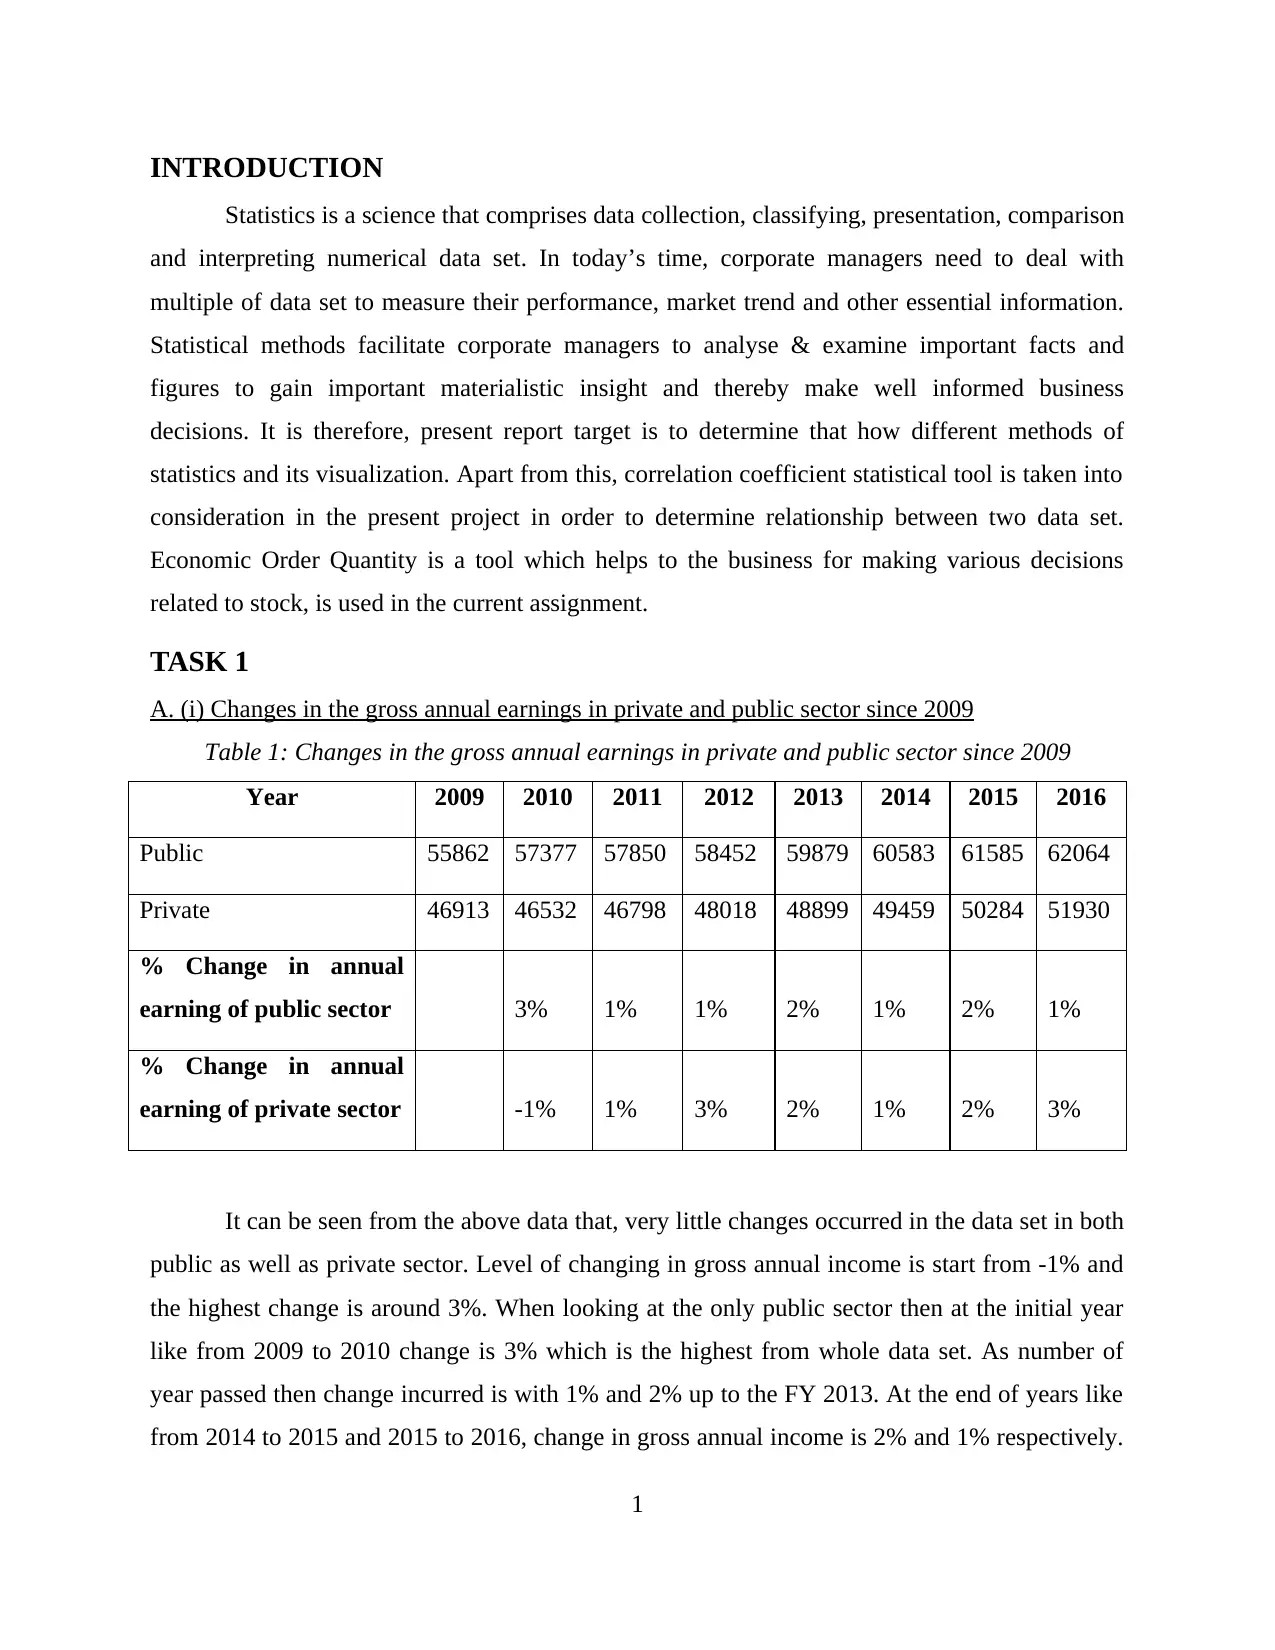
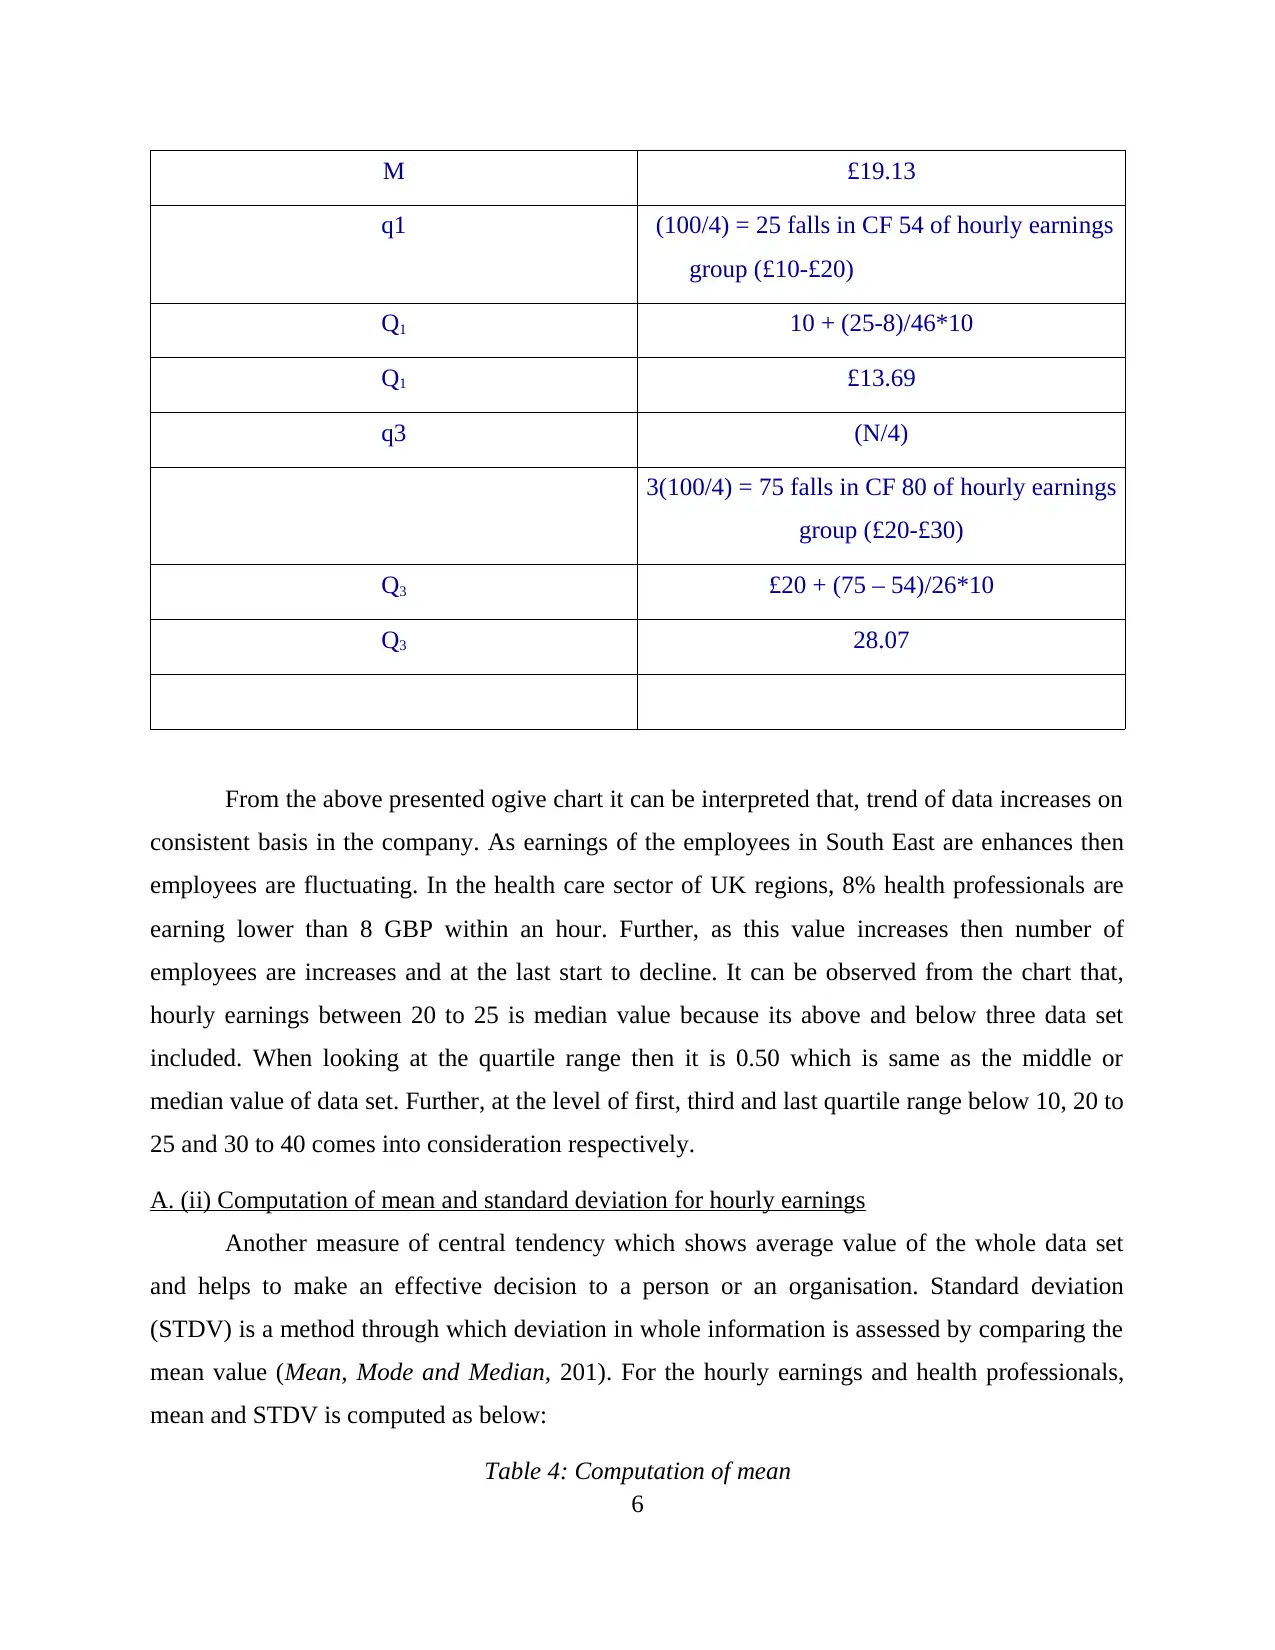
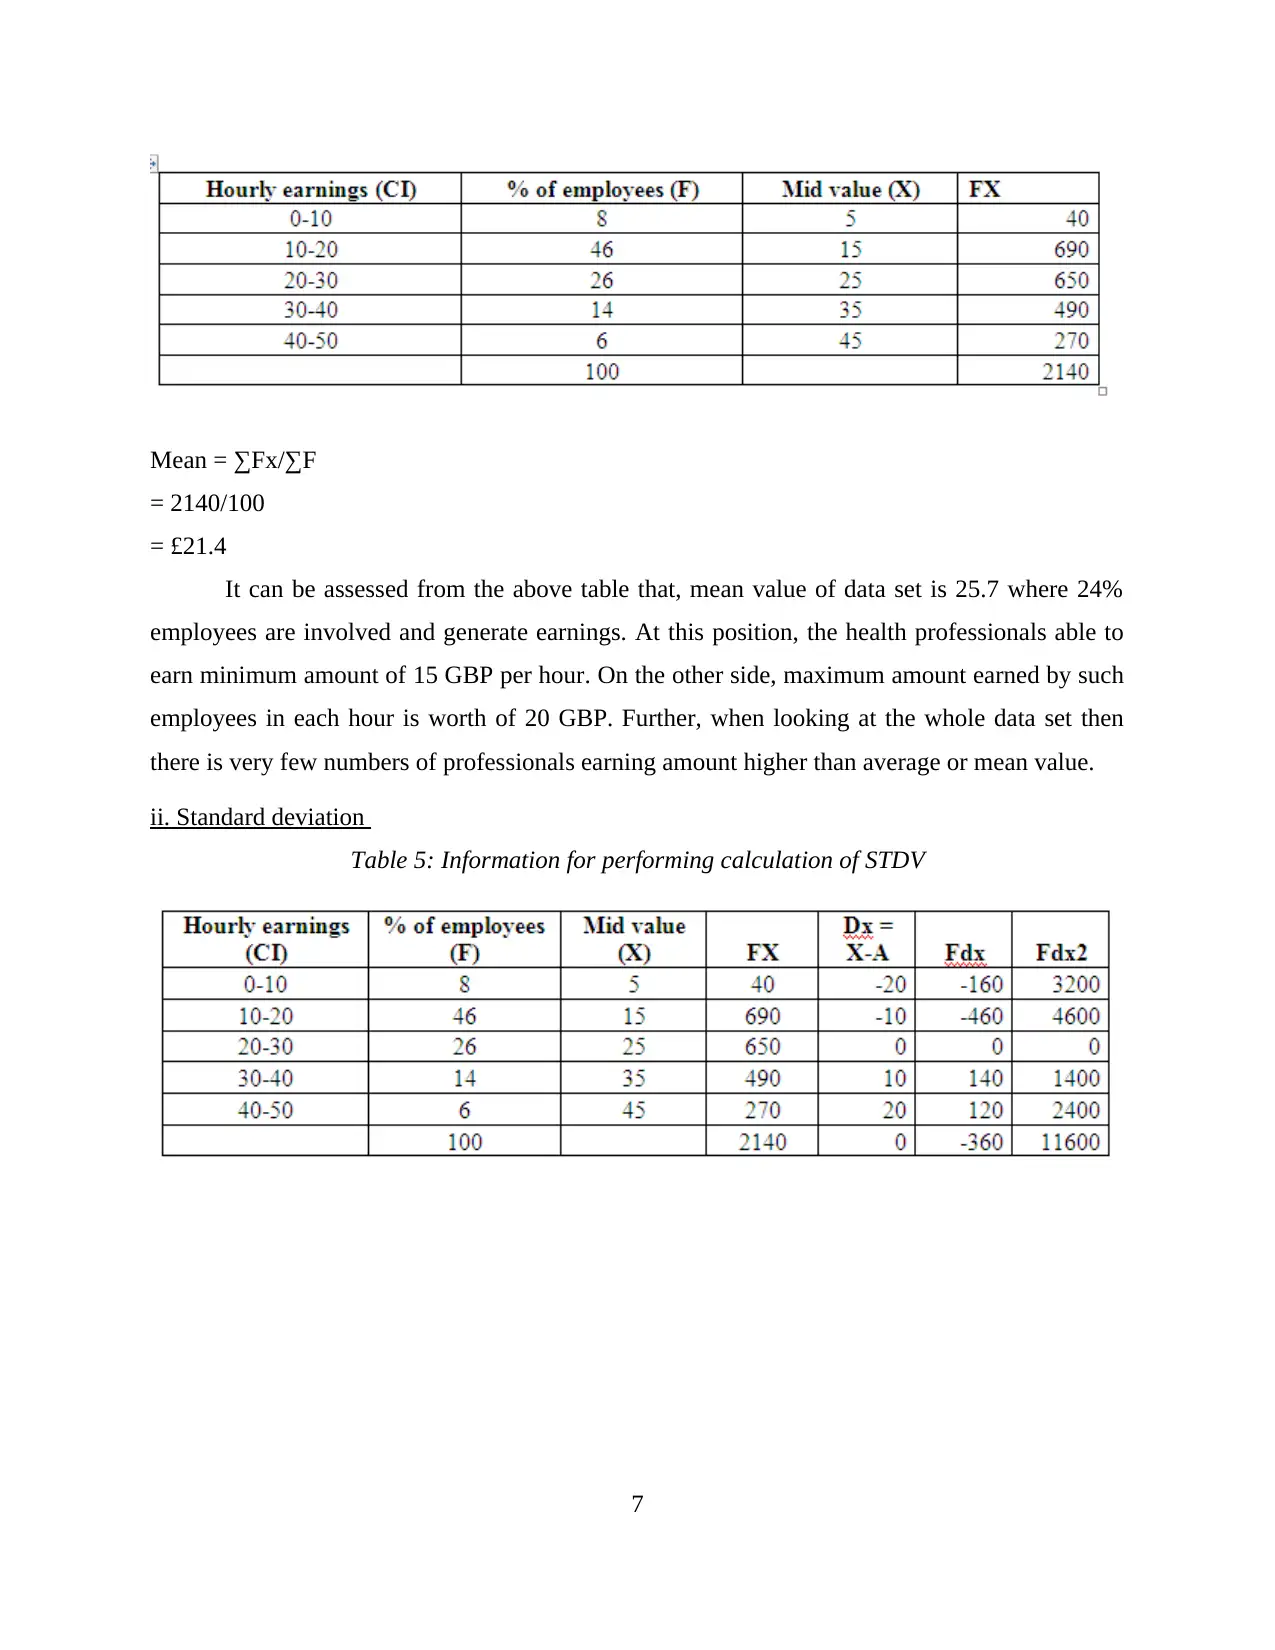
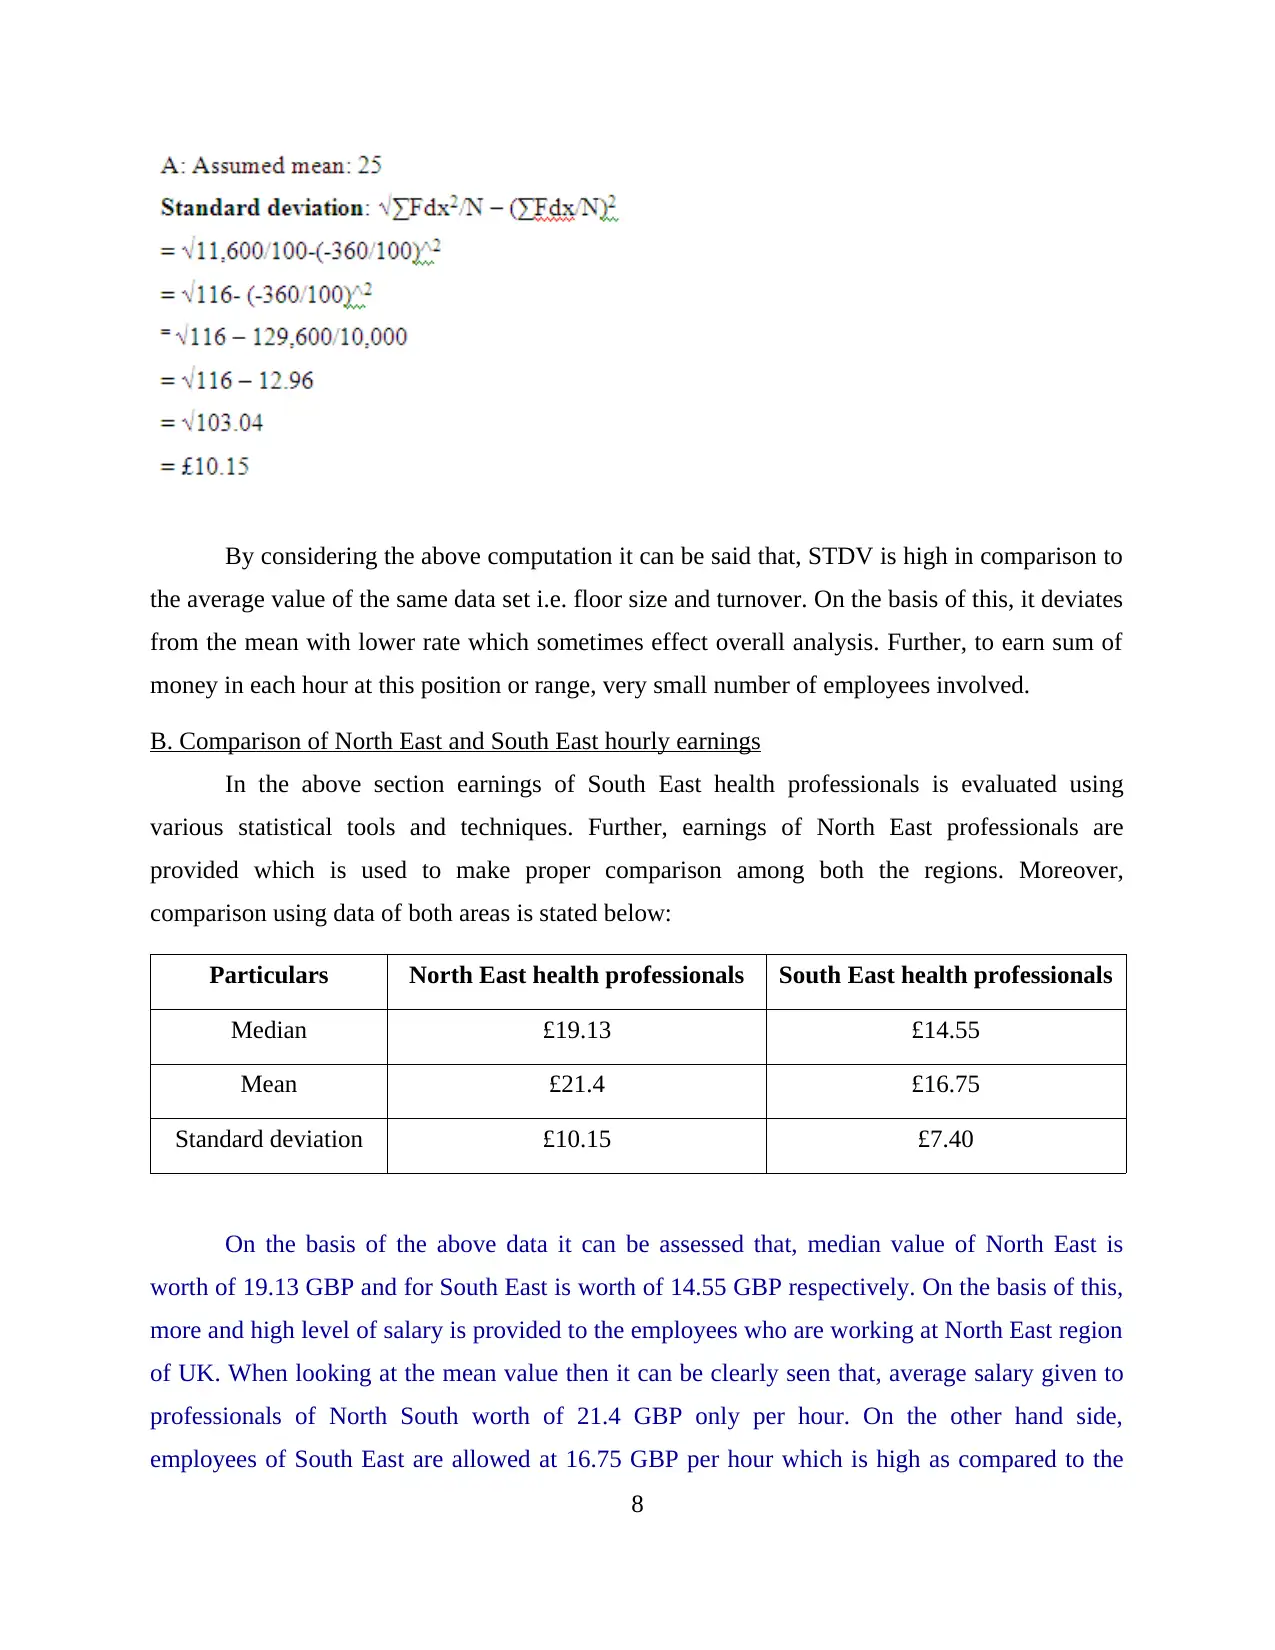
This report provides a comprehensive analysis of statistical data, covering various aspects of management statistics. It begins with an examination of changes in gross annual earnings in the public and private sectors, including the gap between male and female earnings, using tables and illustrations. The report then delves into creating an Ogive graph to estimate median hourly earnings and quartiles, followed by the computation of mean and standard deviation for hourly earnings. A comparison of hourly earnings between the North East and South East regions is also presented. Furthermore, the report explores the relationship between floor area and turnover using scatter diagrams, line of best fit equations, and correlation coefficients. The Economic Order Quantity (EOQ) is calculated, and the impact of changes in EOQ on costs is analyzed. The report concludes with scatter diagrams and line charts illustrating the relationship between size and turnover. The report utilizes various statistical tools and techniques to provide valuable insights into the data.

1 out of 22
Related Documents


Your All-in-One AI-Powered Toolkit for Academic Success.
+13062052269
info@desklib.com
Available 24*7 on WhatsApp / Email
![[object Object]](/_next/static/media/star-bottom.7253800d.svg)
Copyright © 2020–2026 A2Z Services. All Rights Reserved. Developed and managed by ZUCOL.