Statistics Homework Assignment: Probability and Data Analysis
VerifiedAdded on 2023/06/03
|4
|696
|492
Homework Assignment
AI Summary
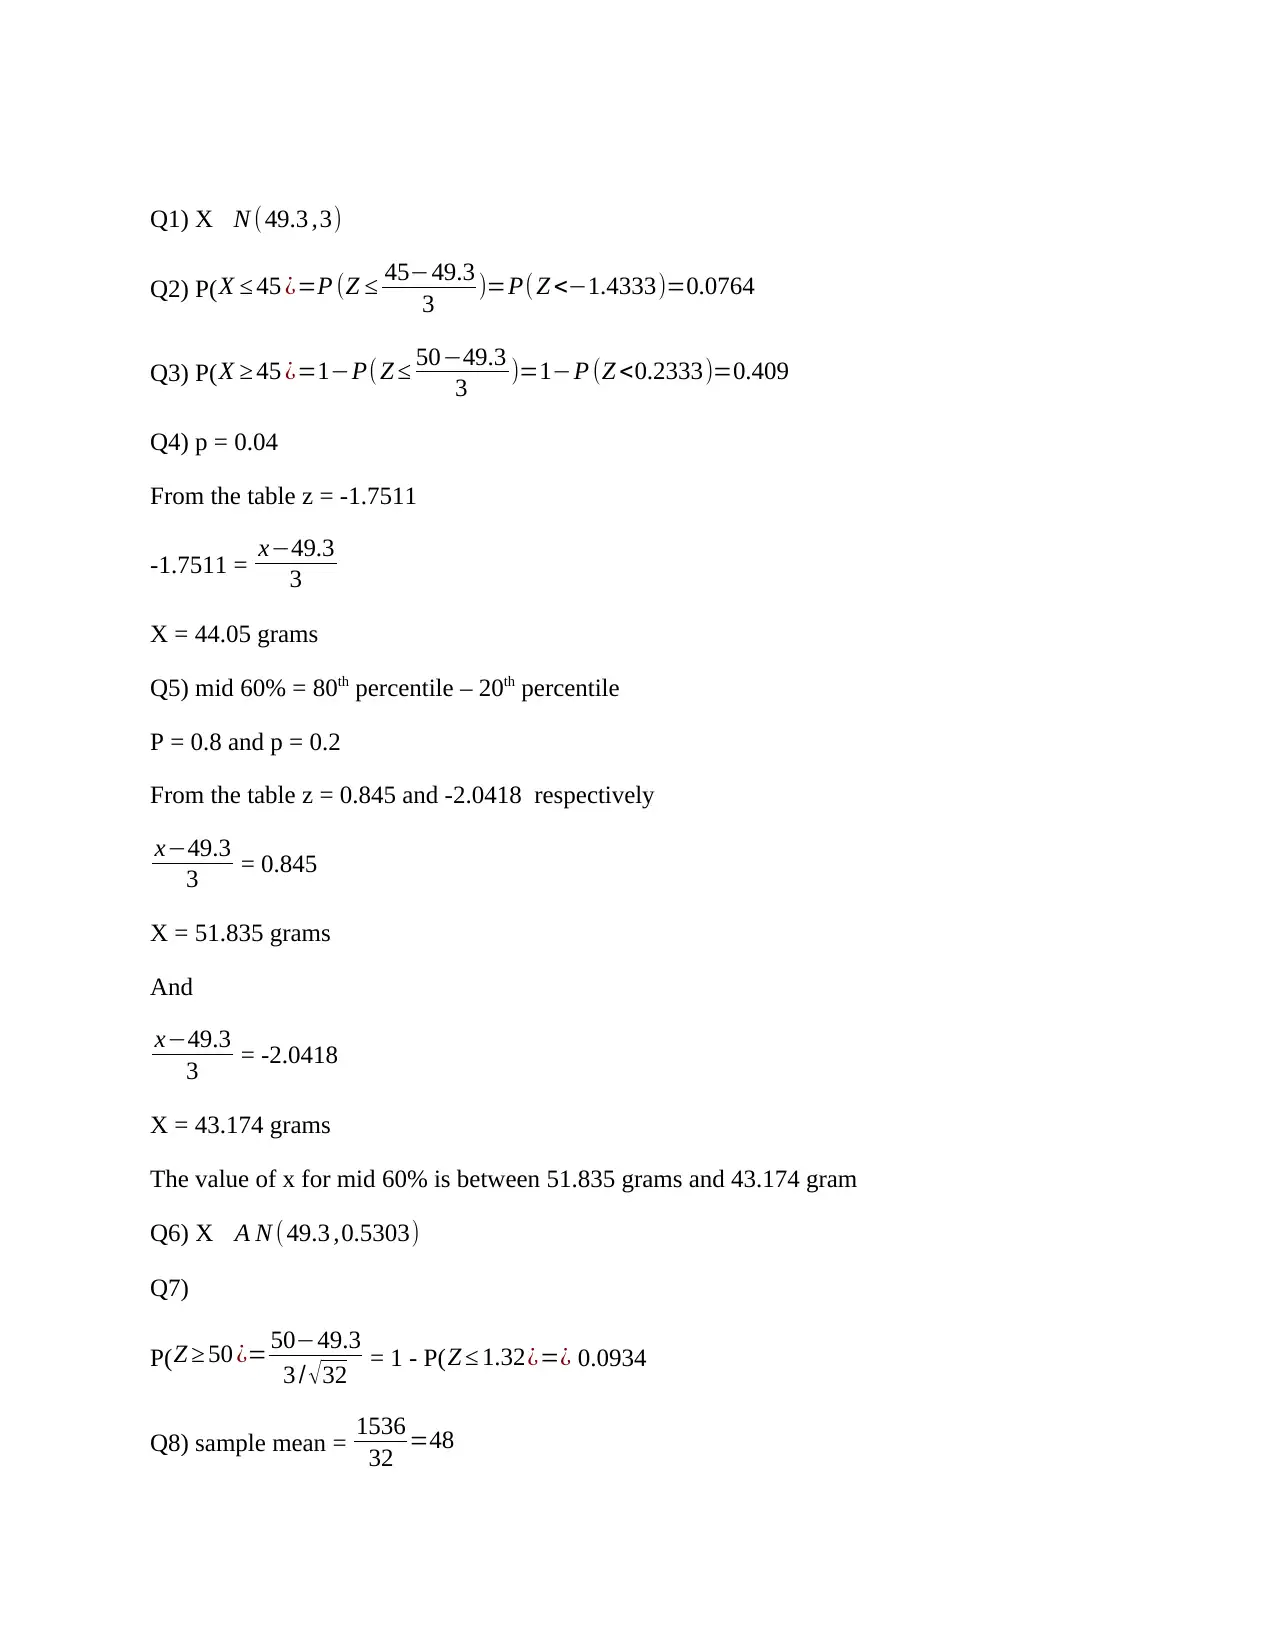
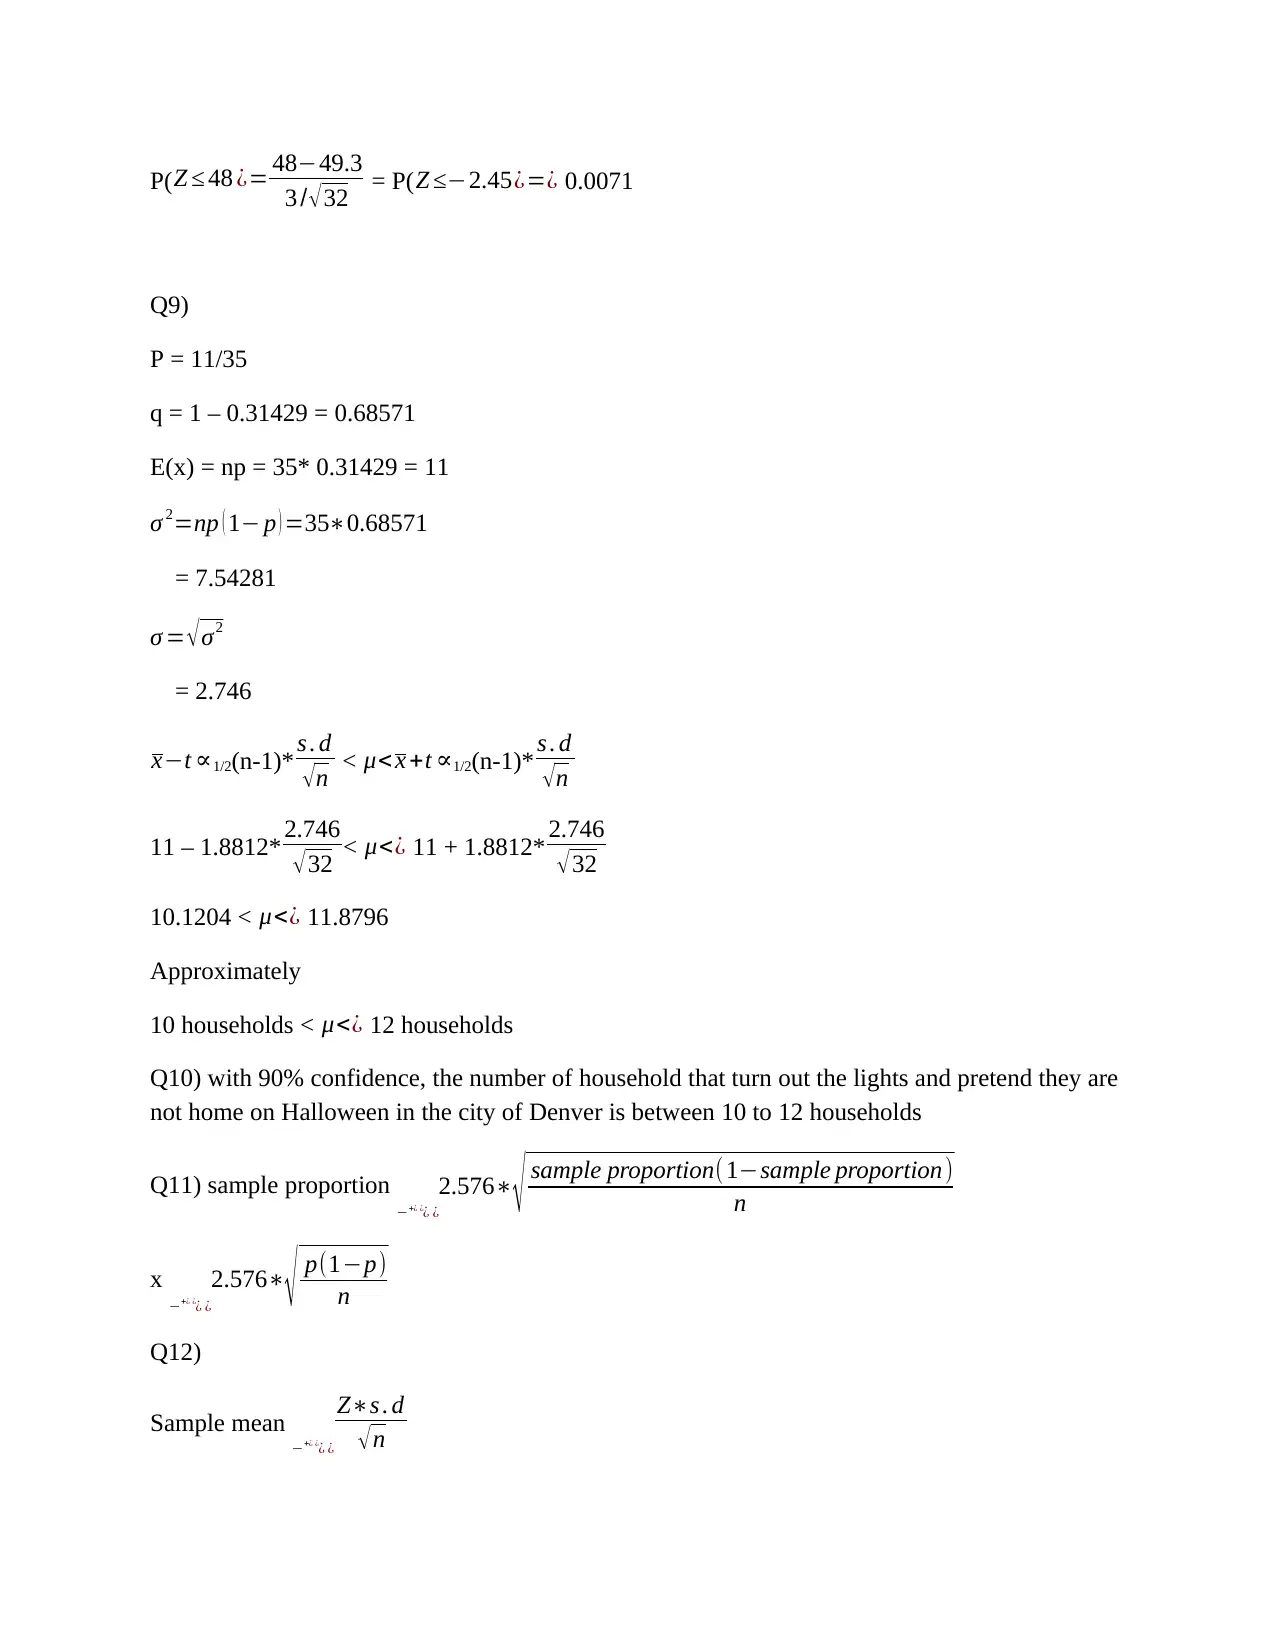
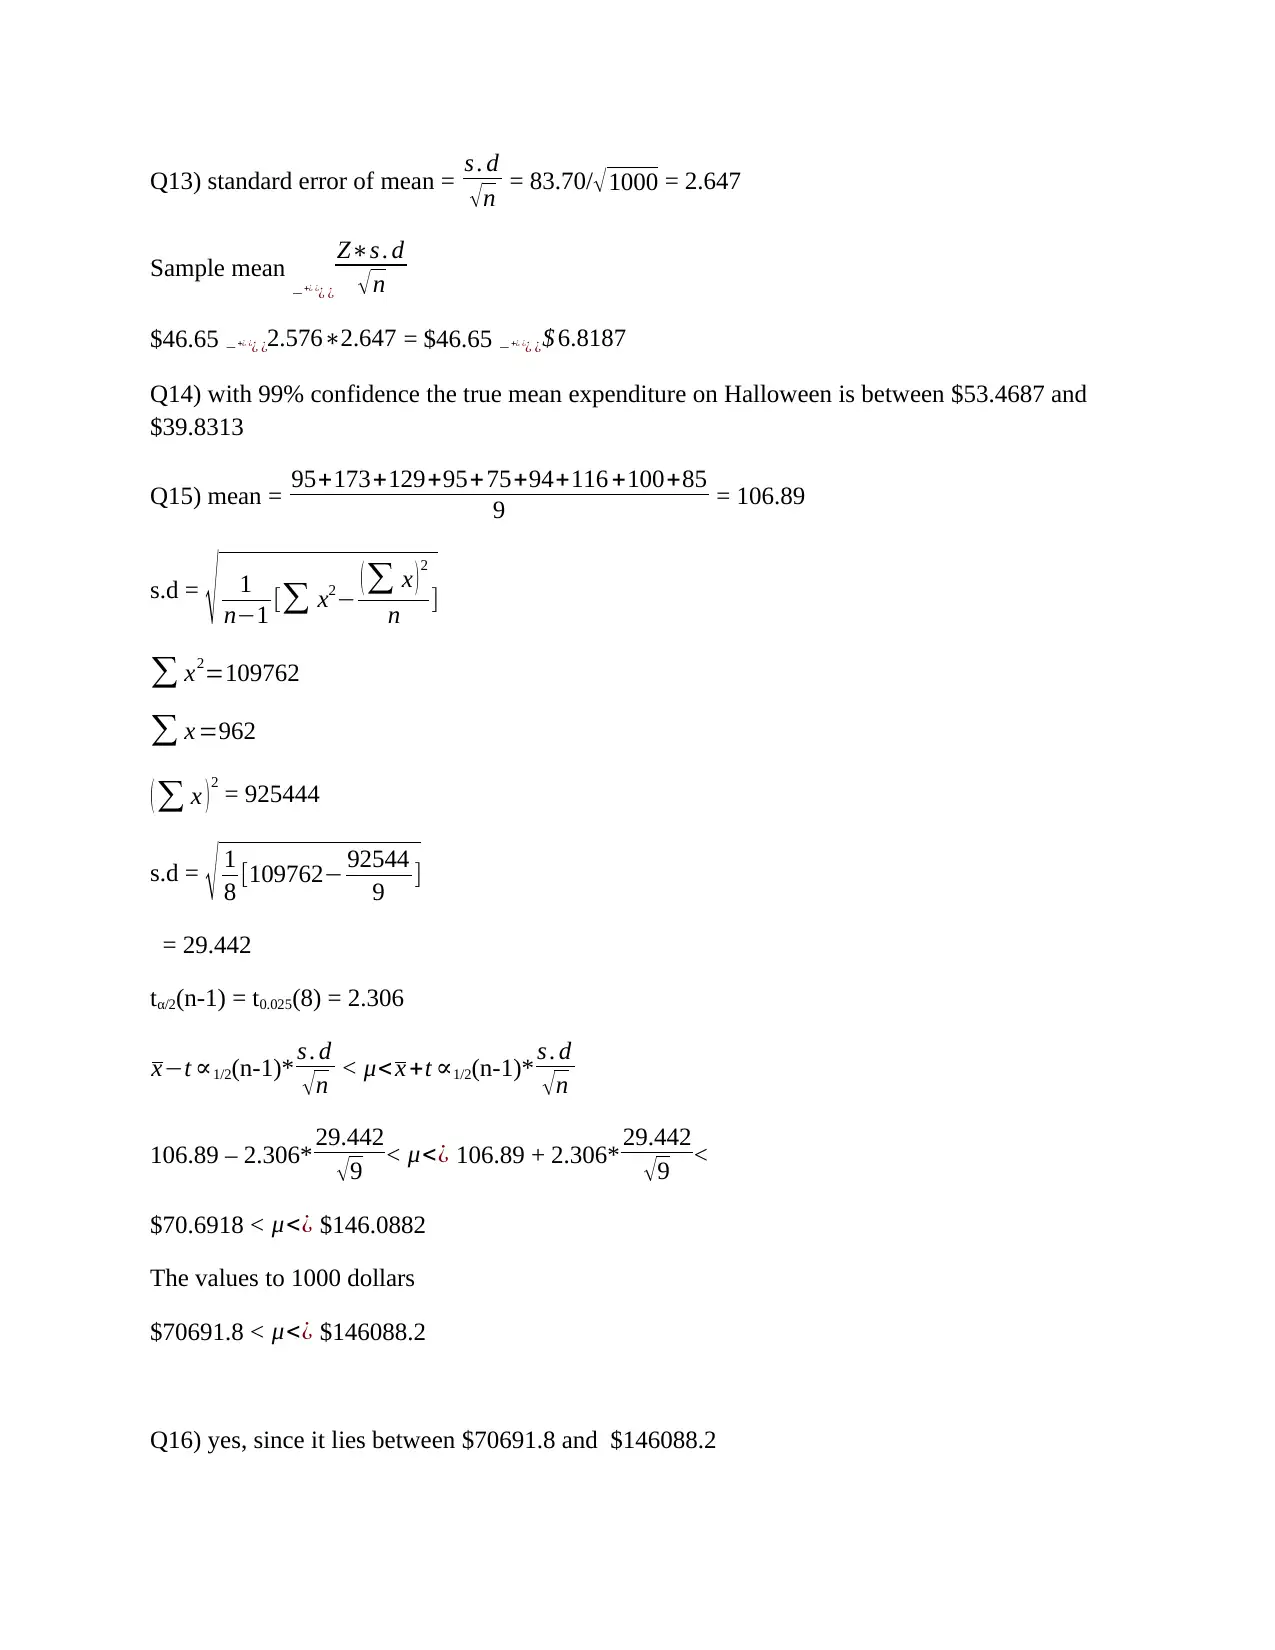
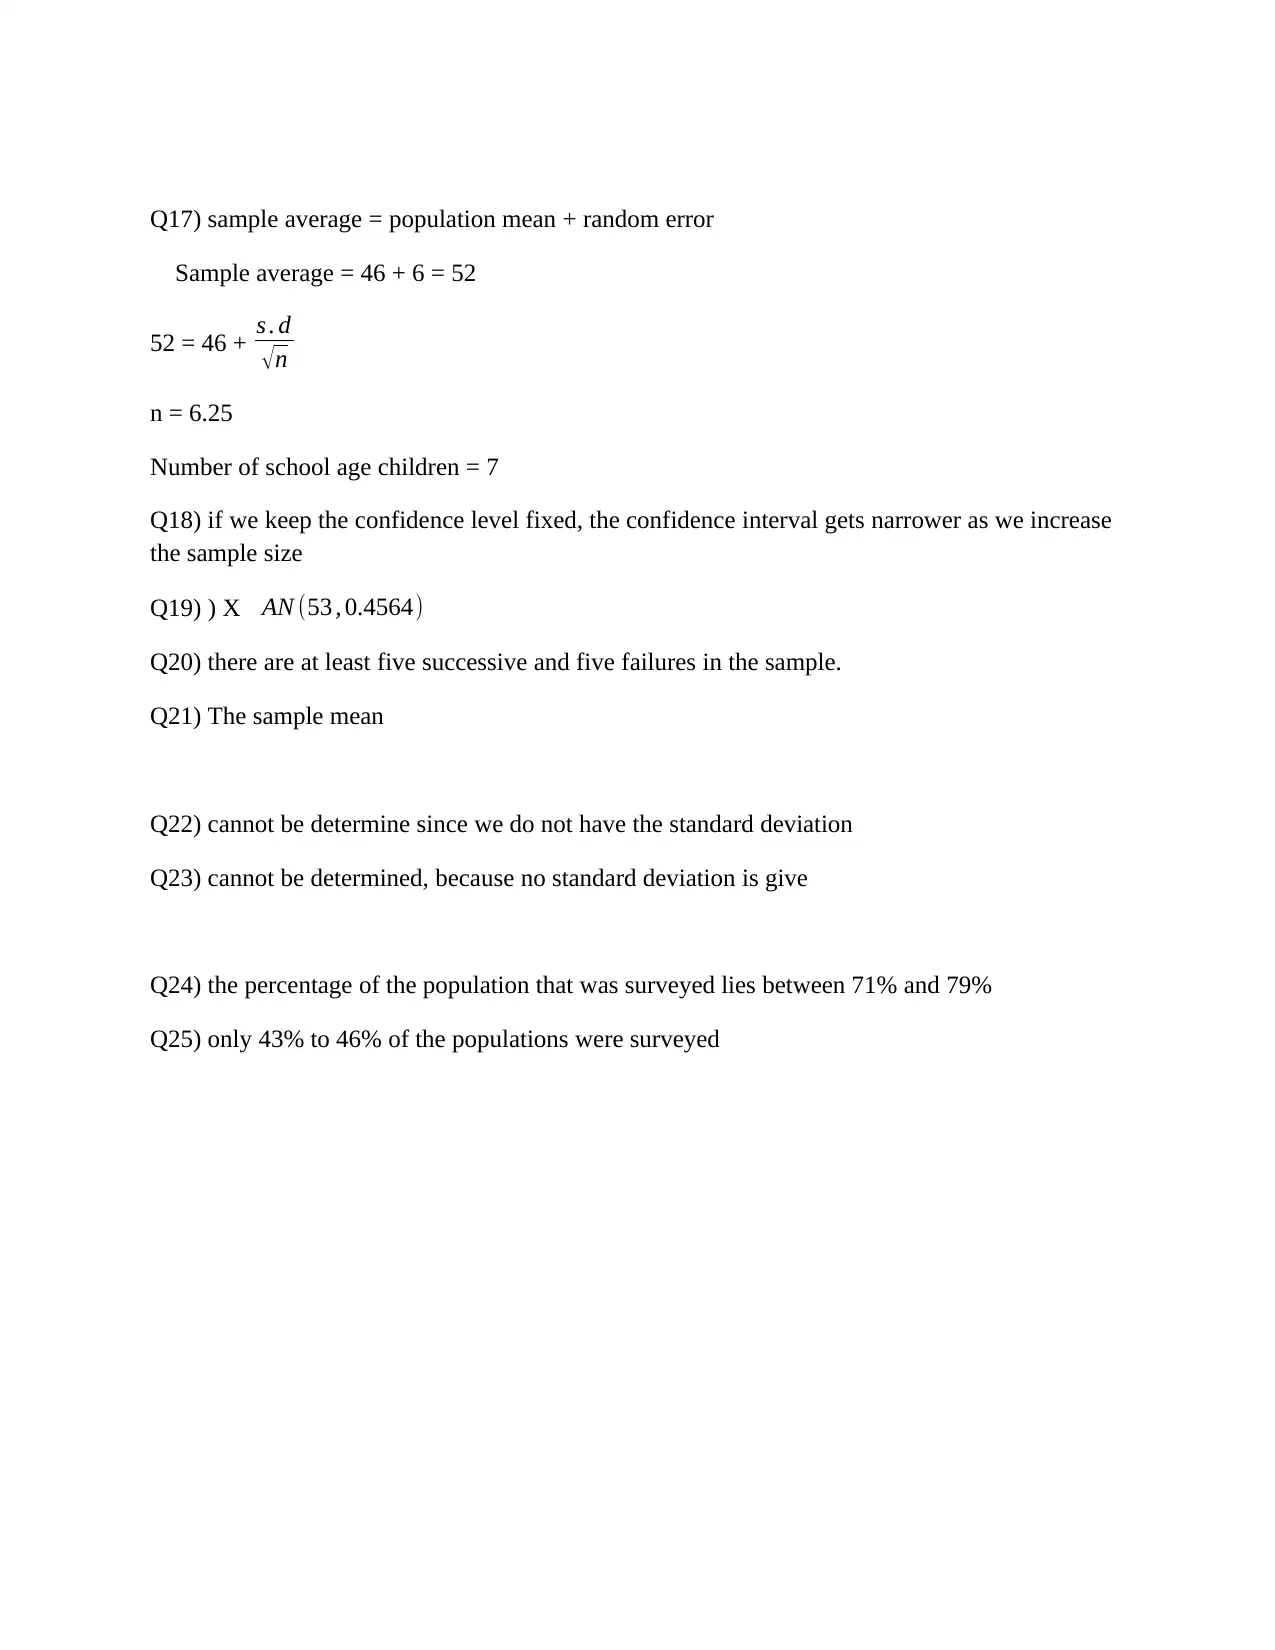
This statistics homework assignment covers a range of topics, including probability distributions, confidence intervals, and hypothesis testing. The solutions provided address problems related to calculating probabilities using normal distributions, determining confidence intervals for population mean...

Q1) X N (49.3 ,3)
Q2) P(X ≤ 45 ¿=P (Z ≤ 45−49.3
3 )=P( Z <−1.4333)=0.0764
Q3) P(X ≥ 45 ¿=1−P( Z ≤ 50−49.3
3 )=1−P (Z <0.2333)=0.409
Q4) p = 0.04
From the table z = -1.7511
-1.7511 = x−49.3
3
X = 44.05 grams
Q5) mid 60% = 80th percentile – 20th percentile
P = 0.8 and p = 0.2
From the table z = 0.845 and -2.0418 respectively
x−49.3
3 = 0.845
X = 51.835 grams
And
x−49.3
3 = -2.0418
X = 43.174 grams
The value of x for mid 60% is between 51.835 grams and 43.174 gram
Q6) X A N ( 49.3 ,0.5303)
Q7)
P(Z ≥ 50 ¿= 50−49.3
3 / √32 = 1 - P(Z ≤ 1.32¿=¿ 0.0934
Q8) sample mean = 1536
32 =48
Paraphrase This Document
Need a fresh take? Get an instant paraphrase of this document with our AI Paraphraser

P(Z ≤ 48 ¿= 48−49.3
3 / √32 = P( Z ≤−2.45¿=¿ 0.0071
Q9)
P = 11/35
q = 1 – 0.31429 = 0.68571
E(x) = np = 35* 0.31429 = 11
σ 2=np ( 1− p ) =35∗0.68571
= 7.54281
σ = √σ2
= 2.746
x−t ∝1/2(n-1)* s . d
√n < μ< x +t ∝1/2(n-1)* s . d
√n
11 – 1.8812* 2.746
√32 < μ<¿ 11 + 1.8812* 2.746
√32
10.1204 < μ<¿ 11.8796
Approximately
10 households < μ<¿ 12 households
Q10) with 90% confidence, the number of household that turn out the lights and pretend they are
not home on Halloween in the city of Denver is between 10 to 12 households
Q11) sample proportion 2.576∗
√ sample proportion(1−sample proportion)
n− ¿+¿ ¿ ¿
x 2.576∗
√ p(1−p)
n− ¿+¿ ¿ ¿
Q12)
Sample mean Z∗s . d
√n− ¿
+¿ ¿ ¿

Q13) standard error of mean = s . d
√n = 83.70/√1000 = 2.647
Sample mean Z∗s . d
√n− ¿
+¿ ¿ ¿
$46.65 2.576∗2.647− ¿+¿ ¿ ¿ = $46.65 $ 6.8187− ¿+¿ ¿ ¿
Q14) with 99% confidence the true mean expenditure on Halloween is between $53.4687 and
$39.8313
Q15) mean = 95+173+129+95+75+94+116 +100+85
9 = 106.89
s.d =
√ 1
n−1 [∑ x2− ( ∑ x ) 2
n ]
∑ x2=109762
∑ x =962
( ∑ x ) 2
= 925444
s.d = √ 1
8 [109762− 92544
9 ]
= 29.442
tα/2(n-1) = t0.025(8) = 2.306
x−t ∝1/2(n-1)* s . d
√n < μ< x +t ∝1/2(n-1)* s . d
√n
106.89 – 2.306* 29.442
√ 9 < μ<¿ 106.89 + 2.306* 29.442
√ 9 <
$70.6918 < μ<¿ $146.0882
The values to 1000 dollars
$70691.8 < μ<¿ $146088.2
Q16) yes, since it lies between $70691.8 and $146088.2
⊘ This is a preview!⊘
Do you want full access?
Subscribe today to unlock all pages.

Trusted by 1+ million students worldwide

Q17) sample average = population mean + random error
Sample average = 46 + 6 = 52
52 = 46 + s . d
√n
n = 6.25
Number of school age children = 7
Q18) if we keep the confidence level fixed, the confidence interval gets narrower as we increase
the sample size
Q19) ) X AN (53 , 0.4564)
Q20) there are at least five successive and five failures in the sample.
Q21) The sample mean
Q22) cannot be determine since we do not have the standard deviation
Q23) cannot be determined, because no standard deviation is give
Q24) the percentage of the population that was surveyed lies between 71% and 79%
Q25) only 43% to 46% of the populations were surveyed
1 out of 4
Related Documents

Your All-in-One AI-Powered Toolkit for Academic Success.
+13062052269
info@desklib.com
Available 24*7 on WhatsApp / Email
Unlock your academic potential
© 2024 | Zucol Services PVT LTD | All rights reserved.