Statistics for Analytical Decisions Assignment - Stock Market Analysis
VerifiedAdded on 2023/06/07
|24
|2666
|233
Homework Assignment
AI Summary
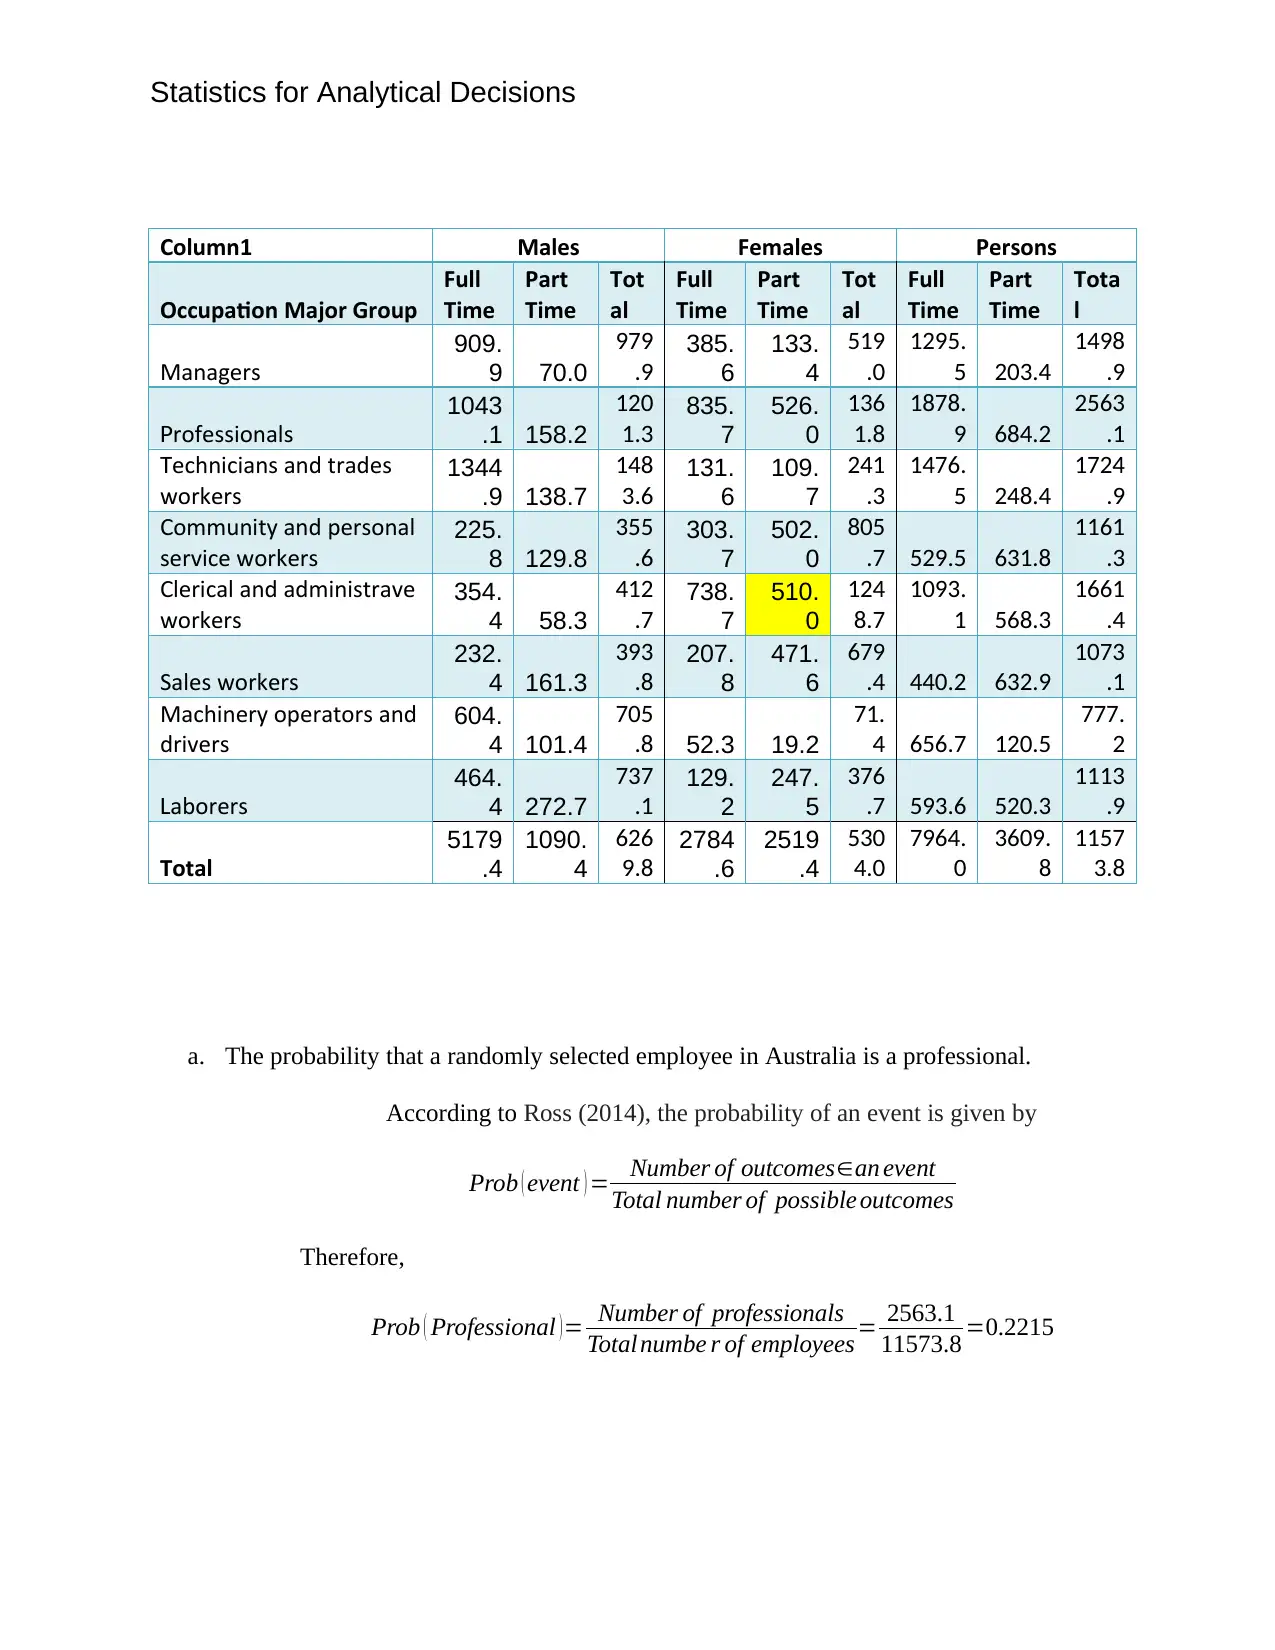
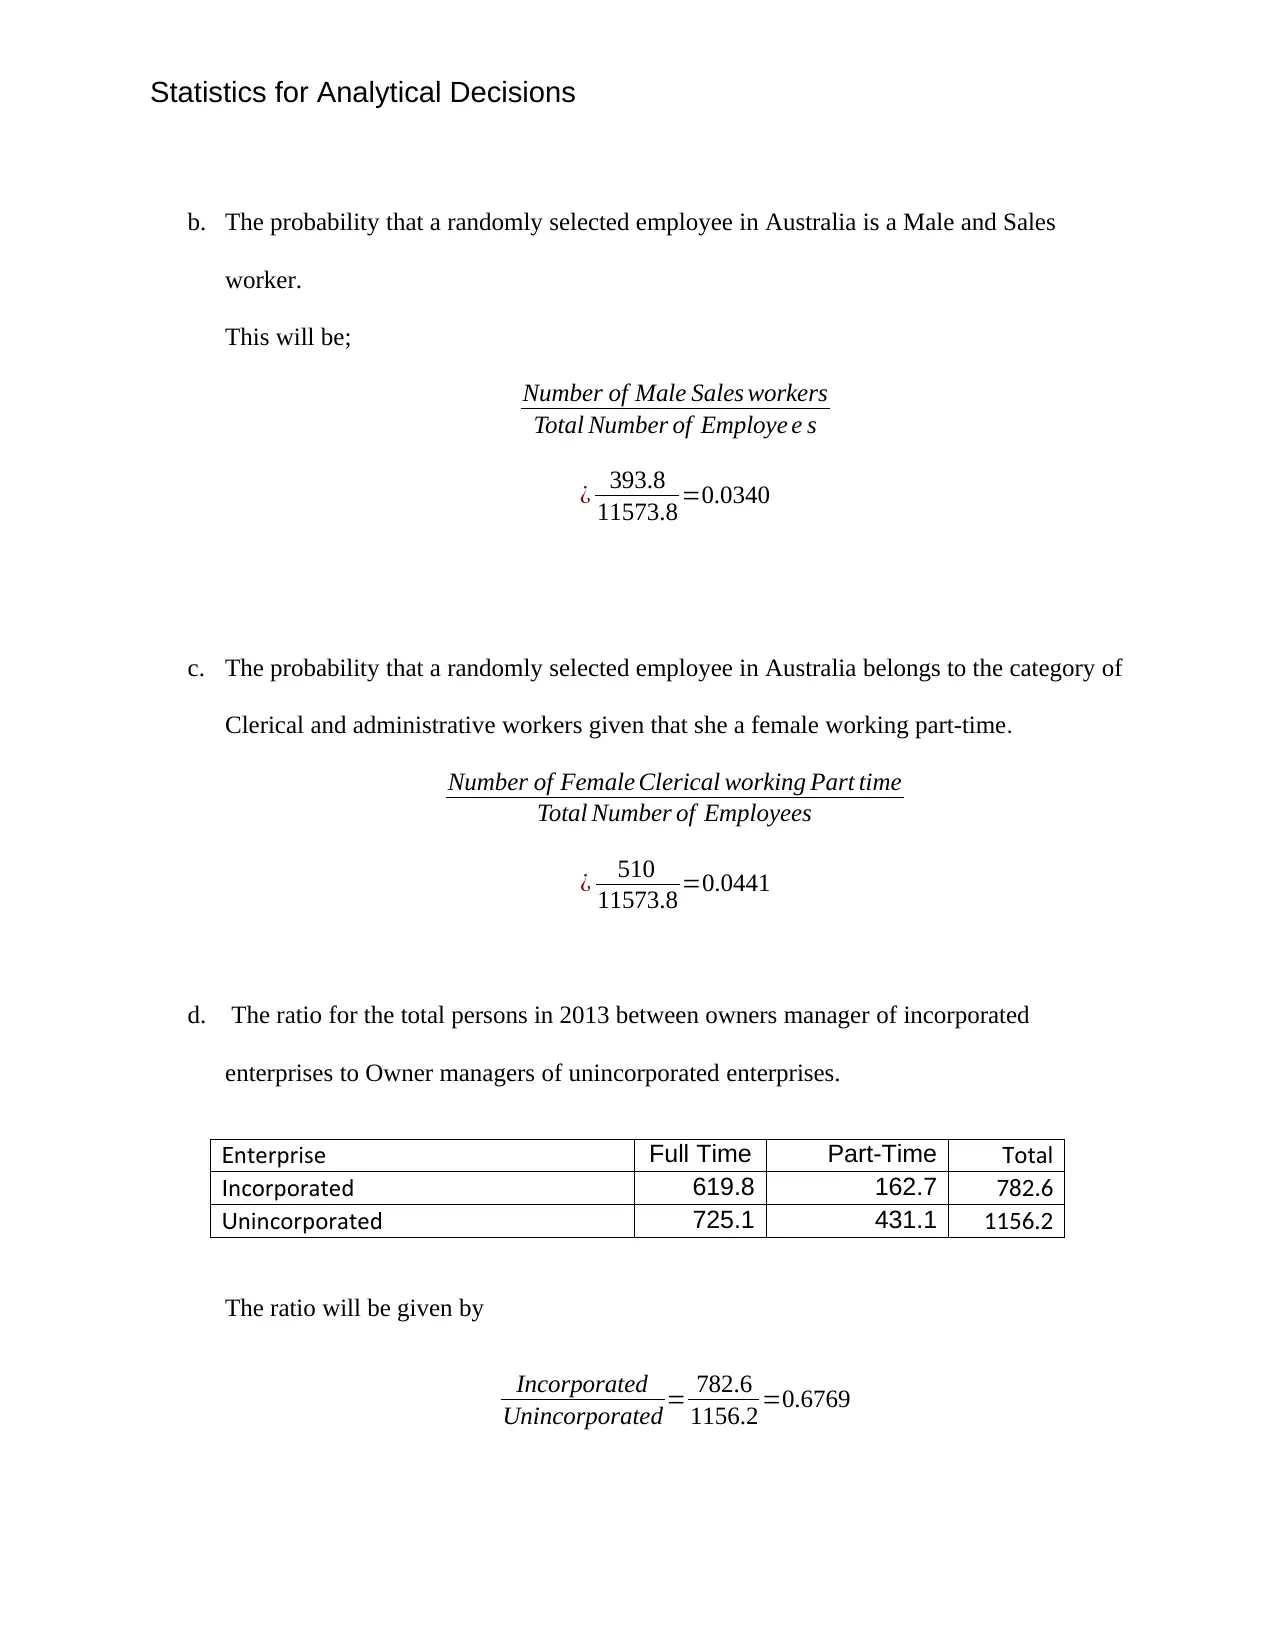
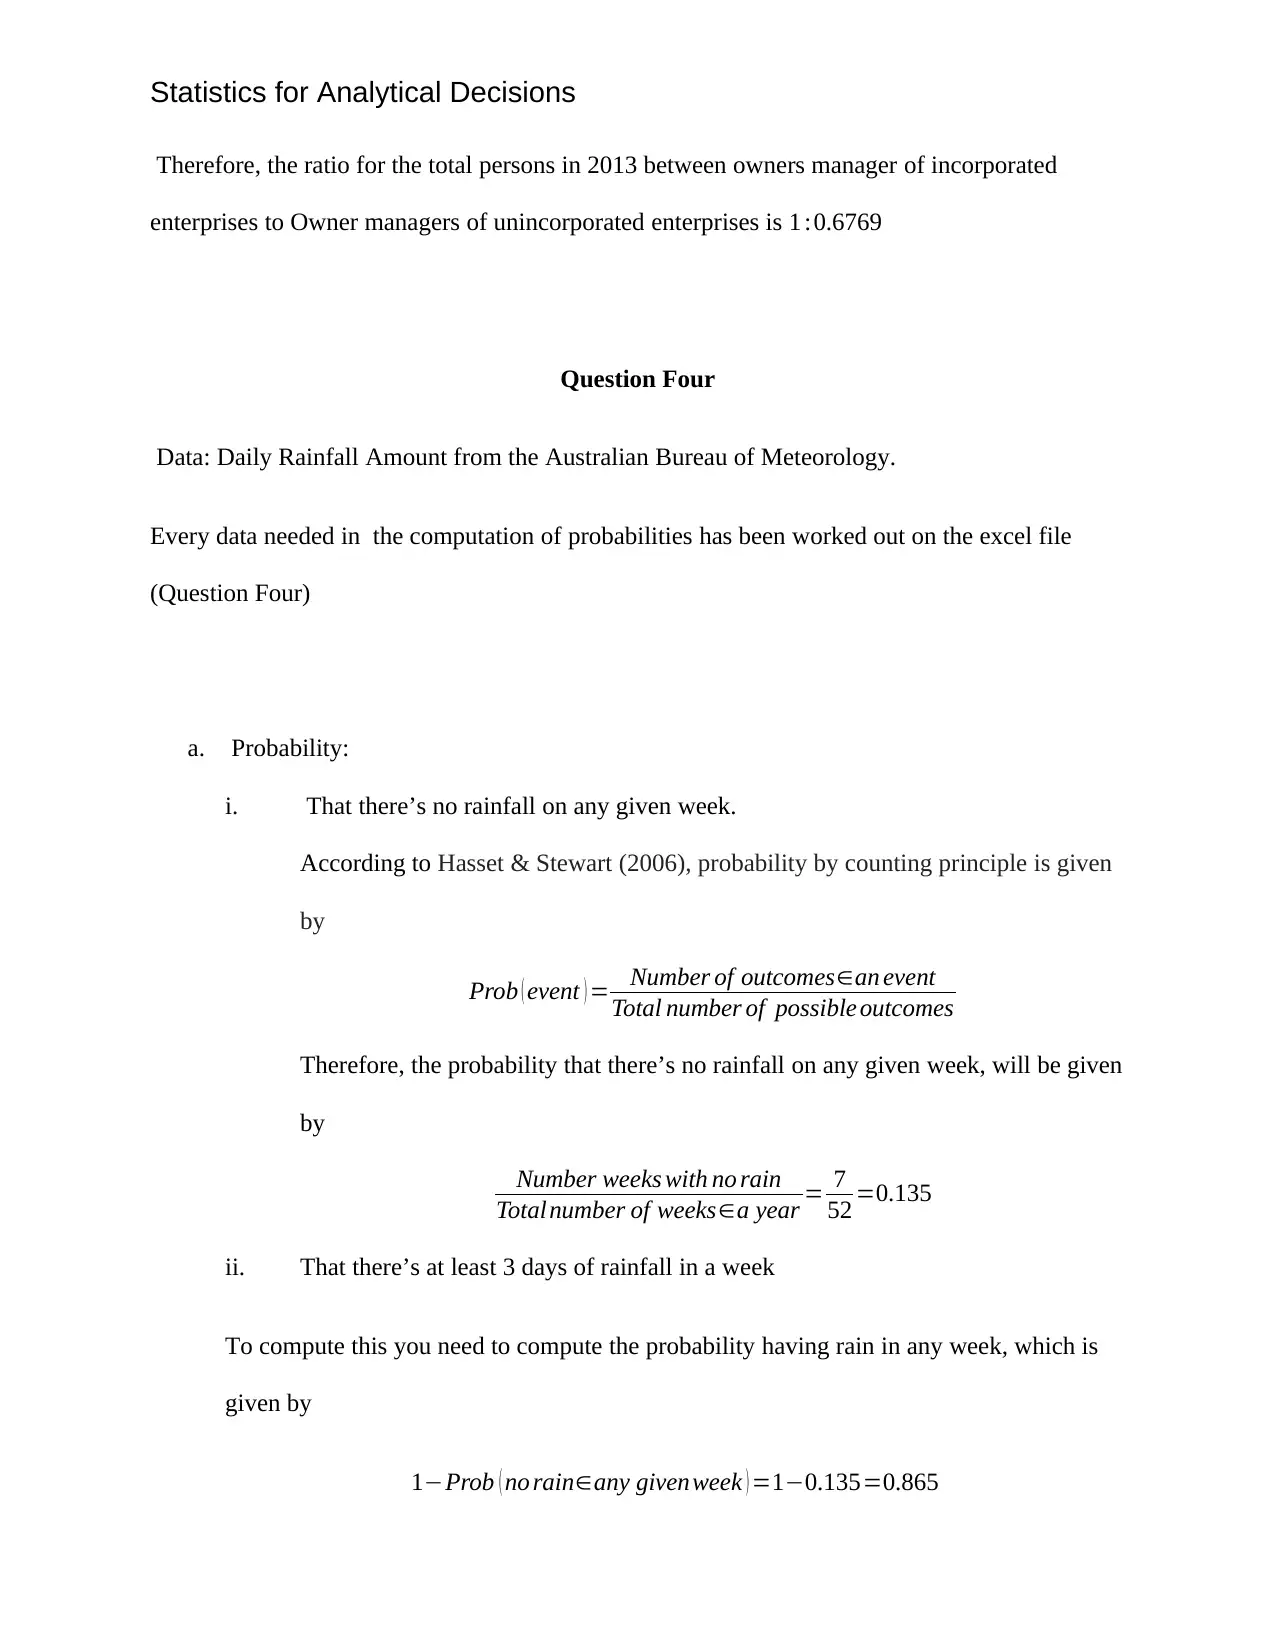
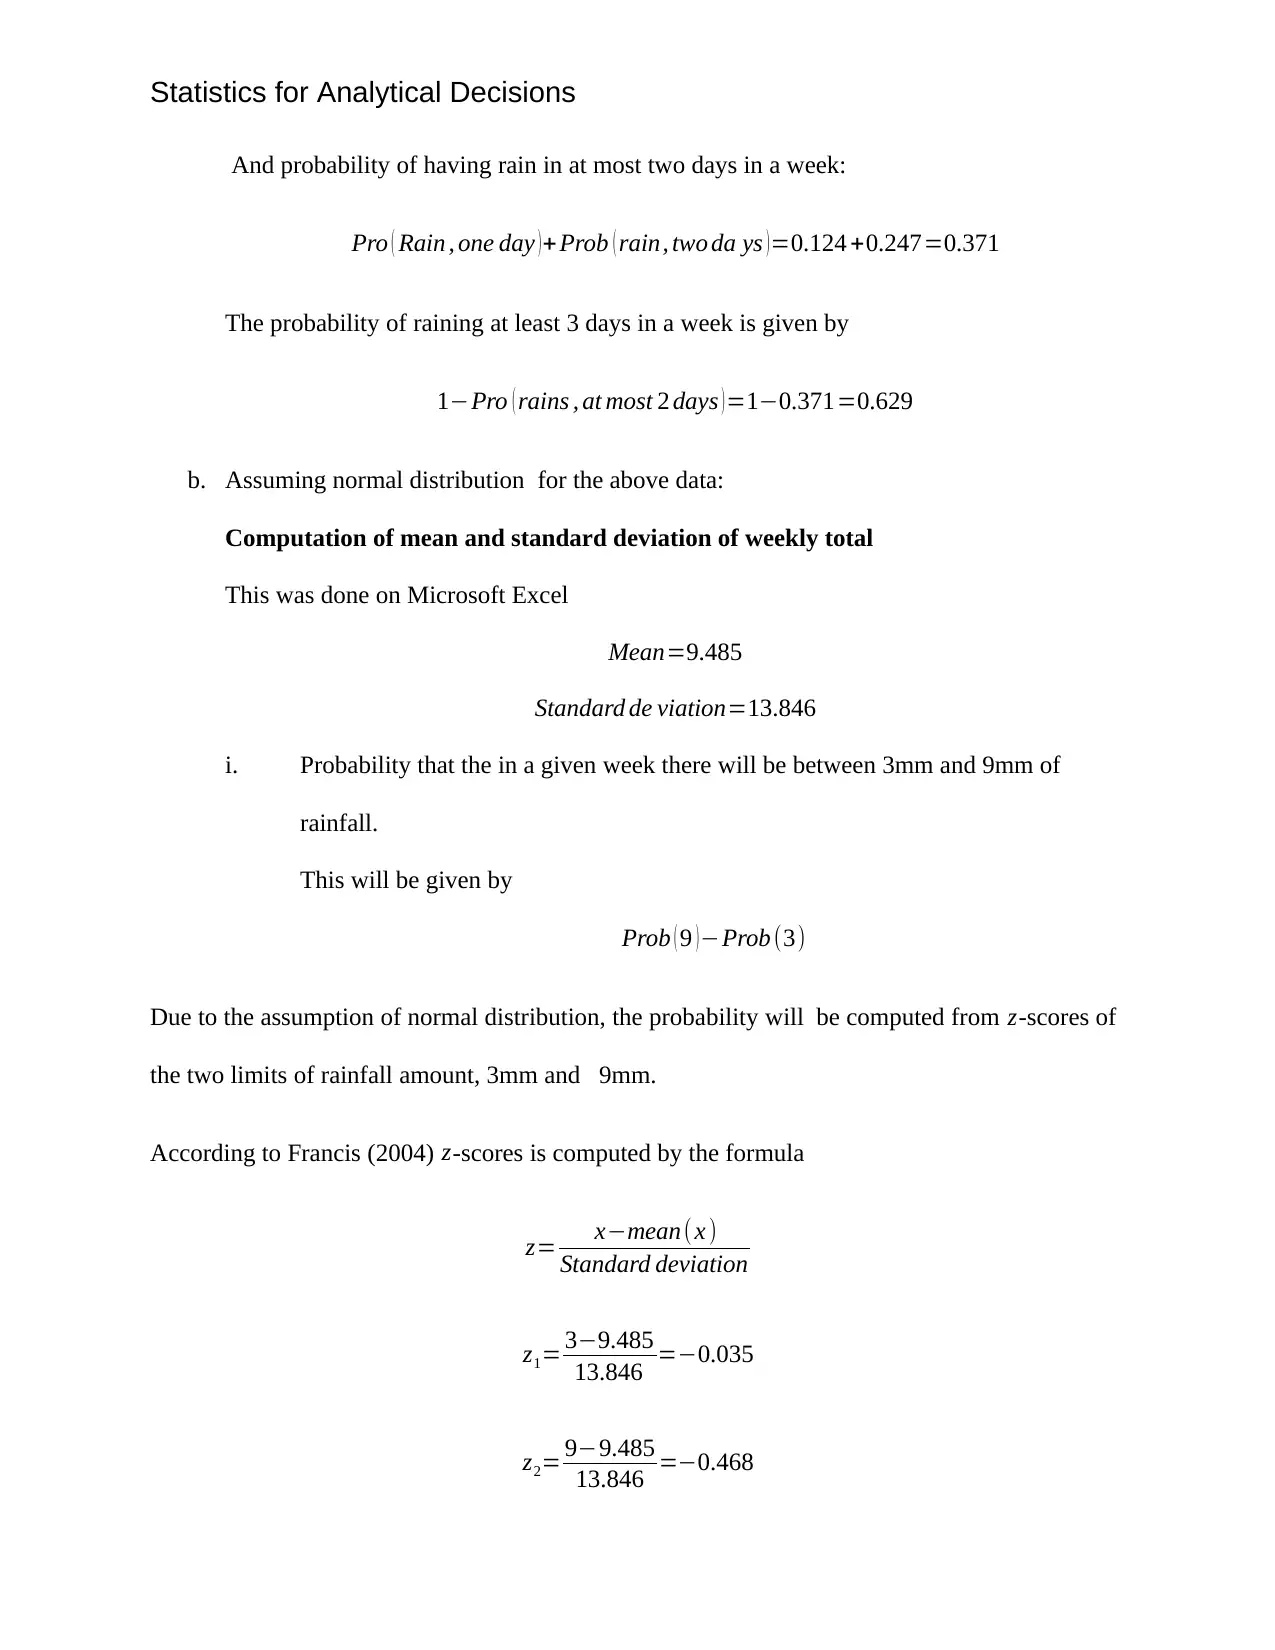
This statistics assignment presents a comprehensive analysis of various datasets, including Australian stock market data (CSR and SFR), apartment prices, and absenteeism from work. The assignment involves constructing stem-and-leaf plots, histograms, and bar charts to visualize data. It requires the calculation of probabilities, means, medians, standard deviations, and confidence intervals. The analysis extends to normality tests, rainfall data, and absenteeism data, with interpretations of statistical results. The assignment covers topics such as probability calculations, normality tests, and the construction of confidence intervals. The student analyzes stock market trends, apartment prices, and absenteeism data, providing interpretations and conclusions based on the statistical findings. The assignment utilizes software such as SPSS and Excel for statistical computations and data visualization.
1 out of 24
Related Documents


Your All-in-One AI-Powered Toolkit for Academic Success.
+13062052269
info@desklib.com
Available 24*7 on WhatsApp / Email
![[object Object]](/_next/static/media/star-bottom.7253800d.svg)
Copyright © 2020–2026 A2Z Services. All Rights Reserved. Developed and managed by ZUCOL.