Psychology Statistics Assignment: Regression, ANOVA, Hypothesis Tests
VerifiedAdded on 2022/09/09
|10
|1882
|29
Homework Assignment
AI Summary
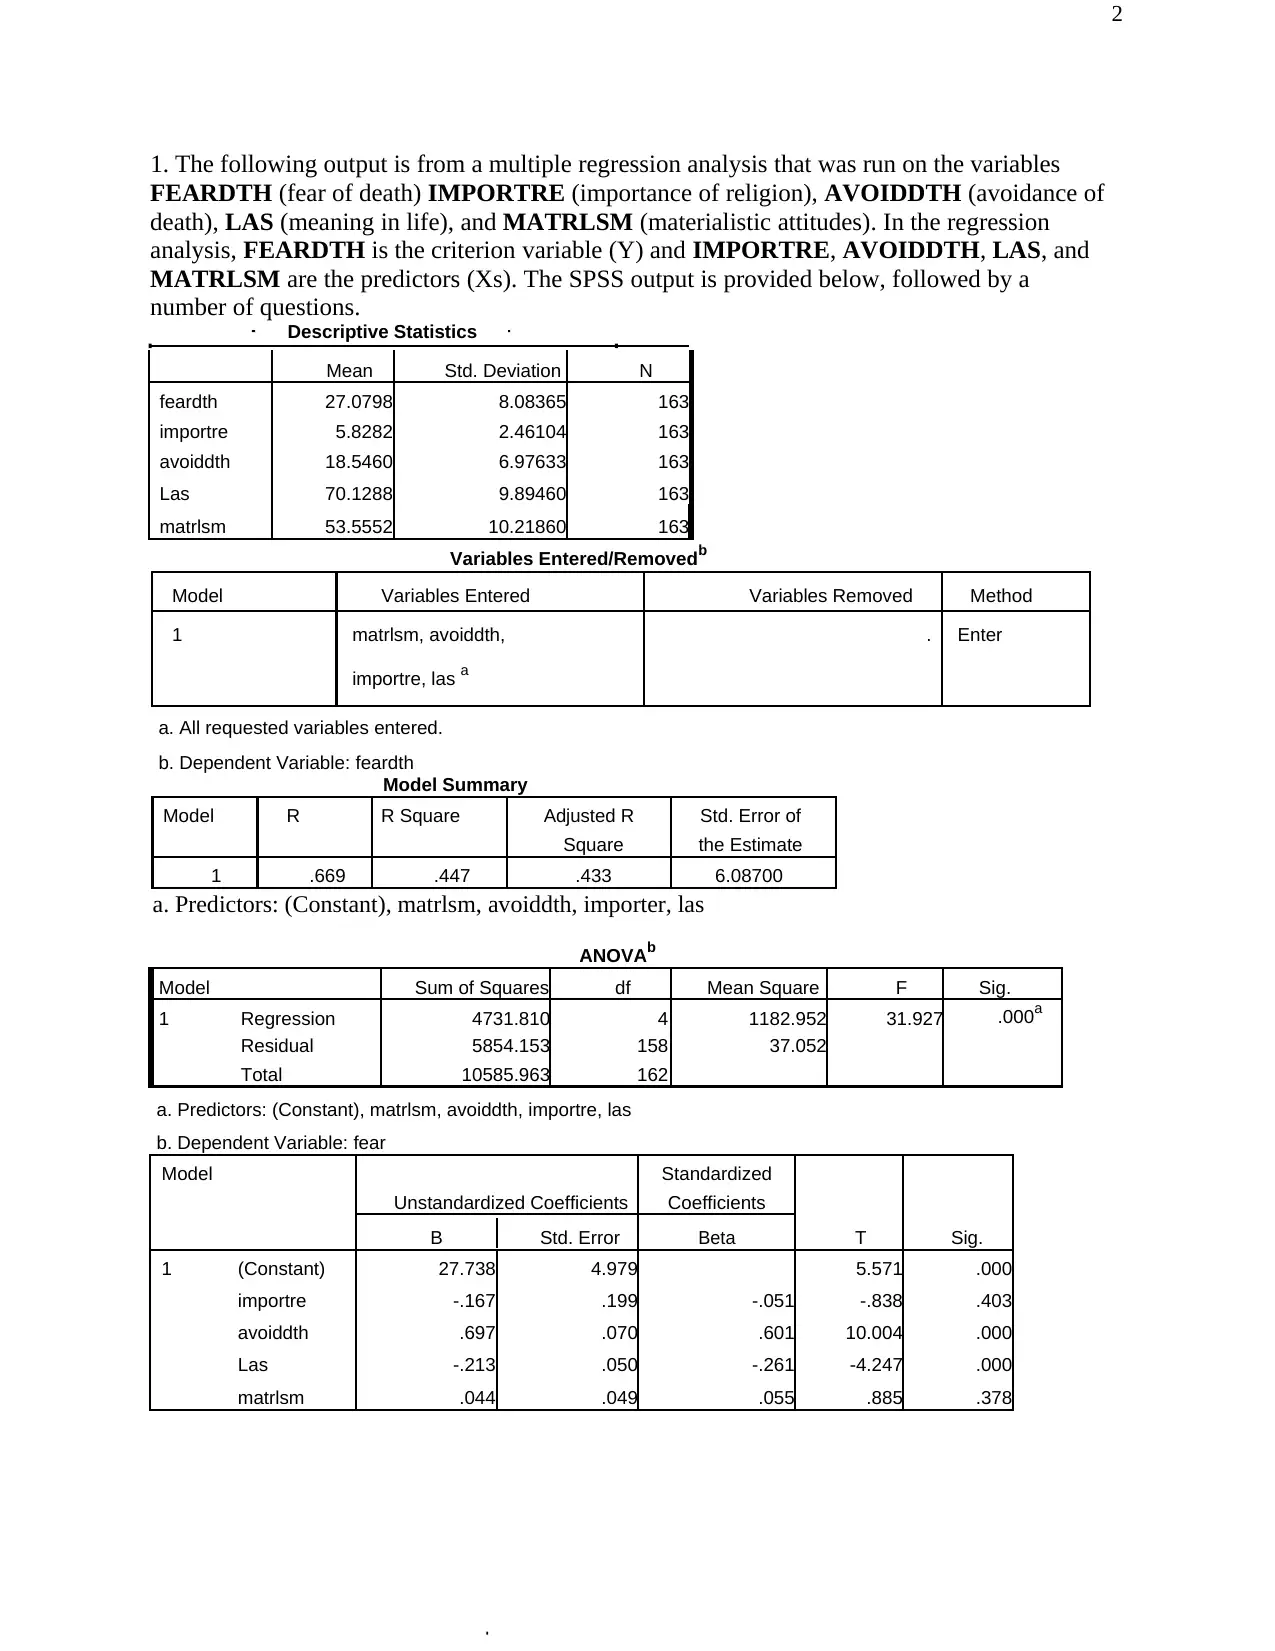
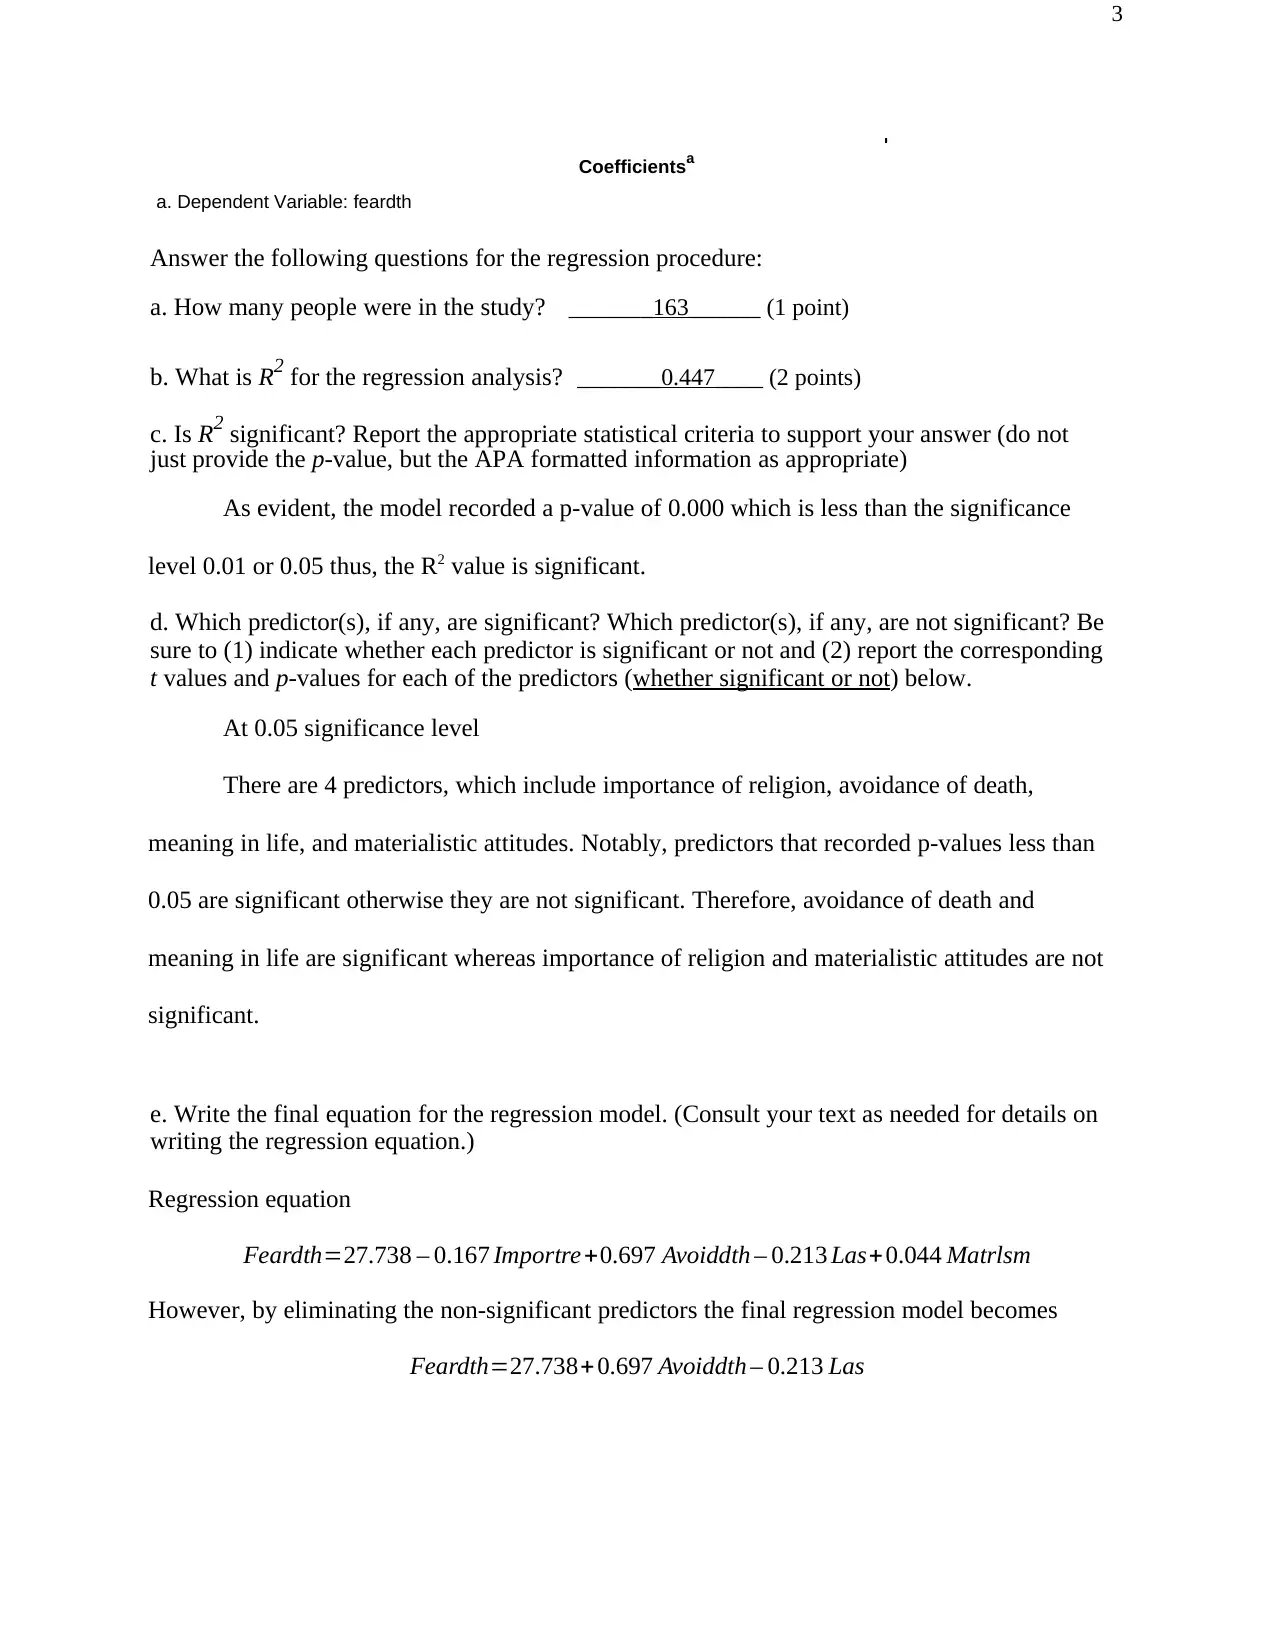
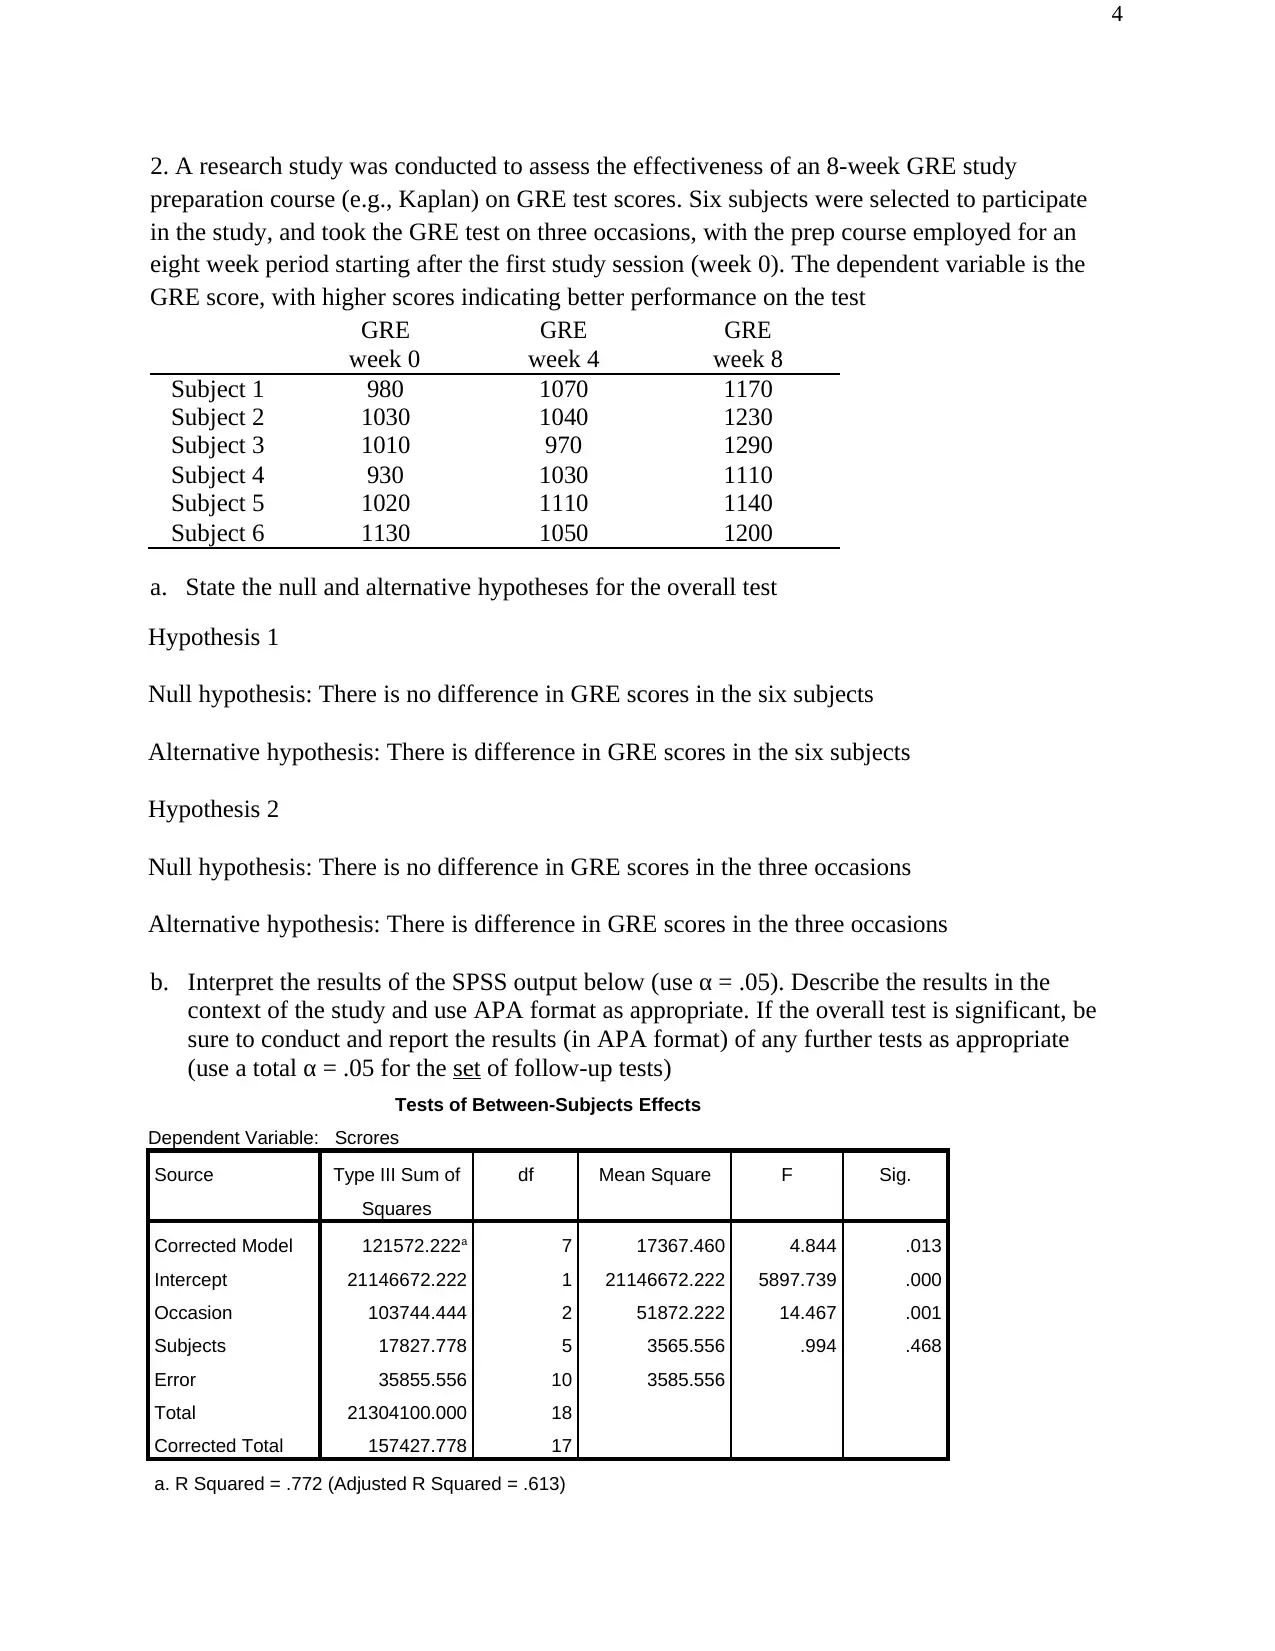
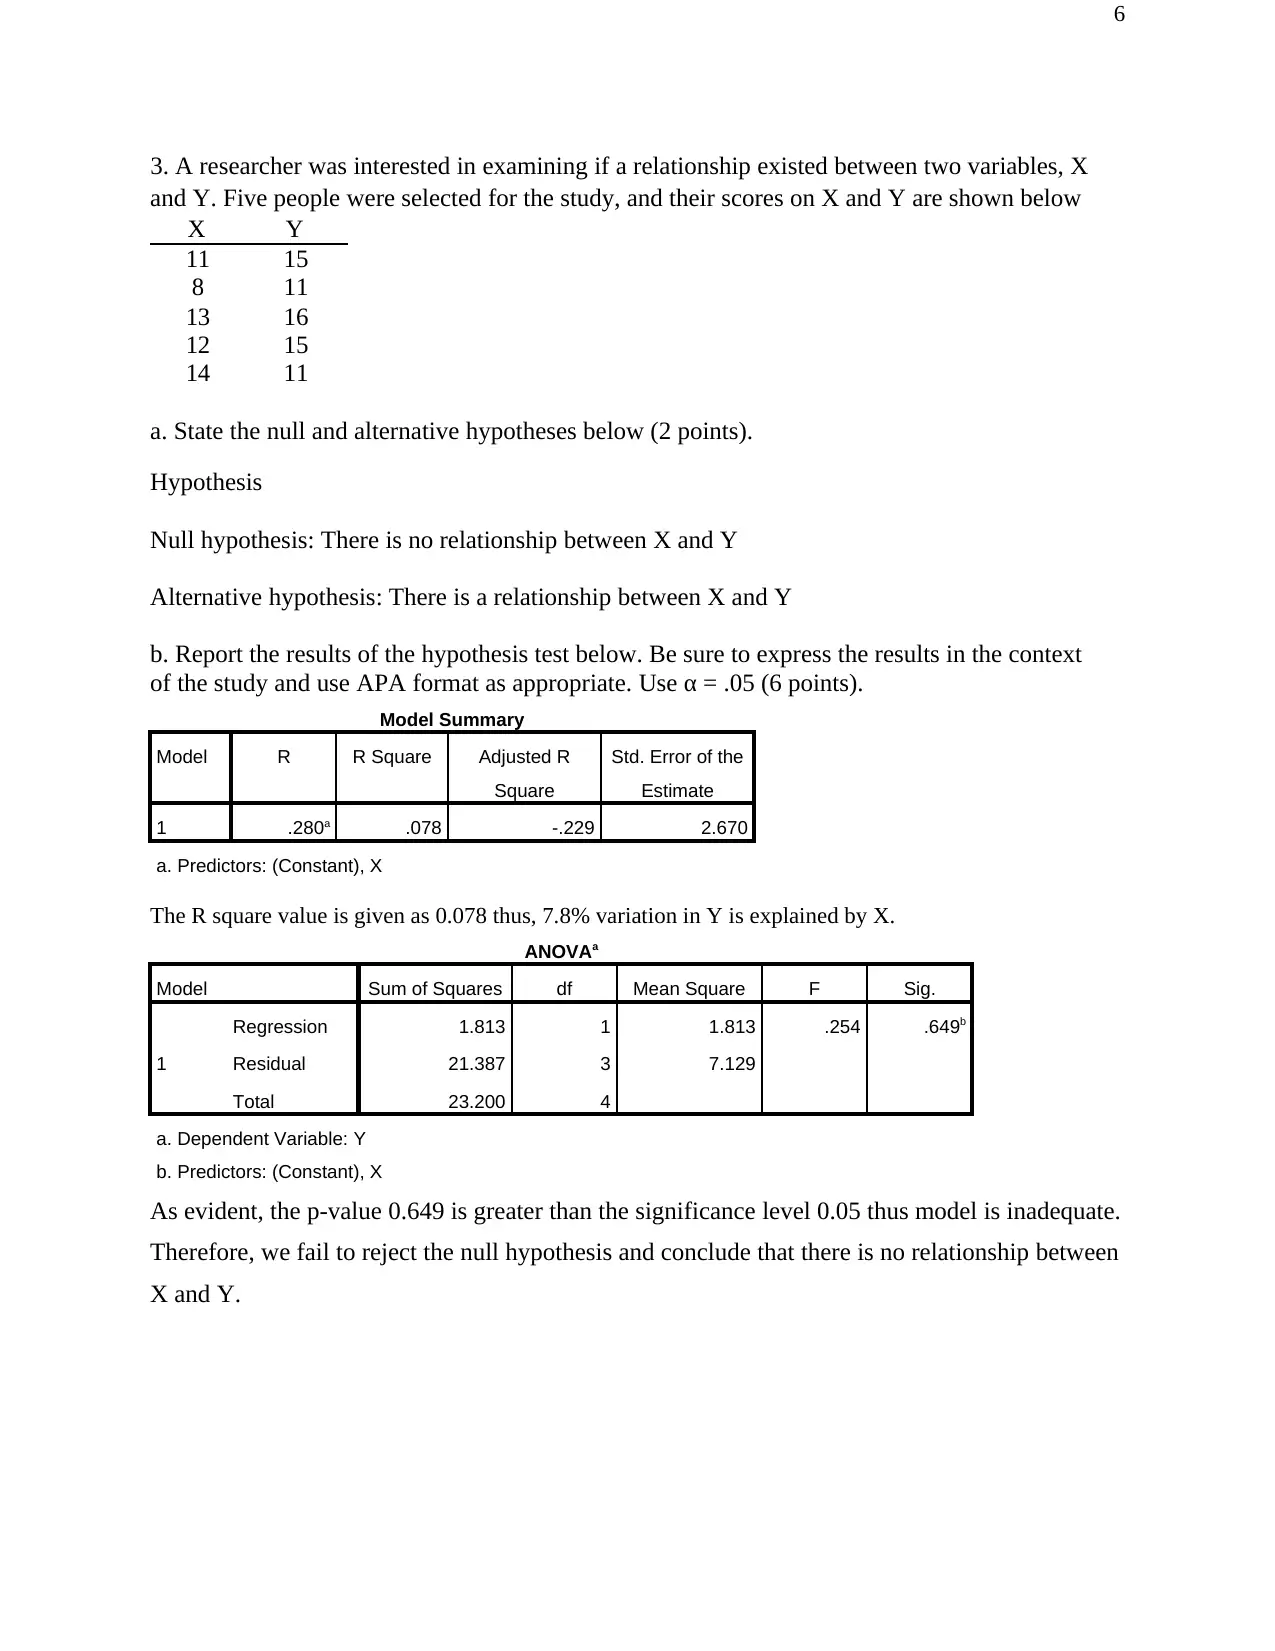
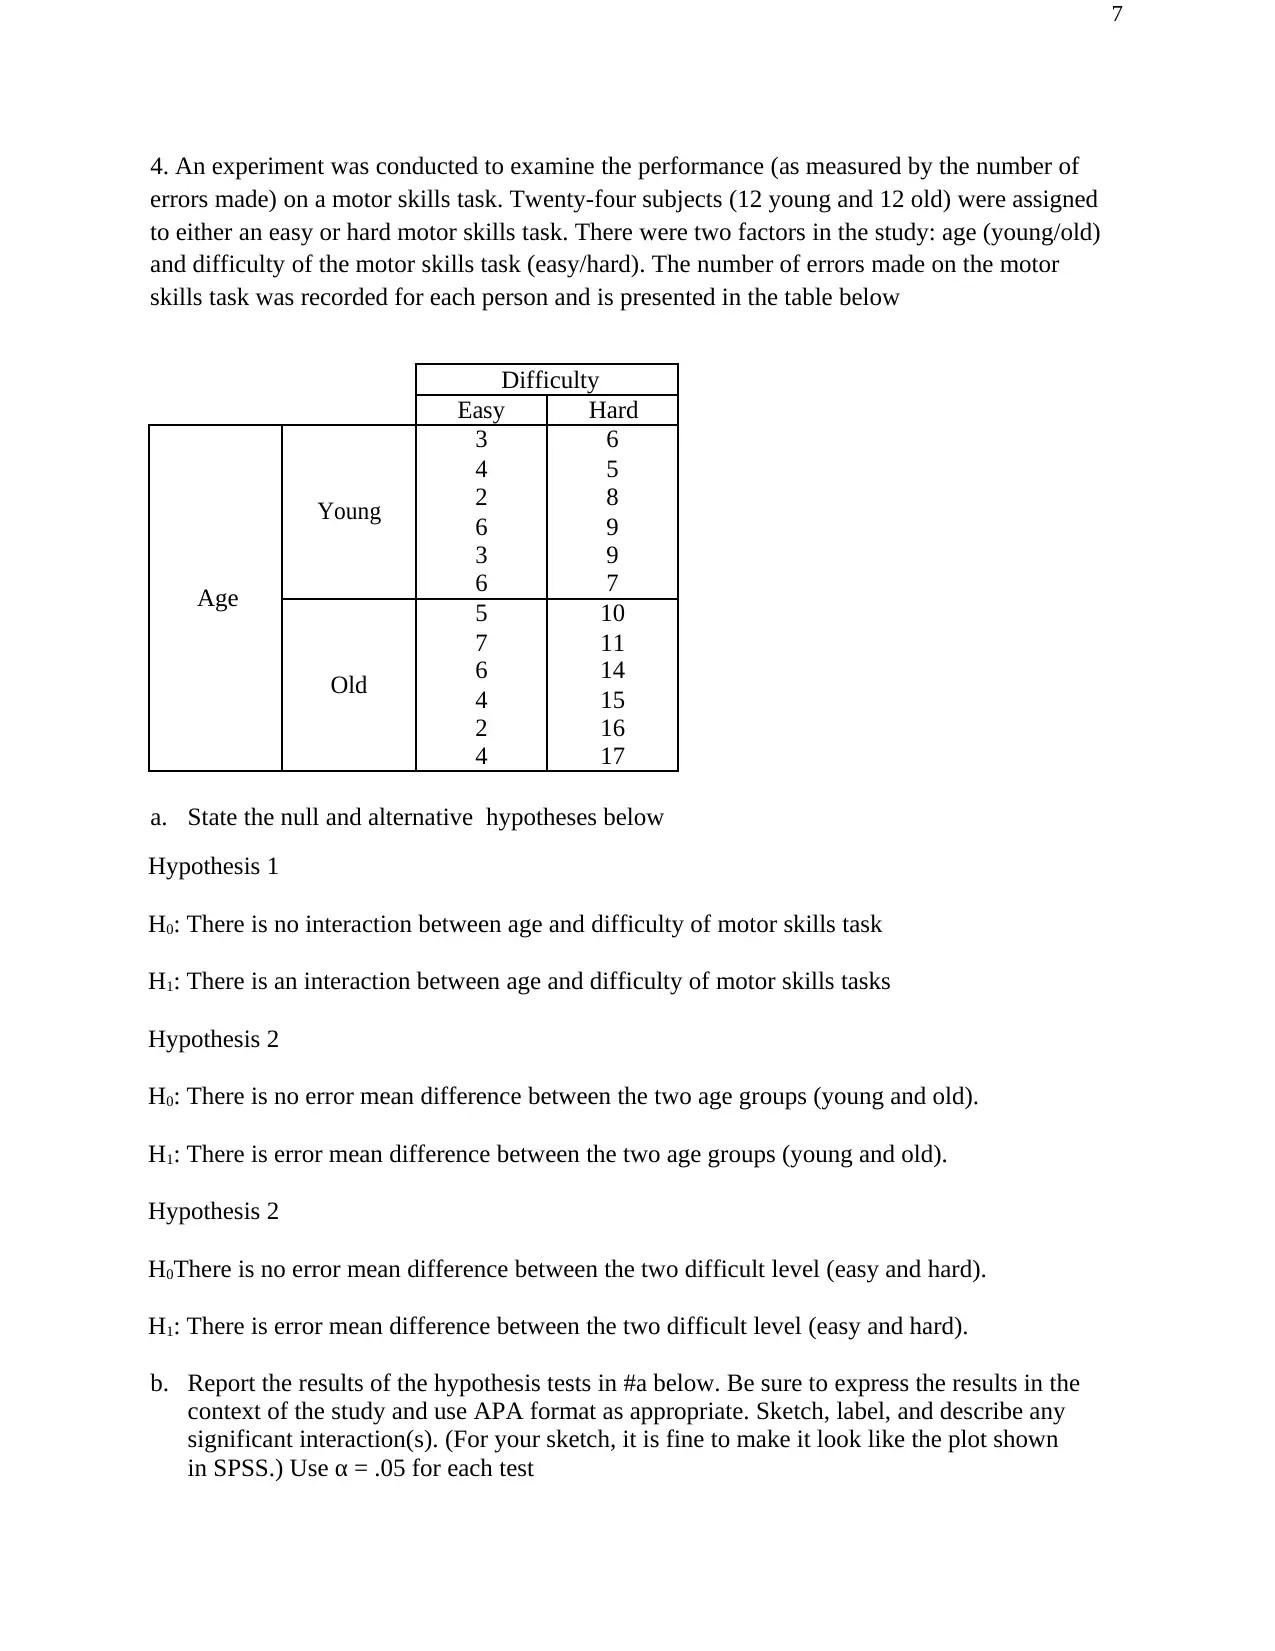
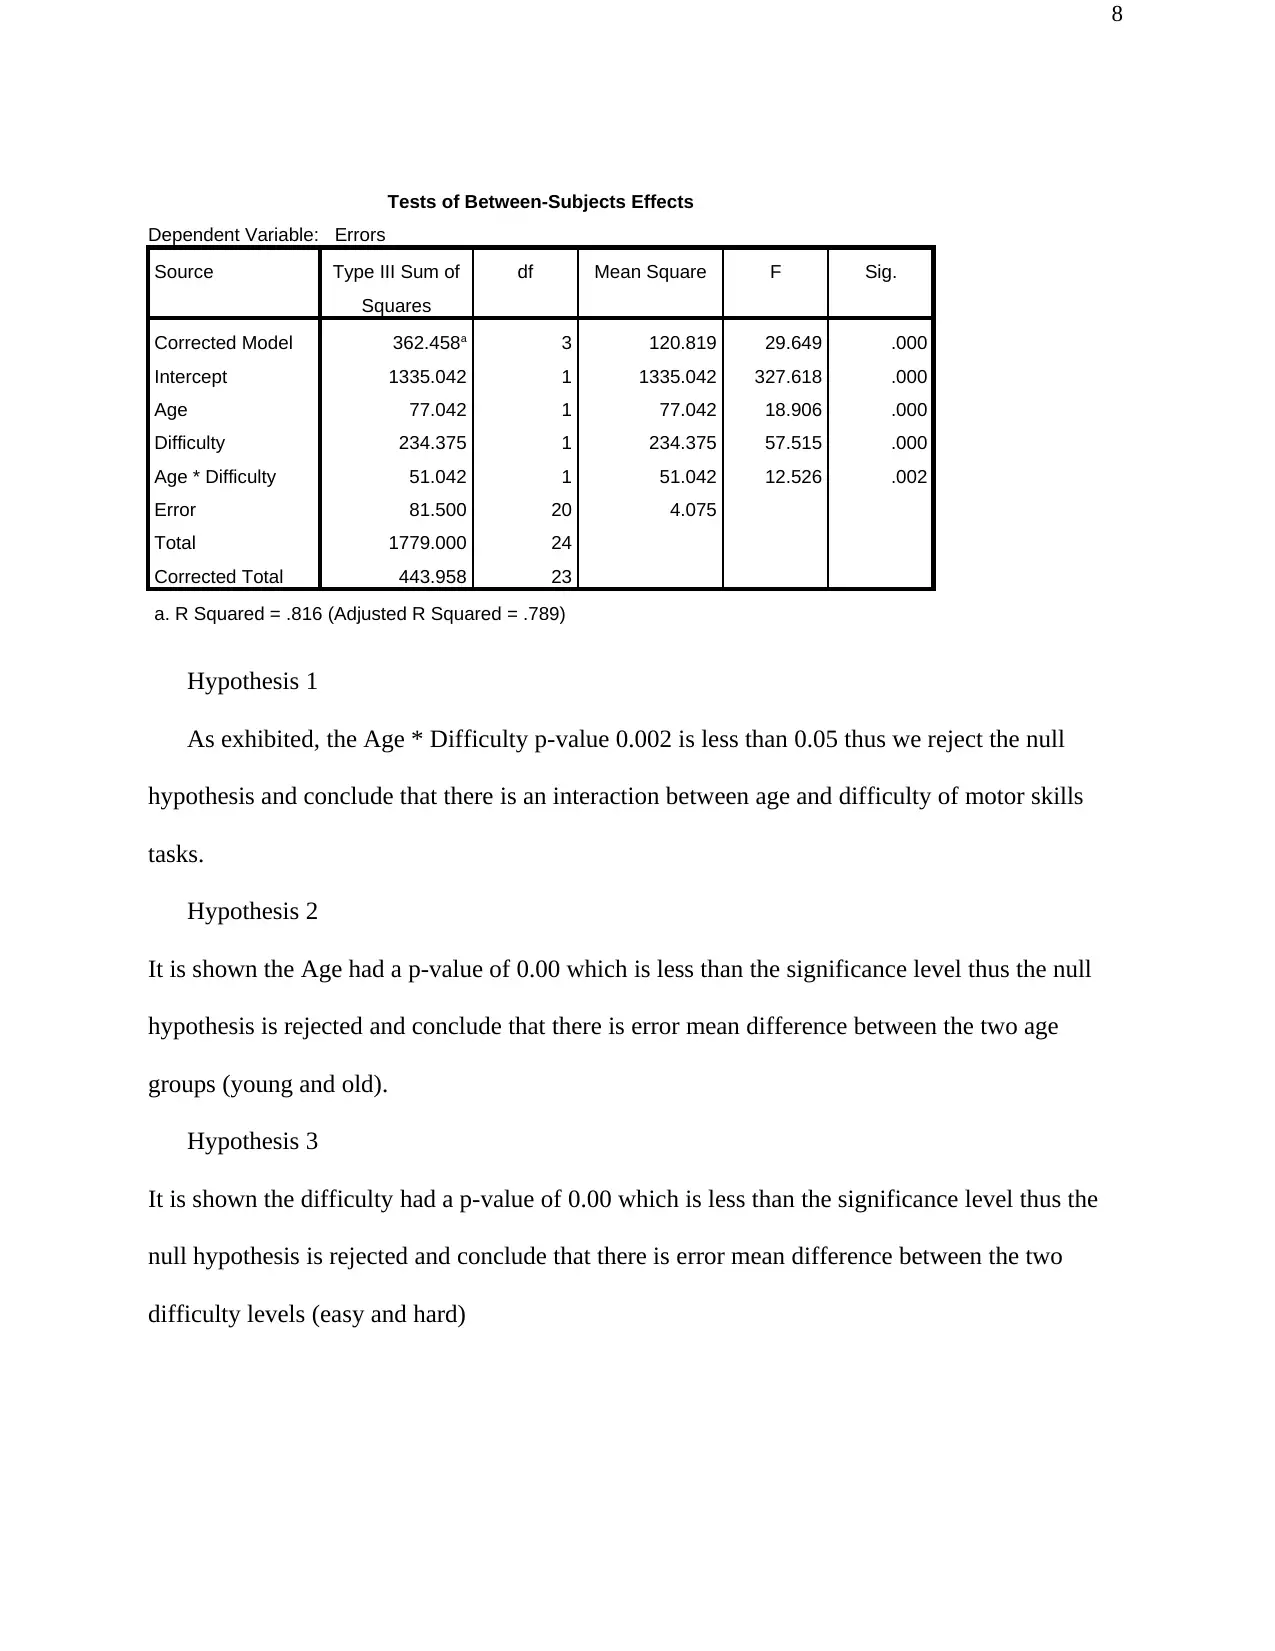
This assignment presents a comprehensive analysis of statistical methods applied to psychological research. The solution begins with a multiple regression analysis, examining the relationships between fear of death and several predictor variables (importance of religion, avoidance of death, meaning in life, and materialistic attitudes). The analysis includes interpretation of the SPSS output, determining the significance of predictors, and constructing the final regression equation. The assignment then progresses to a repeated-measures ANOVA, evaluating the effectiveness of a GRE preparation course on test scores. The results are interpreted, and hypothesis tests are conducted. Further, the solution includes a hypothesis test examining the relationship between two variables (X and Y) using correlation and regression. Finally, the assignment concludes with a two-way ANOVA examining the effects of age and task difficulty on error rates in a motor skills task, including hypothesis formulation, result interpretation, and interaction analysis. An extra credit example of a two-way ANOVA is provided, demonstrating the application of statistical techniques in psychological research.


1 out of 10
Related Documents


Your All-in-One AI-Powered Toolkit for Academic Success.
+13062052269
info@desklib.com
Available 24*7 on WhatsApp / Email
![[object Object]](/_next/static/media/star-bottom.7253800d.svg)
Copyright © 2020–2026 A2Z Services. All Rights Reserved. Developed and managed by ZUCOL.