Statistics Assignment: Regression, Forecasting, and Linear Programming
VerifiedAdded on 2023/01/11
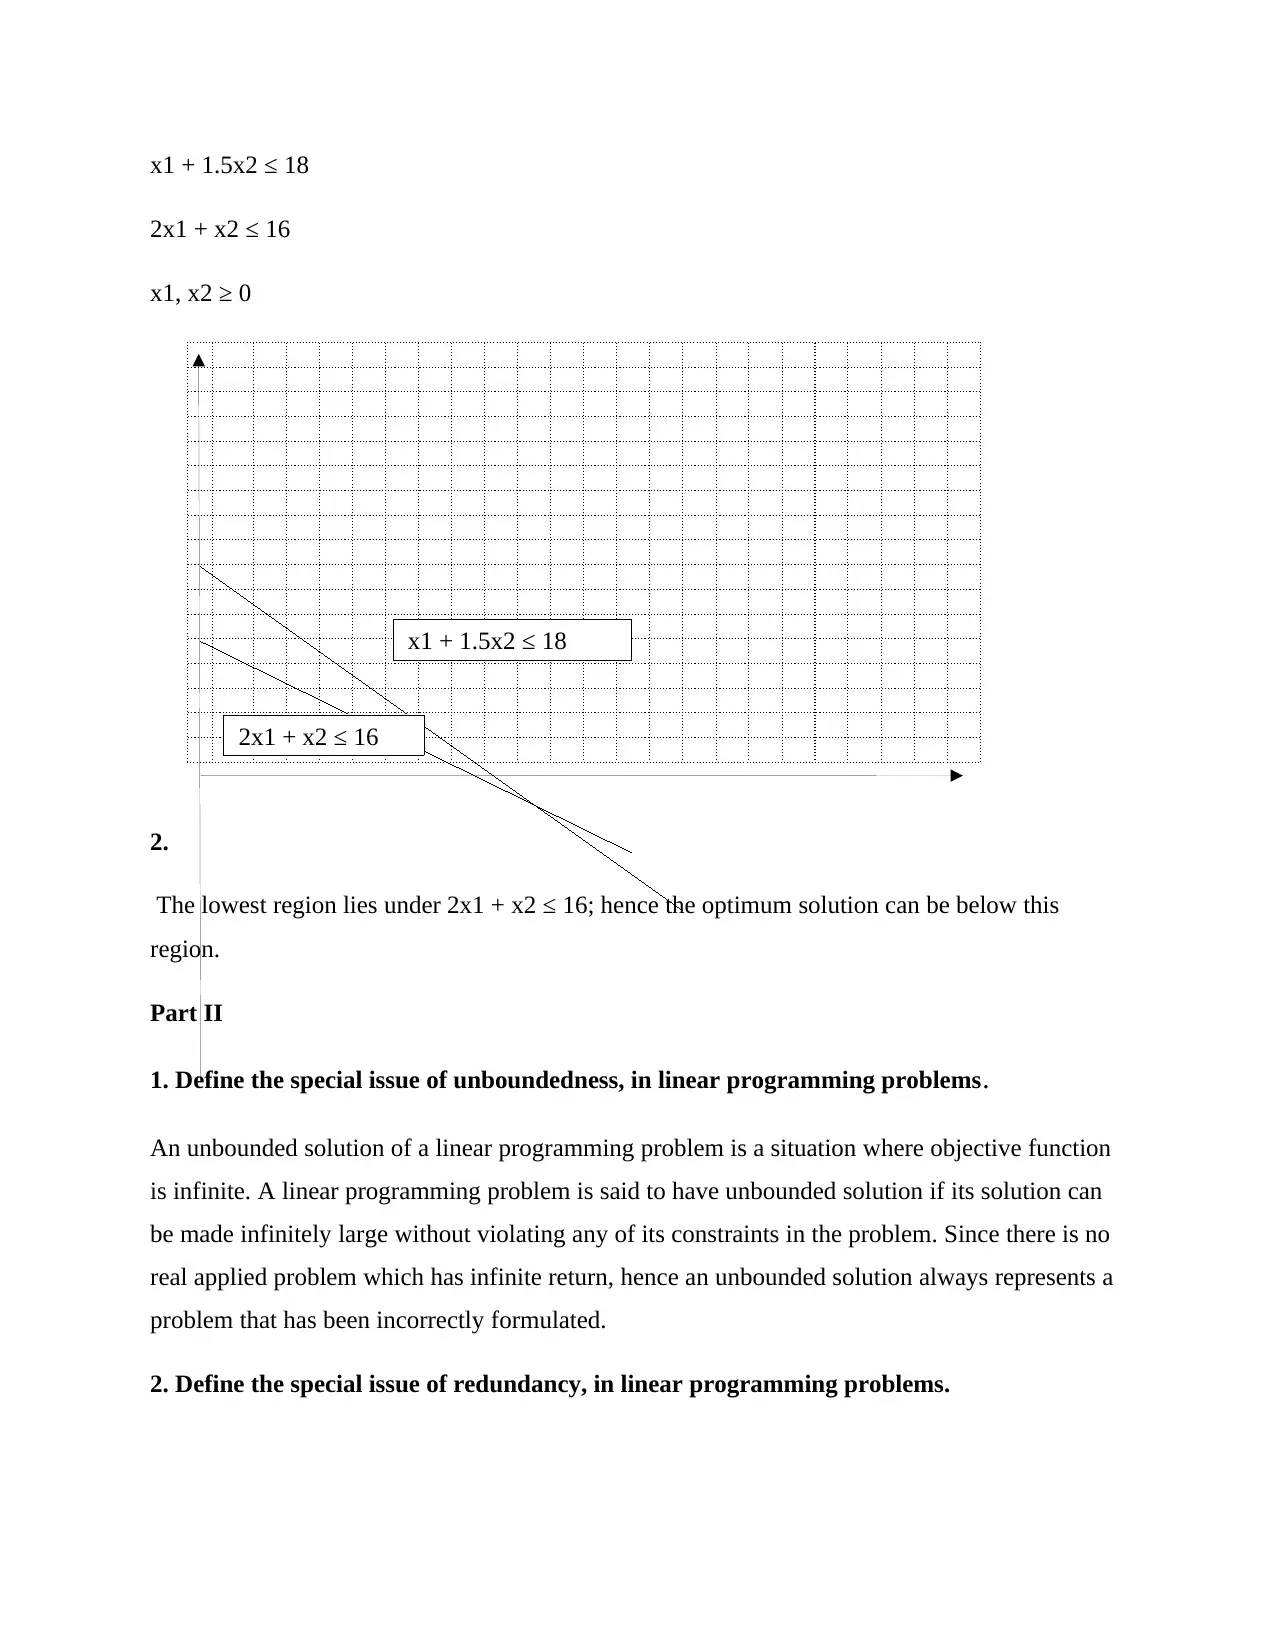
|6
|642
|78
Homework Assignment
AI Summary
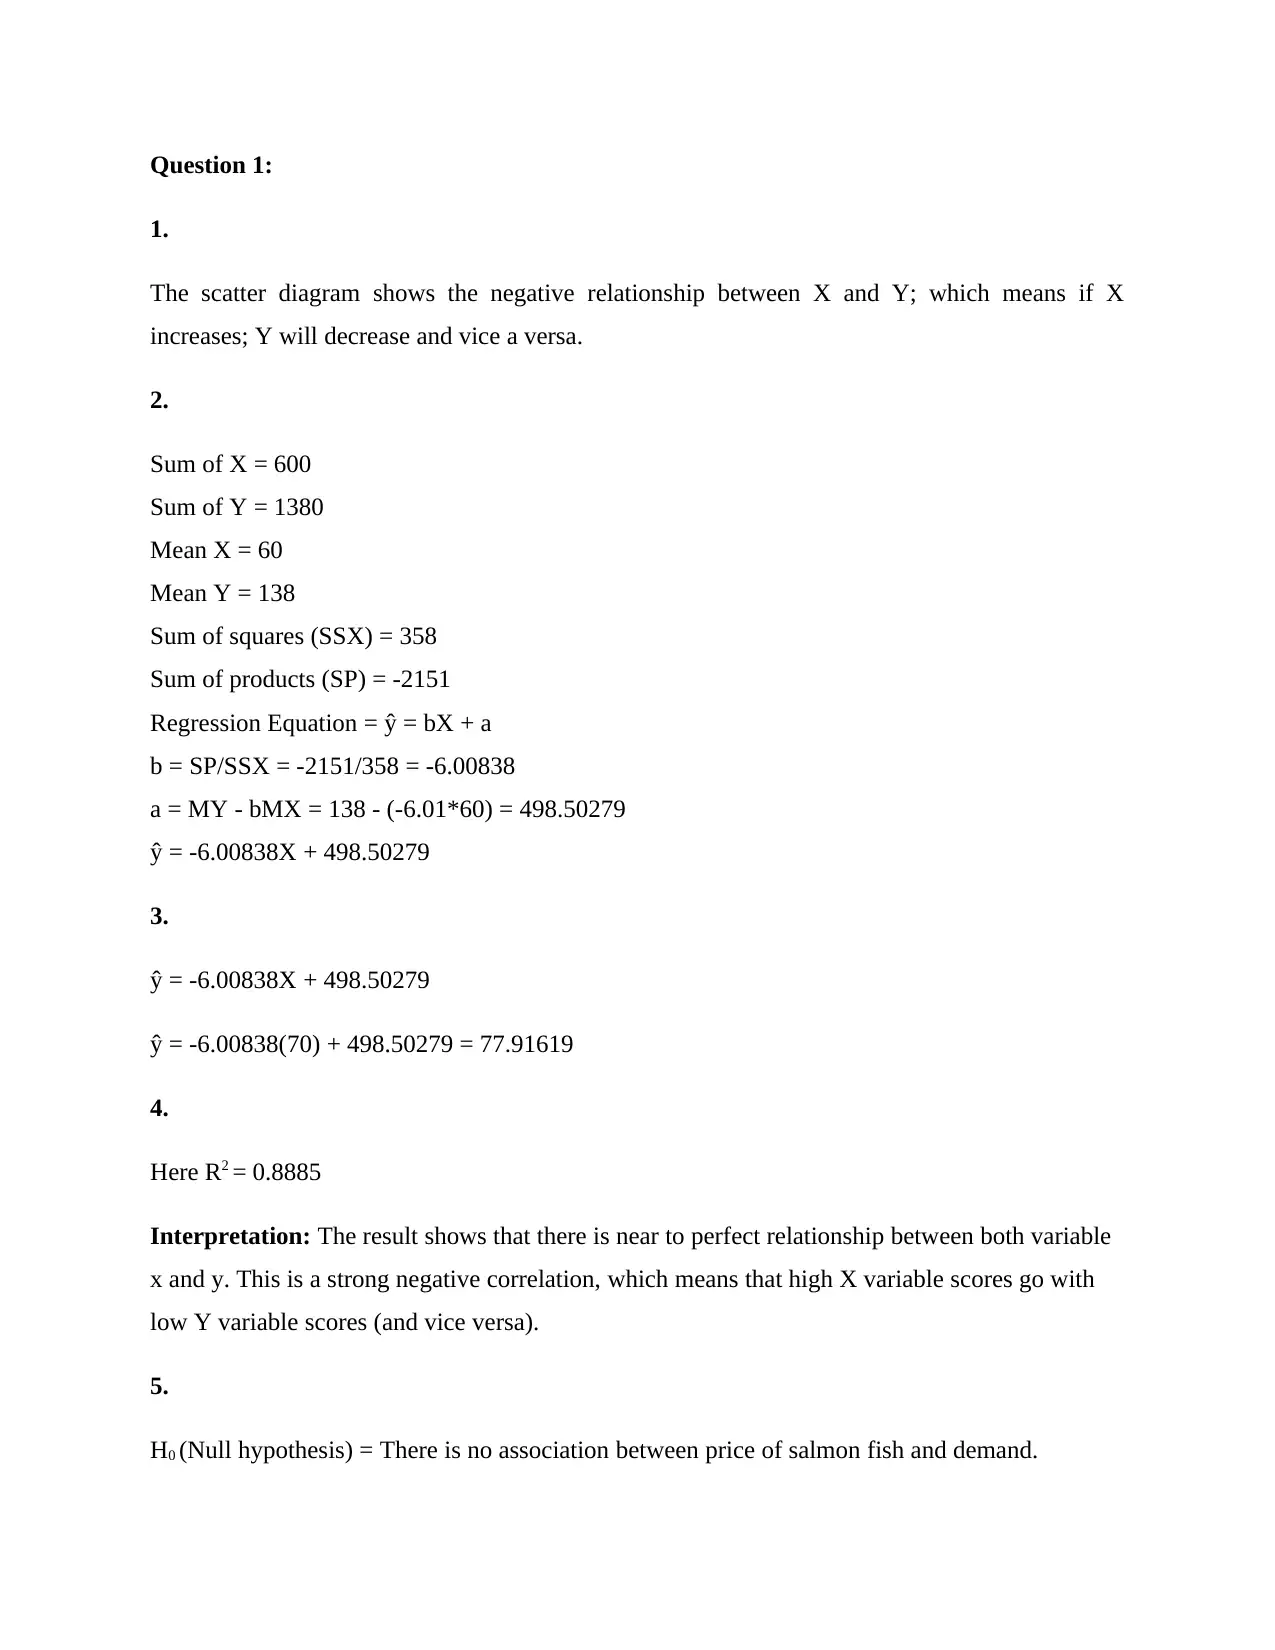
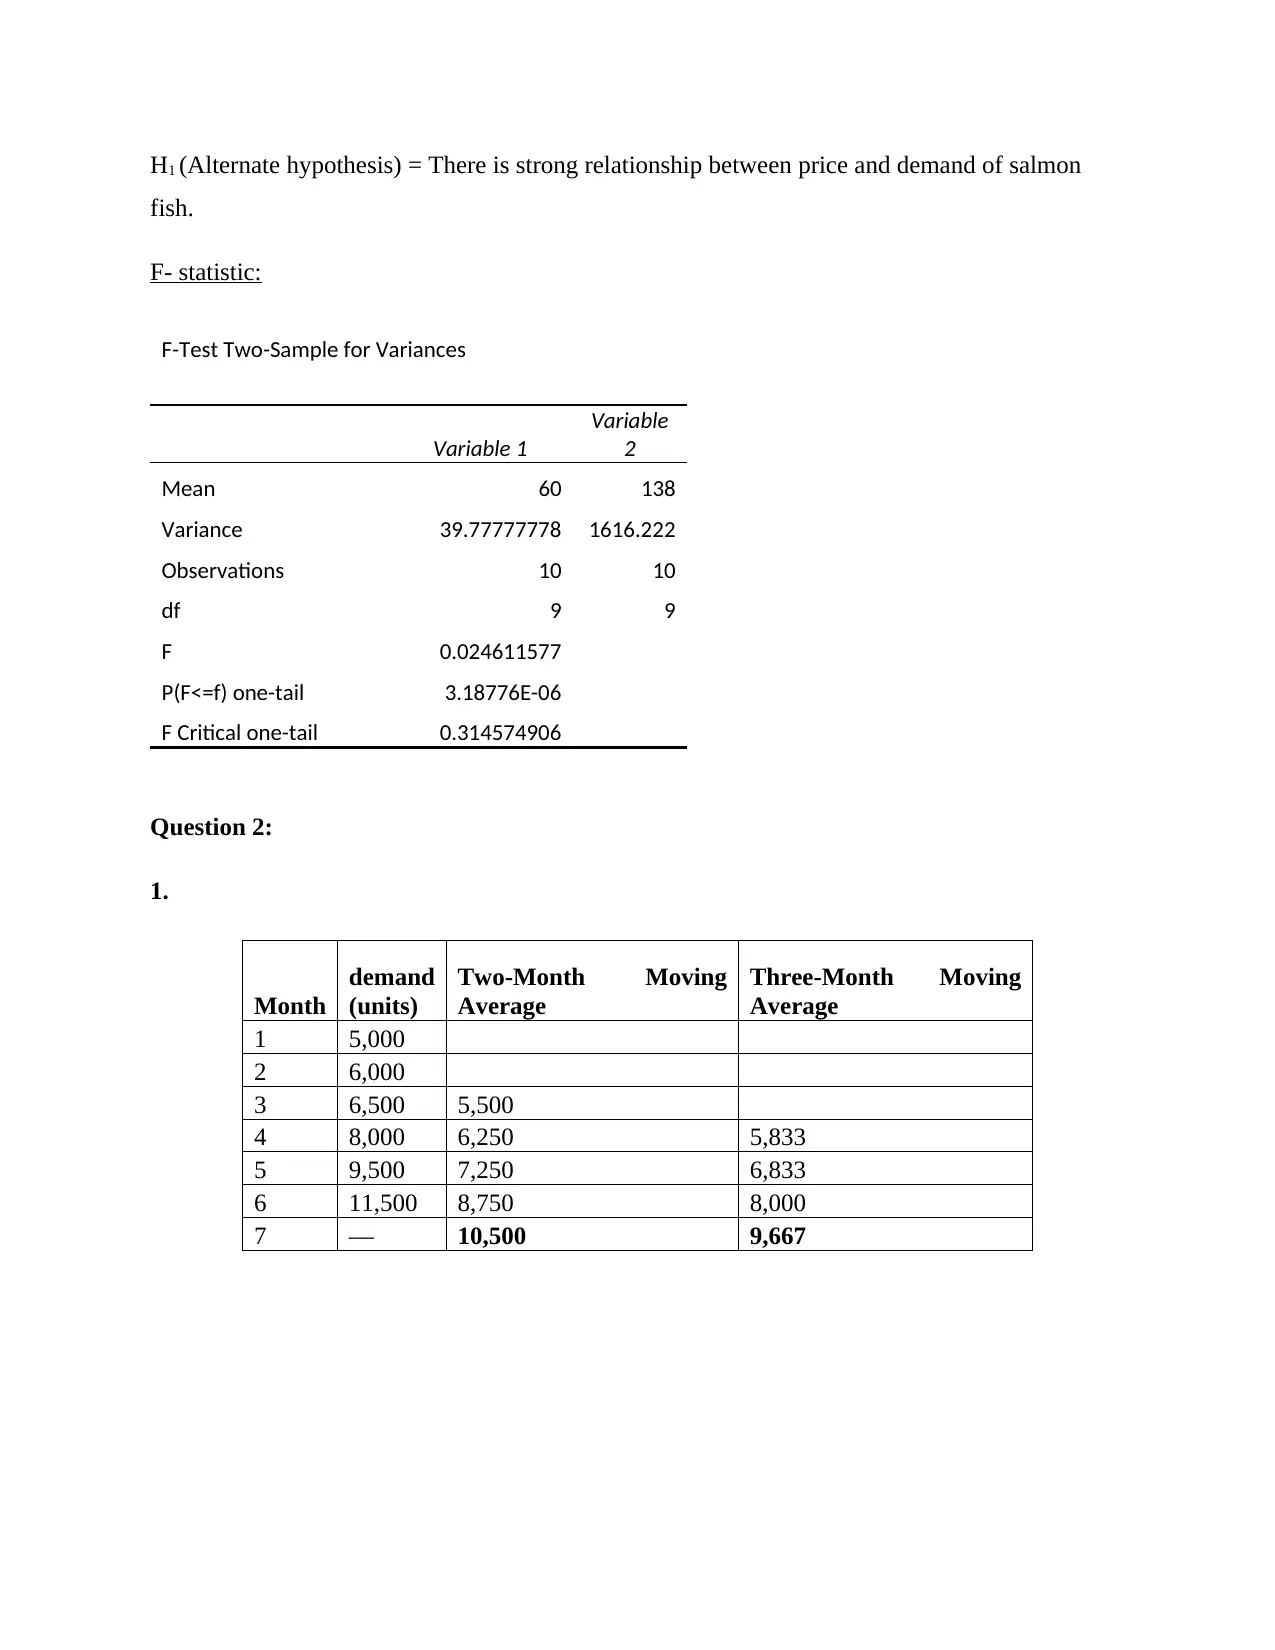
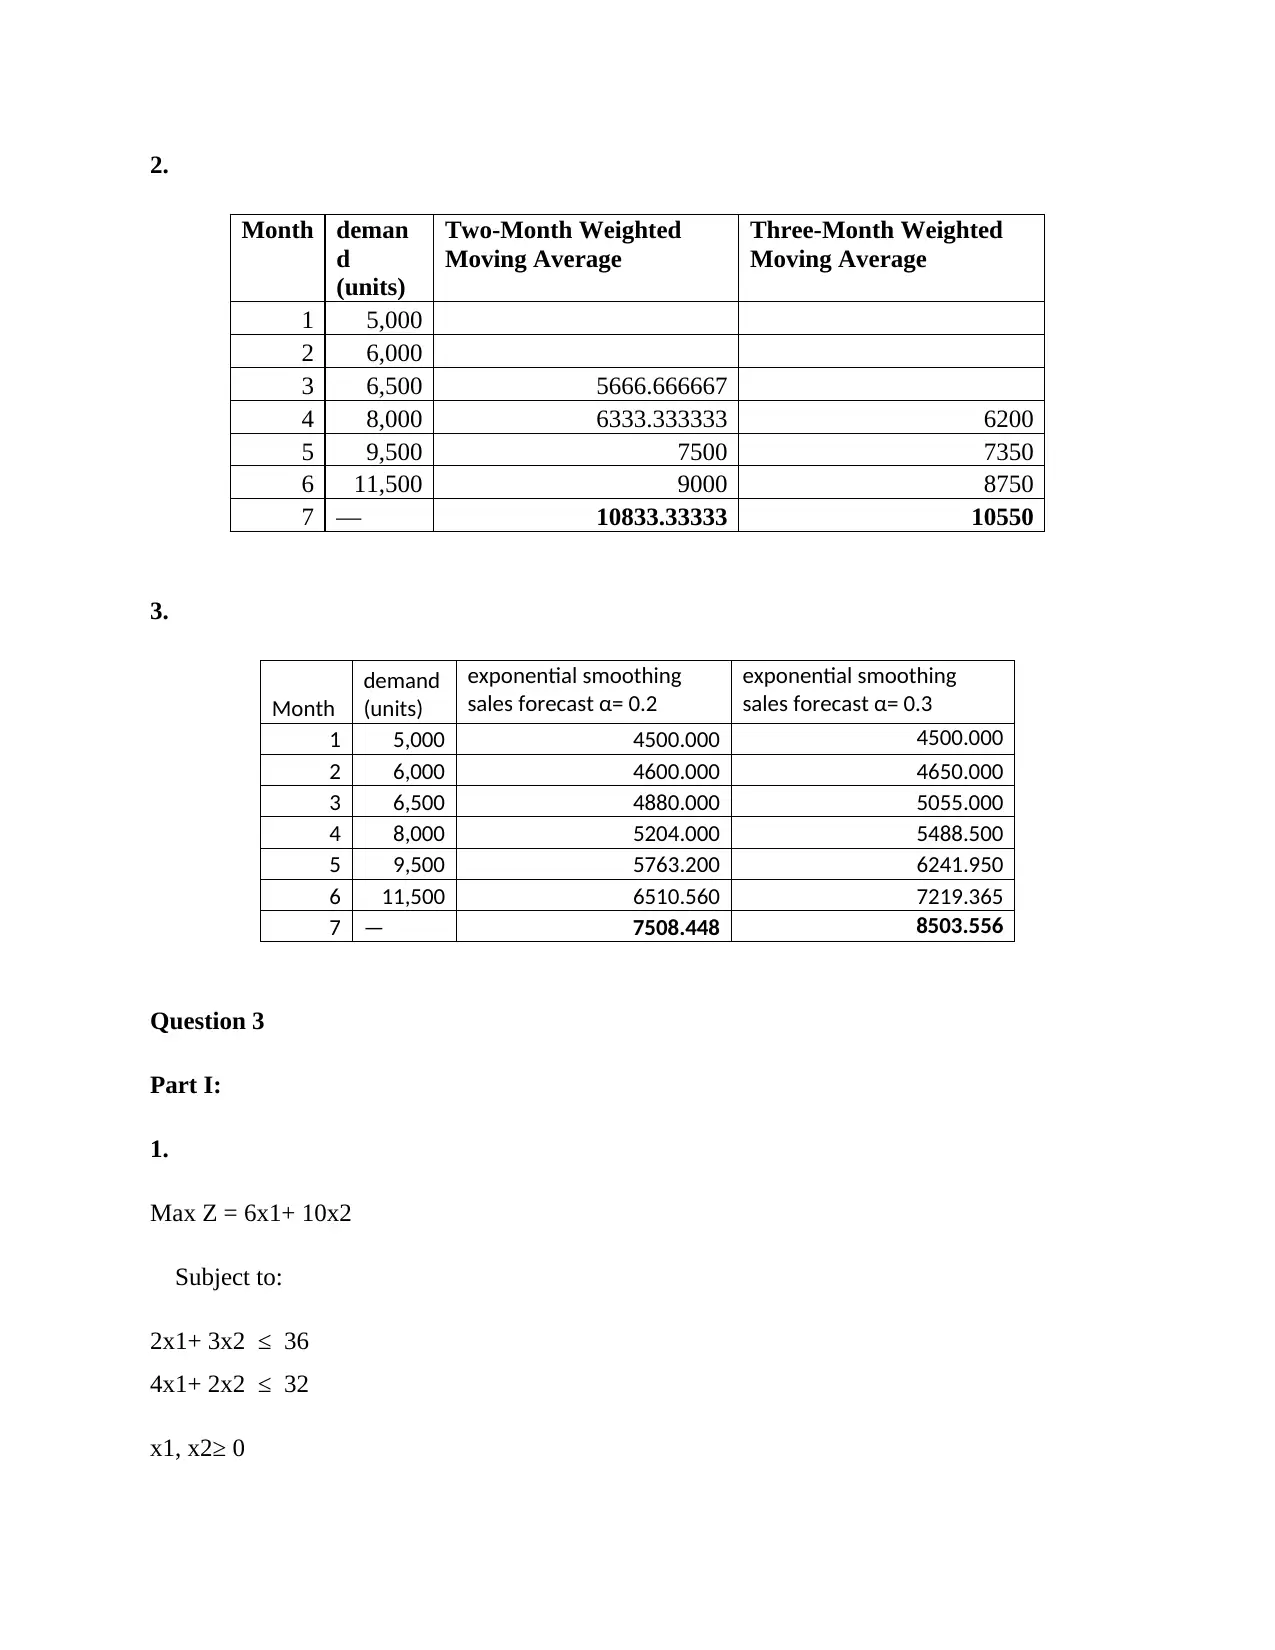
This statistics assignment provides solutions to problems covering several key areas. Question 1 focuses on regression analysis, including interpreting scatter diagrams, calculating regression equations, predicting values, interpreting R-squared, and hypothesis testing using the F-statistic. Question 2 explores forecasting techniques, including moving averages and exponential smoothing, to predict demand. Question 3 delves into linear programming, involving problem formulation, solving using graphical methods, and addressing special issues like unboundedness and redundancy. Finally, Question 4 addresses a minimum path problem. The solutions provide detailed calculations and interpretations for each problem, offering a comprehensive understanding of statistical concepts and their applications.
1 out of 6
Your All-in-One AI-Powered Toolkit for Academic Success.
+13062052269
info@desklib.com
Available 24*7 on WhatsApp / Email
![[object Object]](/_next/static/media/star-bottom.7253800d.svg)
Copyright © 2020–2026 A2Z Services. All Rights Reserved. Developed and managed by ZUCOL.