Statistics and Research Methods for Business Decisions - Analysis
VerifiedAdded on 2021/02/19
|21
|3174
|56
Homework Assignment
AI Summary
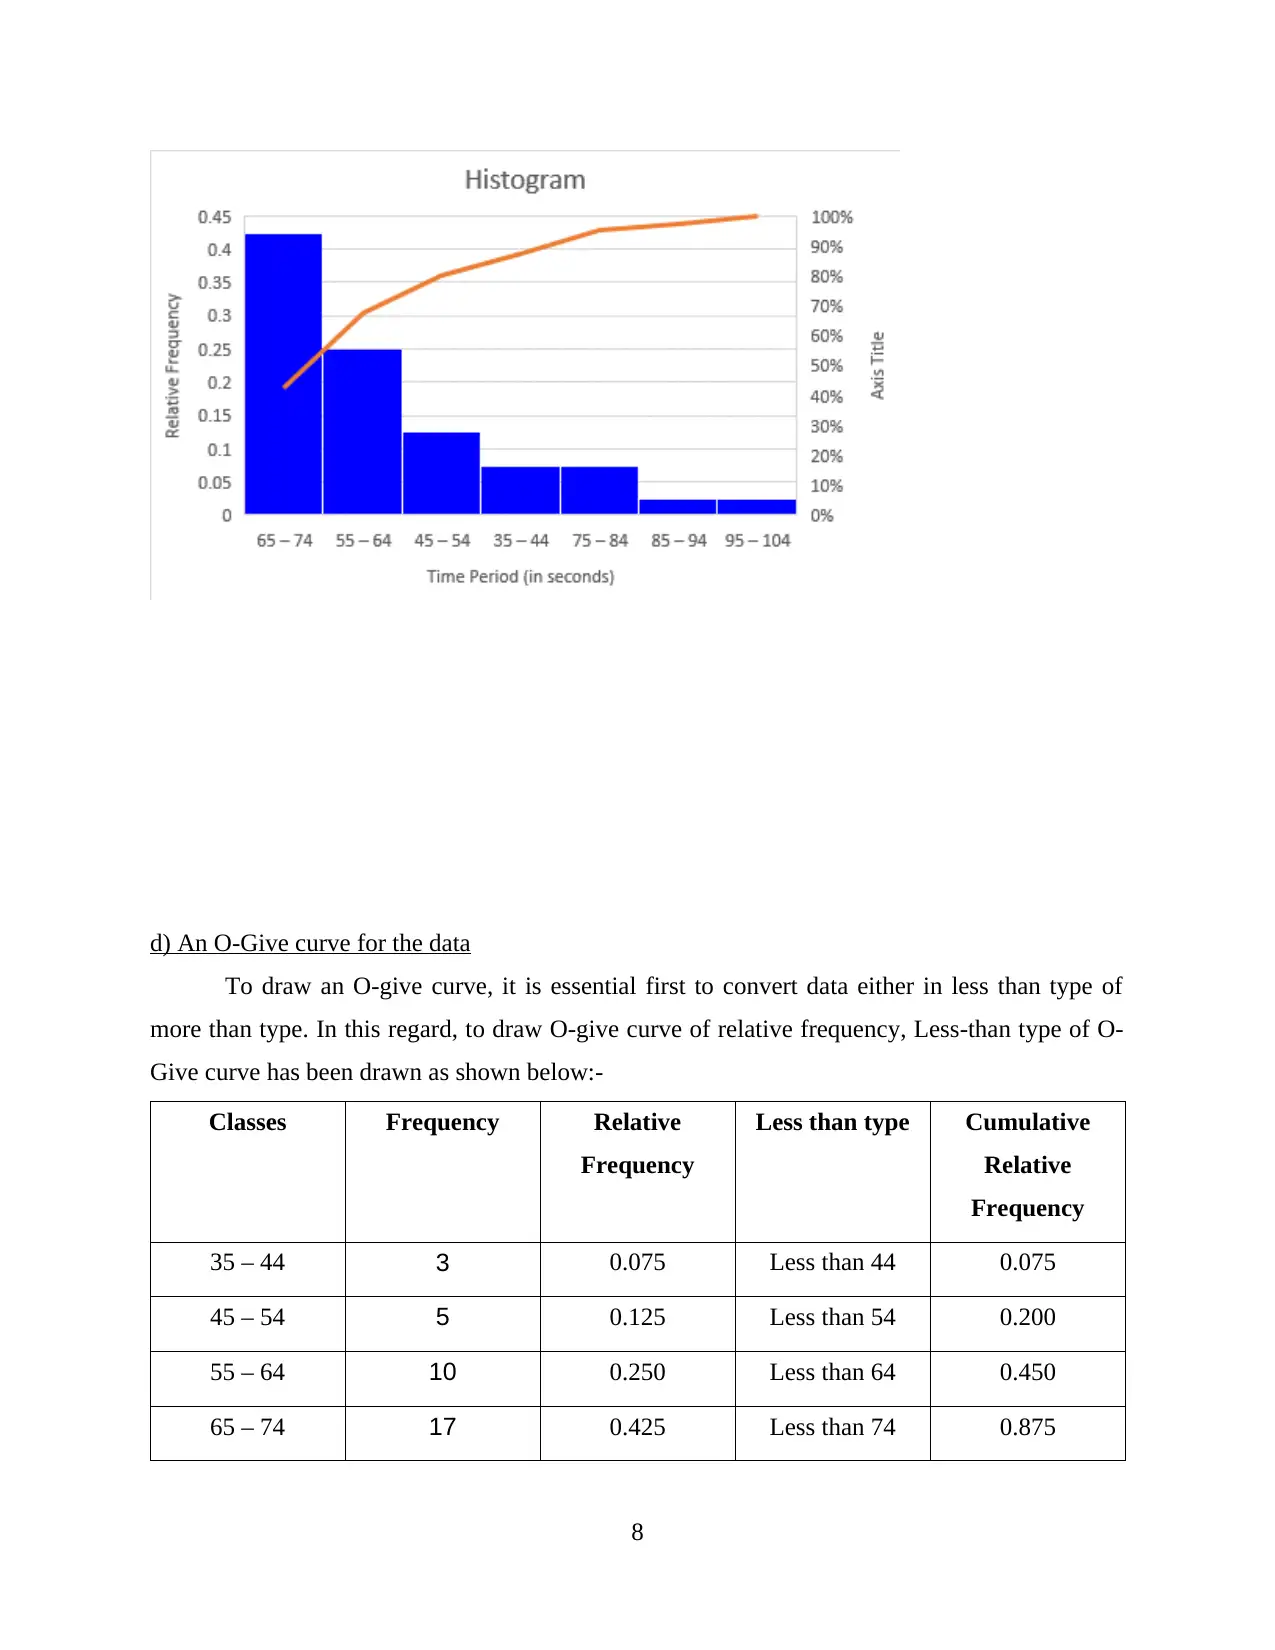
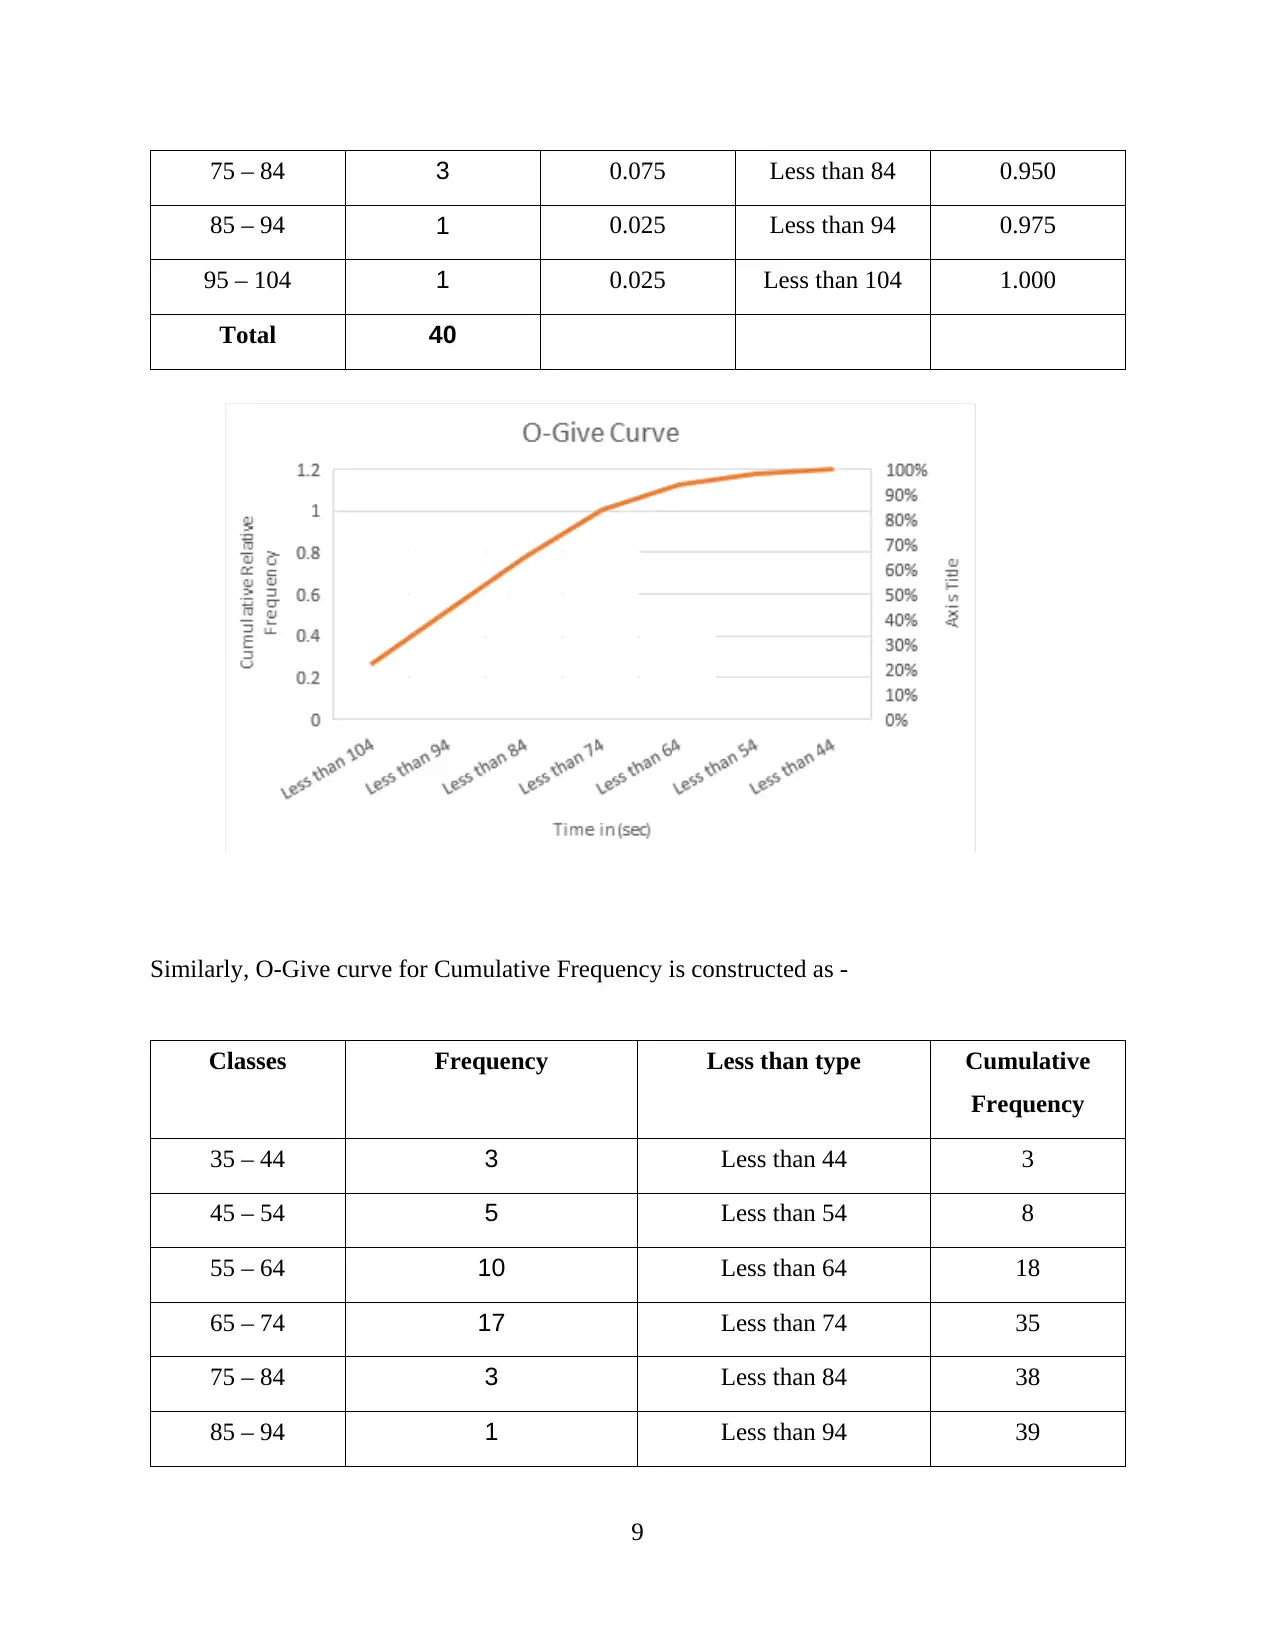
This document presents a comprehensive solution to a statistics assignment focused on business decision-making. The assignment addresses three key questions. Question 1 involves the graphical representation and analysis of CO2 emissions by producer countries, comparing data from 2009 and 2013, using both metric tonnes and percentage changes. Question 2 delves into frequency distributions, including frequency, relative frequency, cumulative frequency, and histogram construction, along with O-give curves and proportion calculations. Question 3 examines the relationship between inflation and investment returns, utilizing graphical descriptive measures of two variables, scatter plots, and correlation coefficients, referencing Australian inflation and the All-Ordinaries Index from 1995 to 2015. The solution provides detailed calculations, graphical representations, and insightful commentary, demonstrating a strong understanding of statistical concepts and their application in a business context.


1 out of 21
Related Documents


Your All-in-One AI-Powered Toolkit for Academic Success.
+13062052269
info@desklib.com
Available 24*7 on WhatsApp / Email
![[object Object]](/_next/static/media/star-bottom.7253800d.svg)
Copyright © 2020–2026 A2Z Services. All Rights Reserved. Developed and managed by ZUCOL.