Statistics Assignment: Descriptive Statistics and Regression Analysis

Verified

Added on  2020/05/11

|11
|533
|120
Homework Assignment
AI Summary
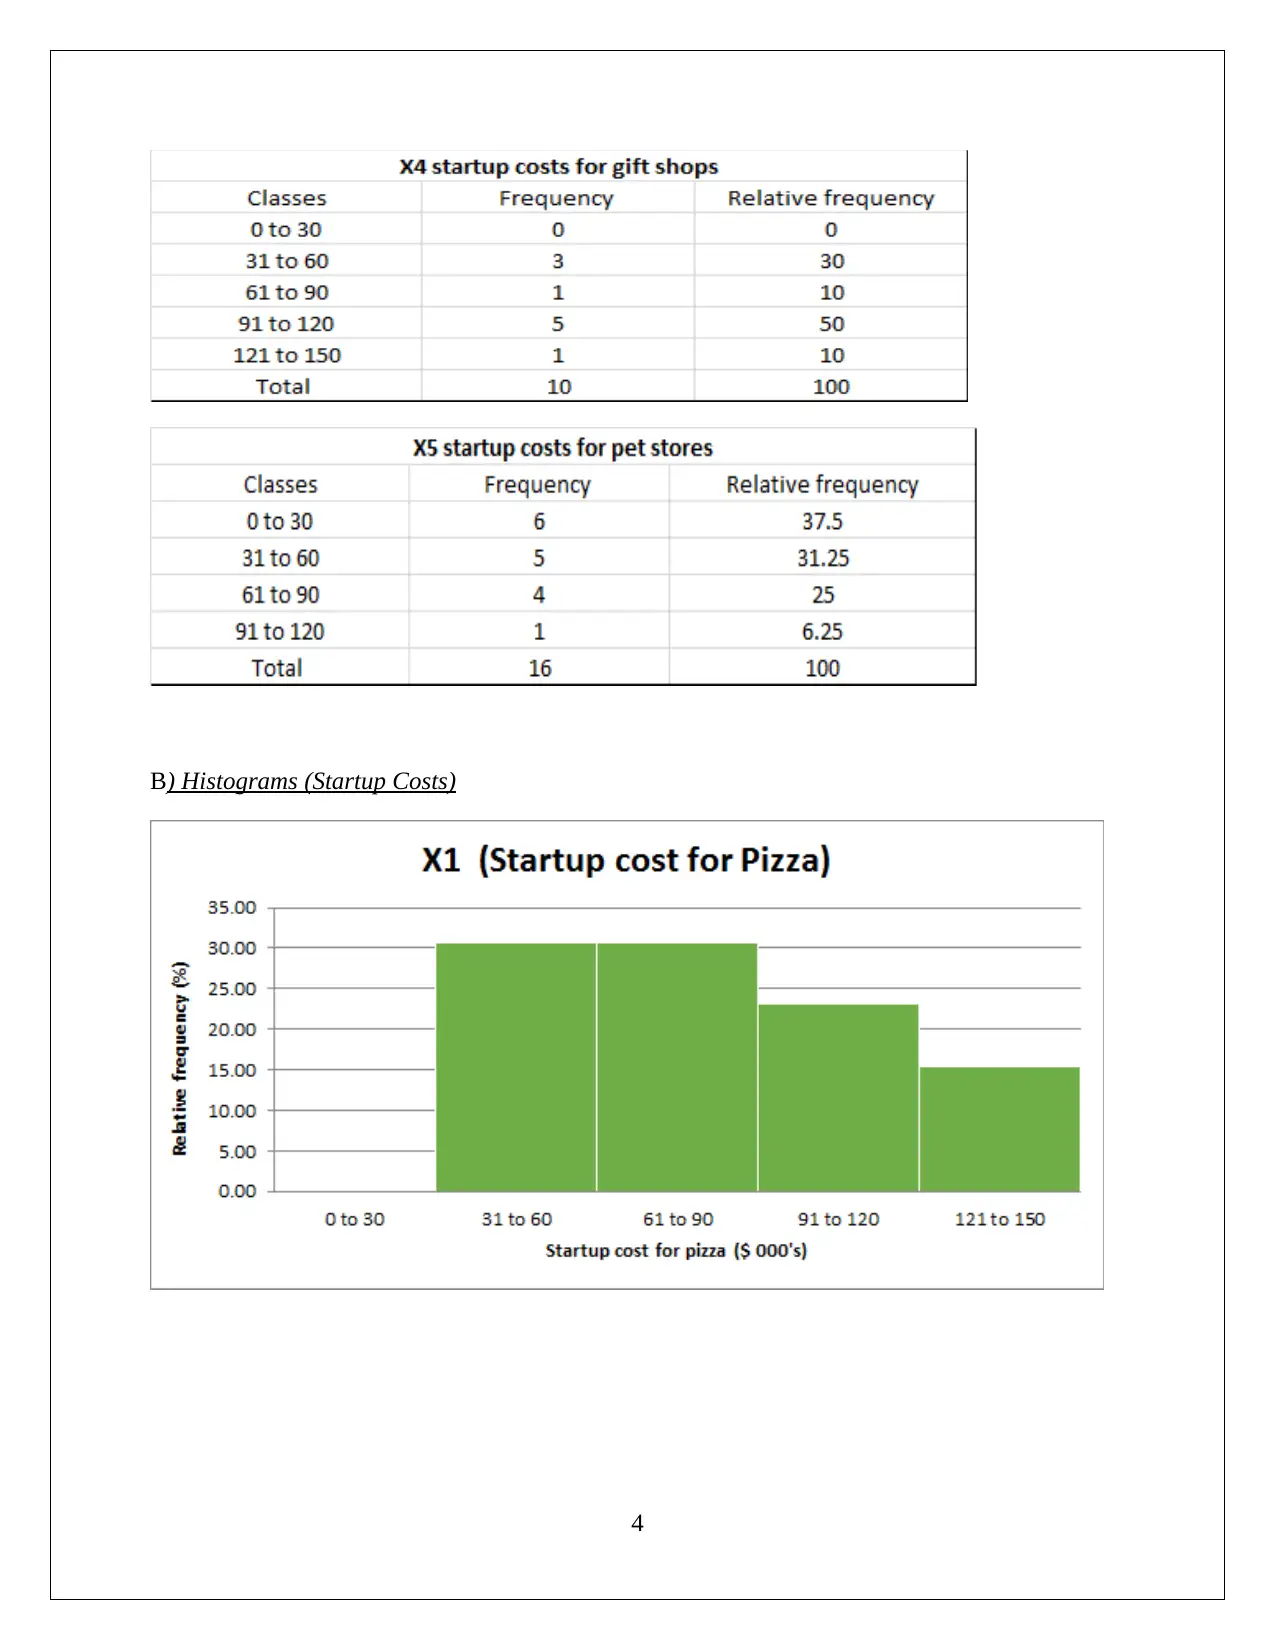
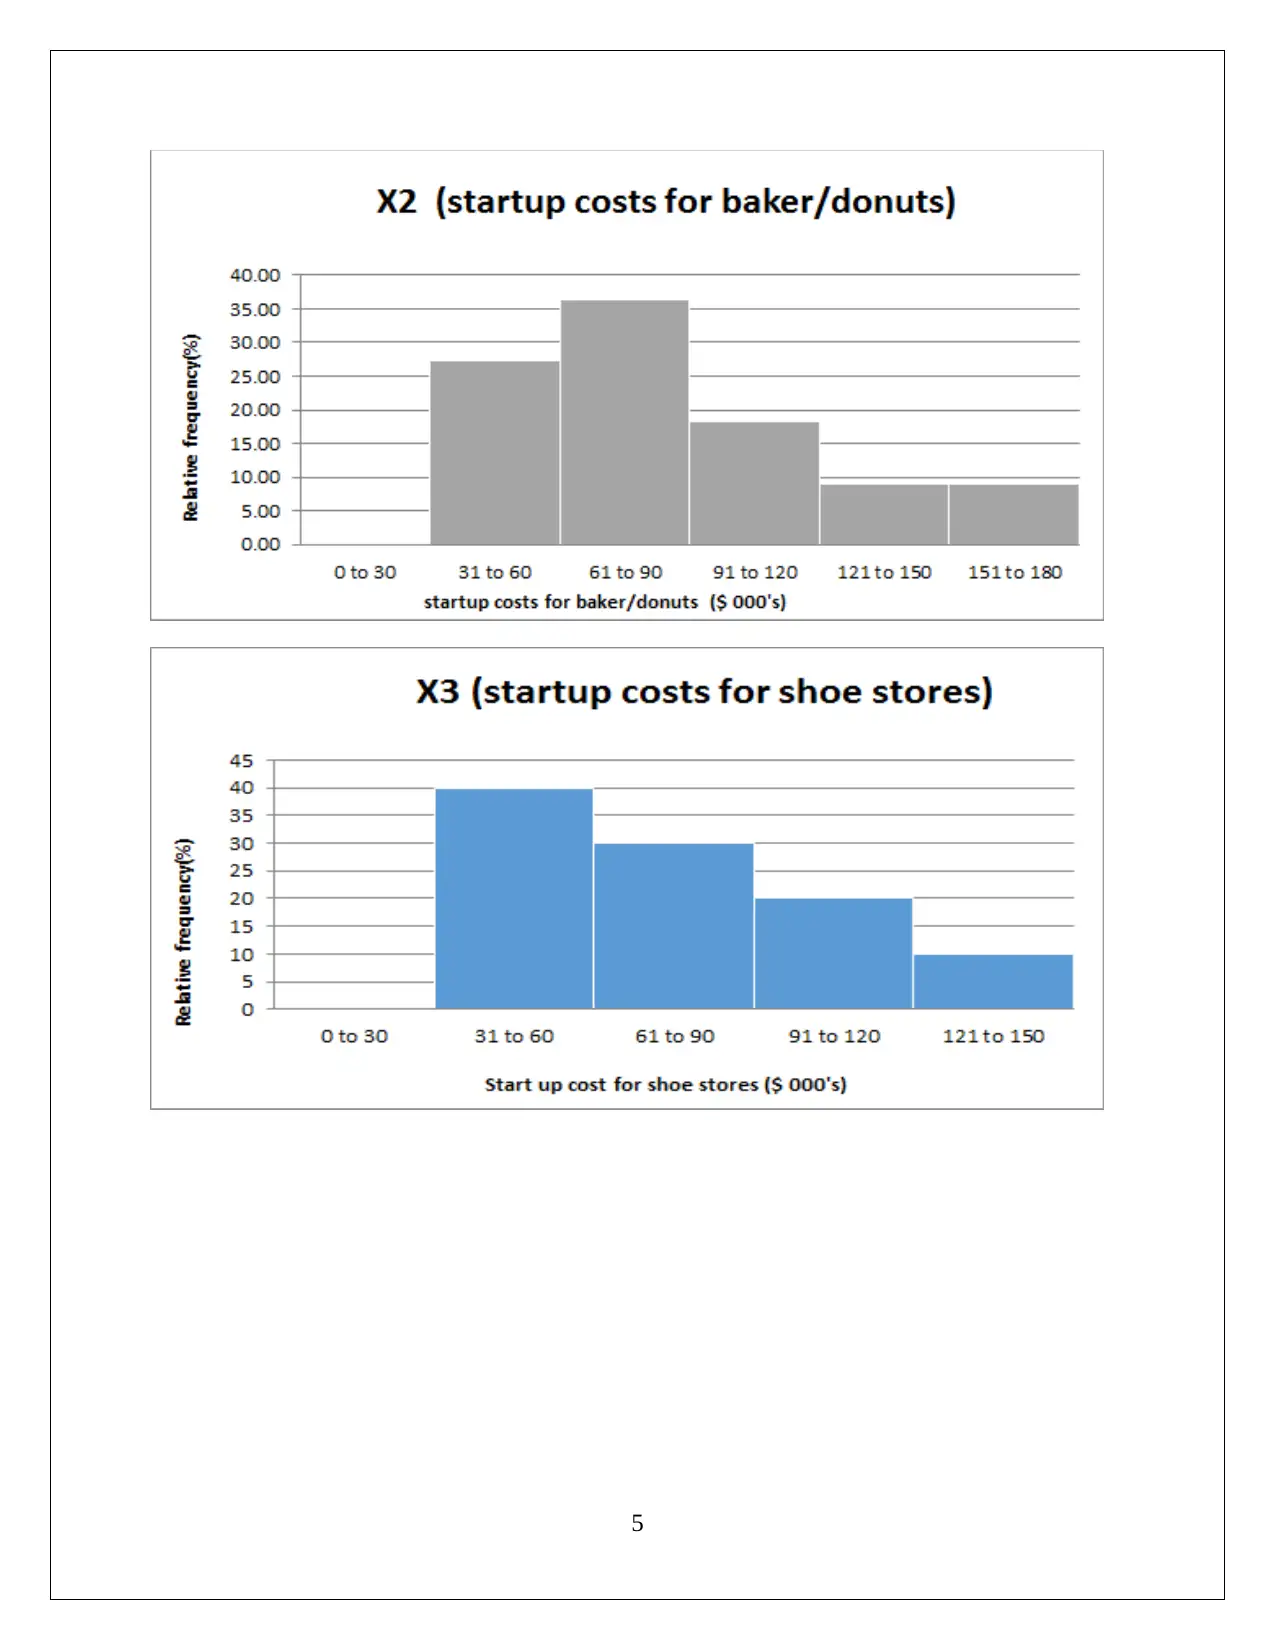
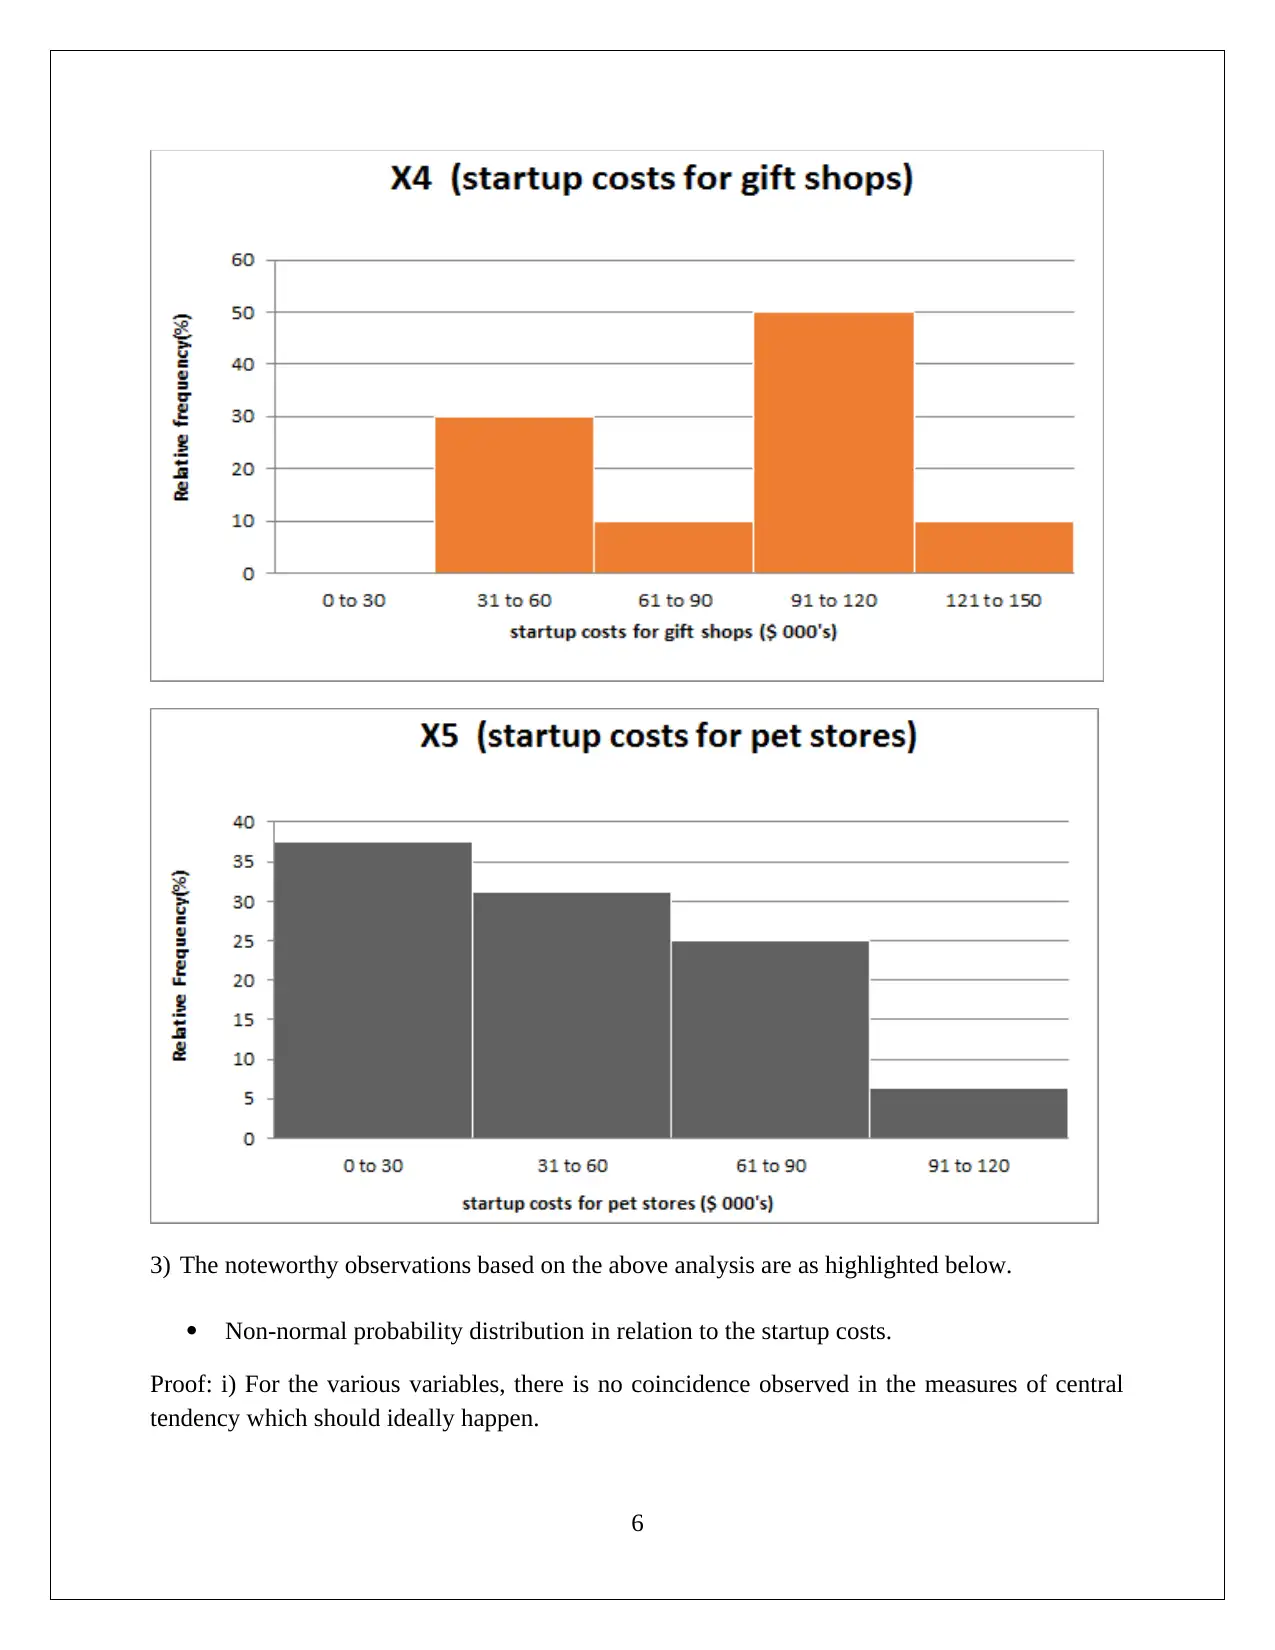
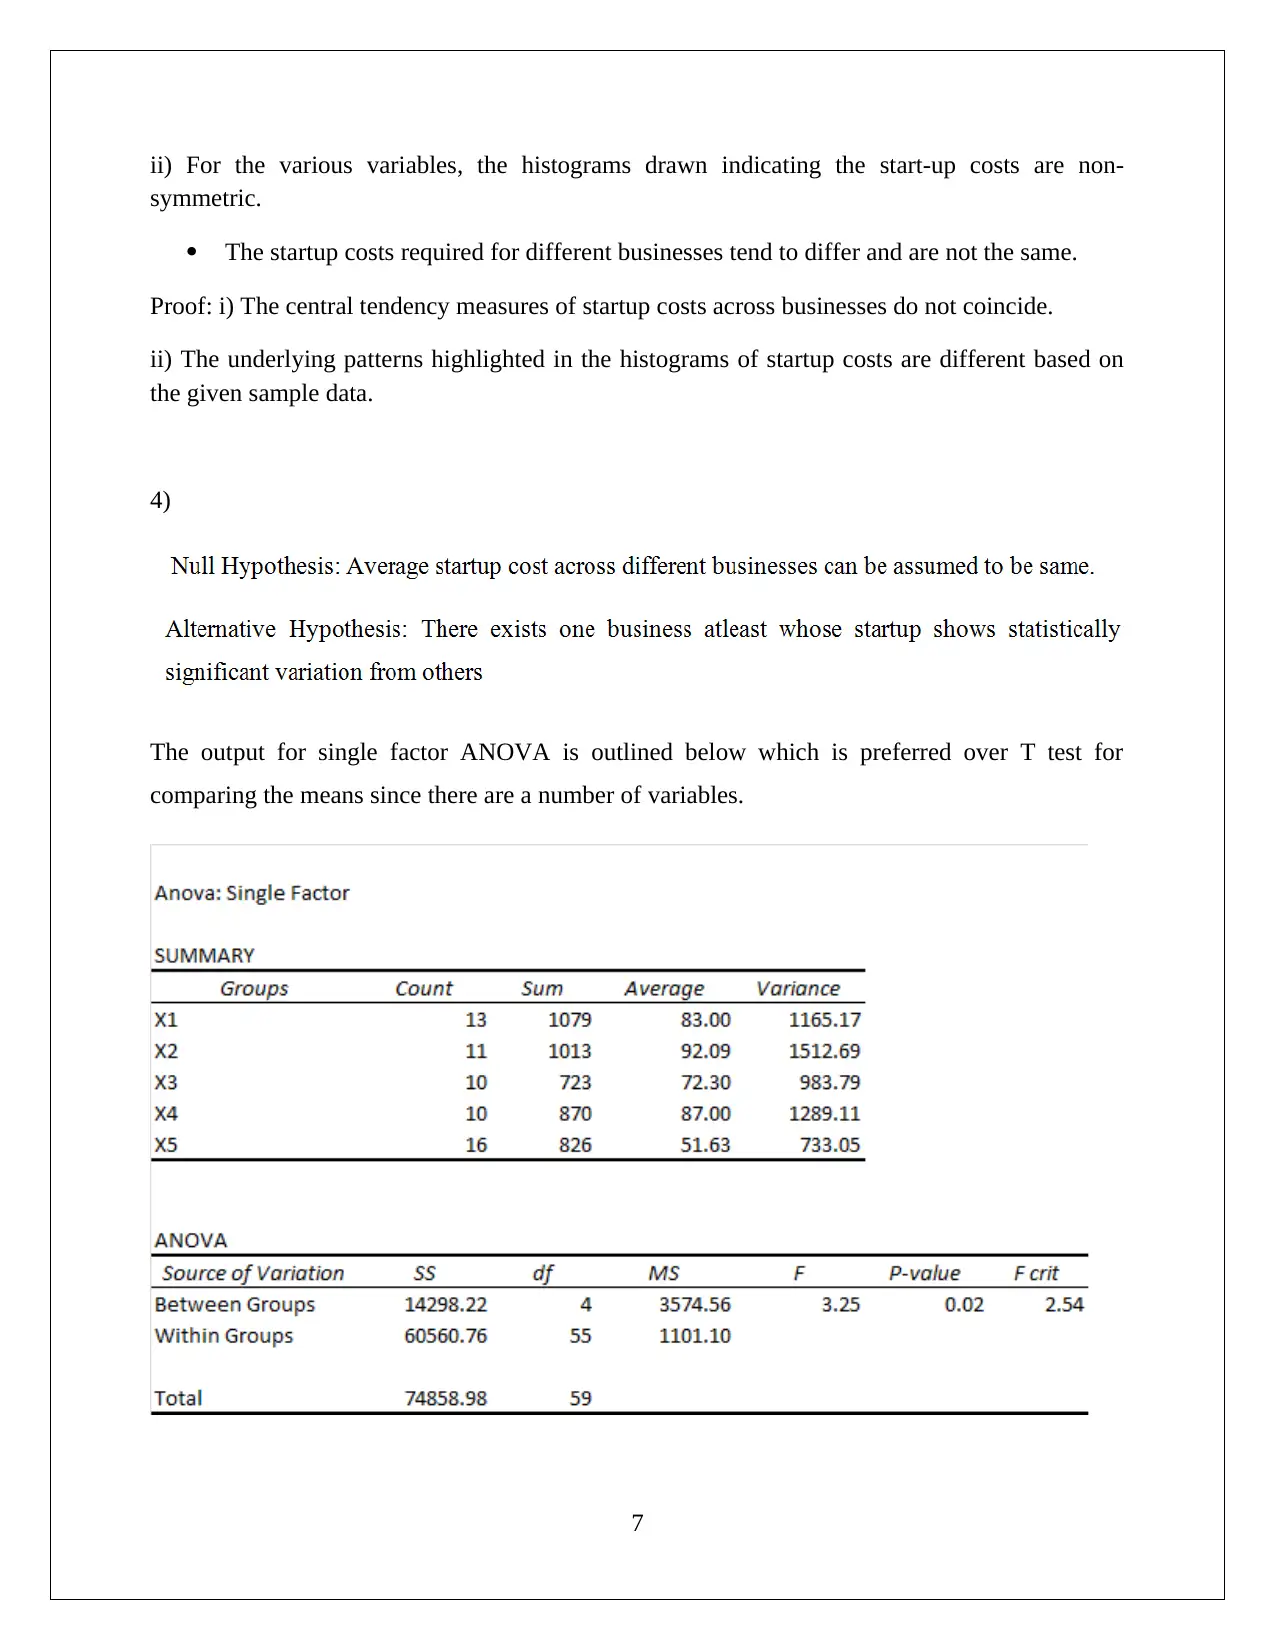
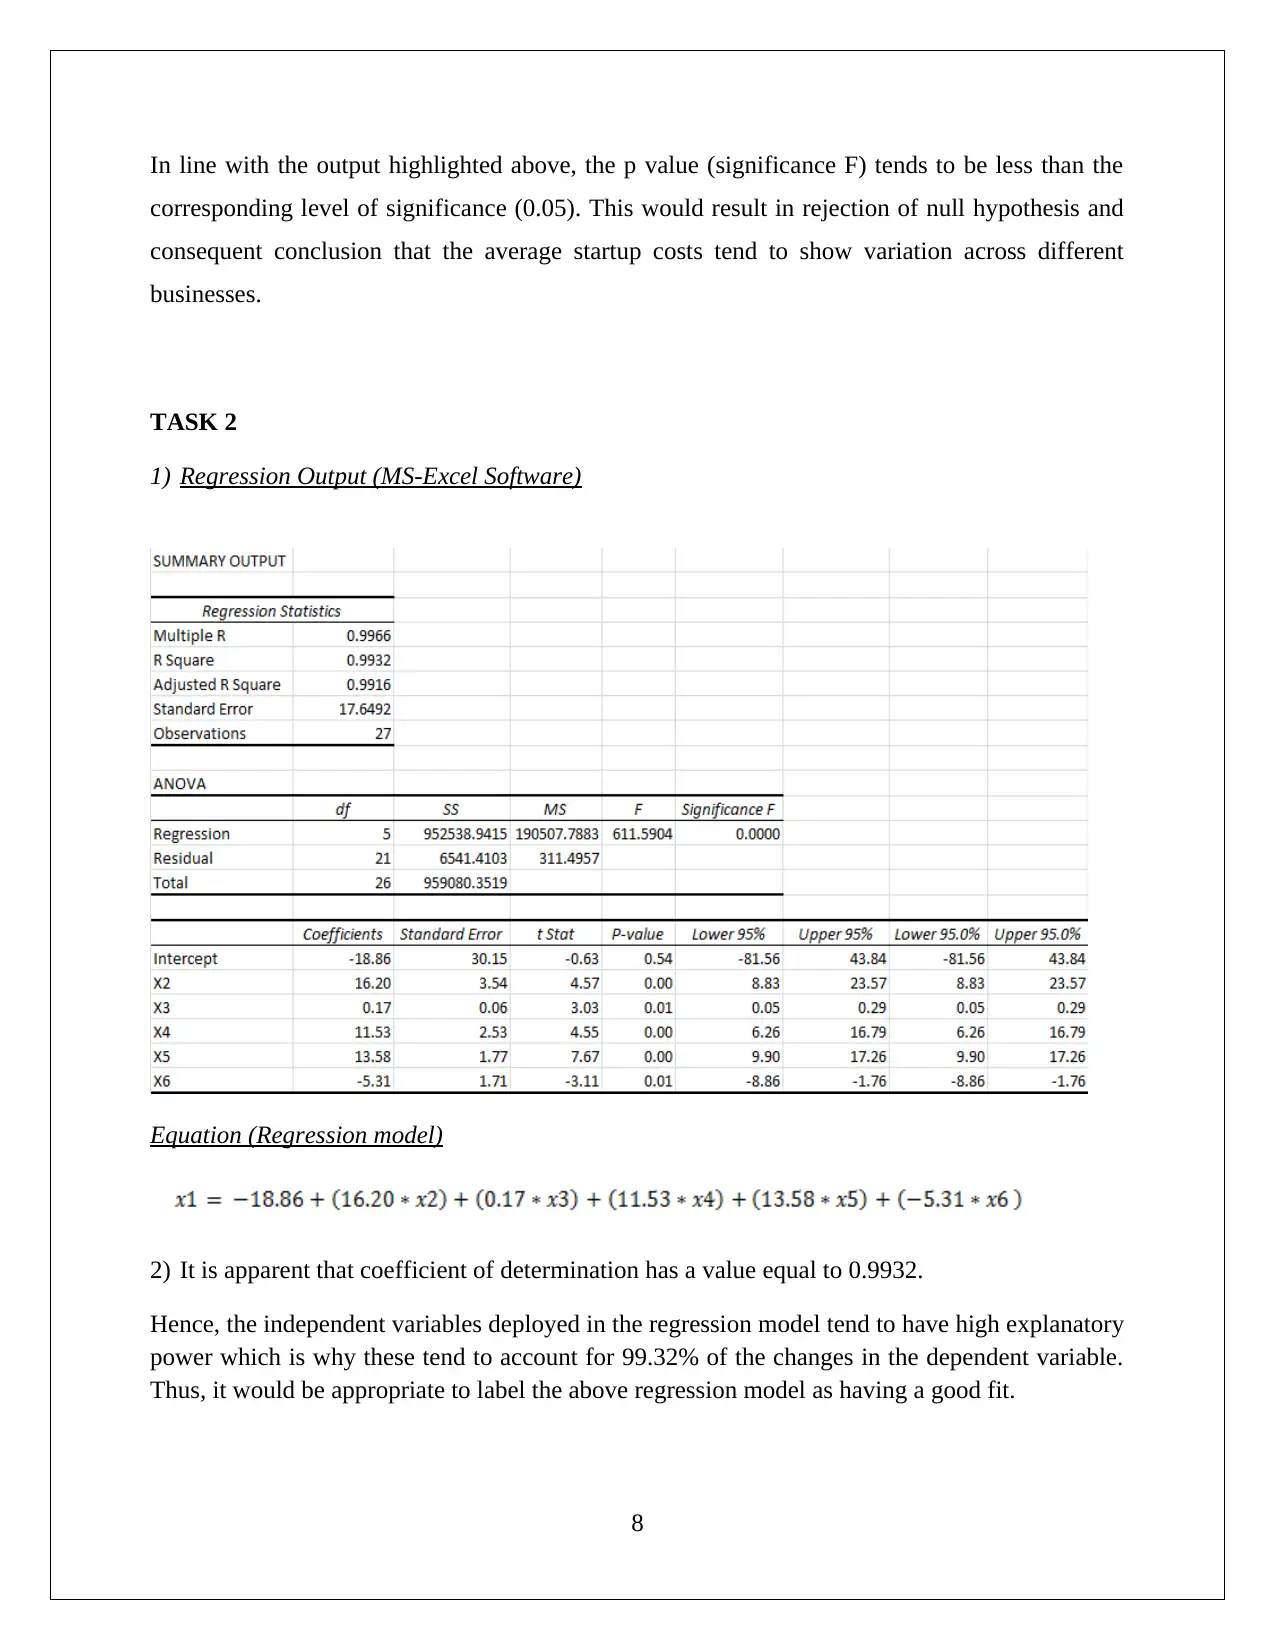
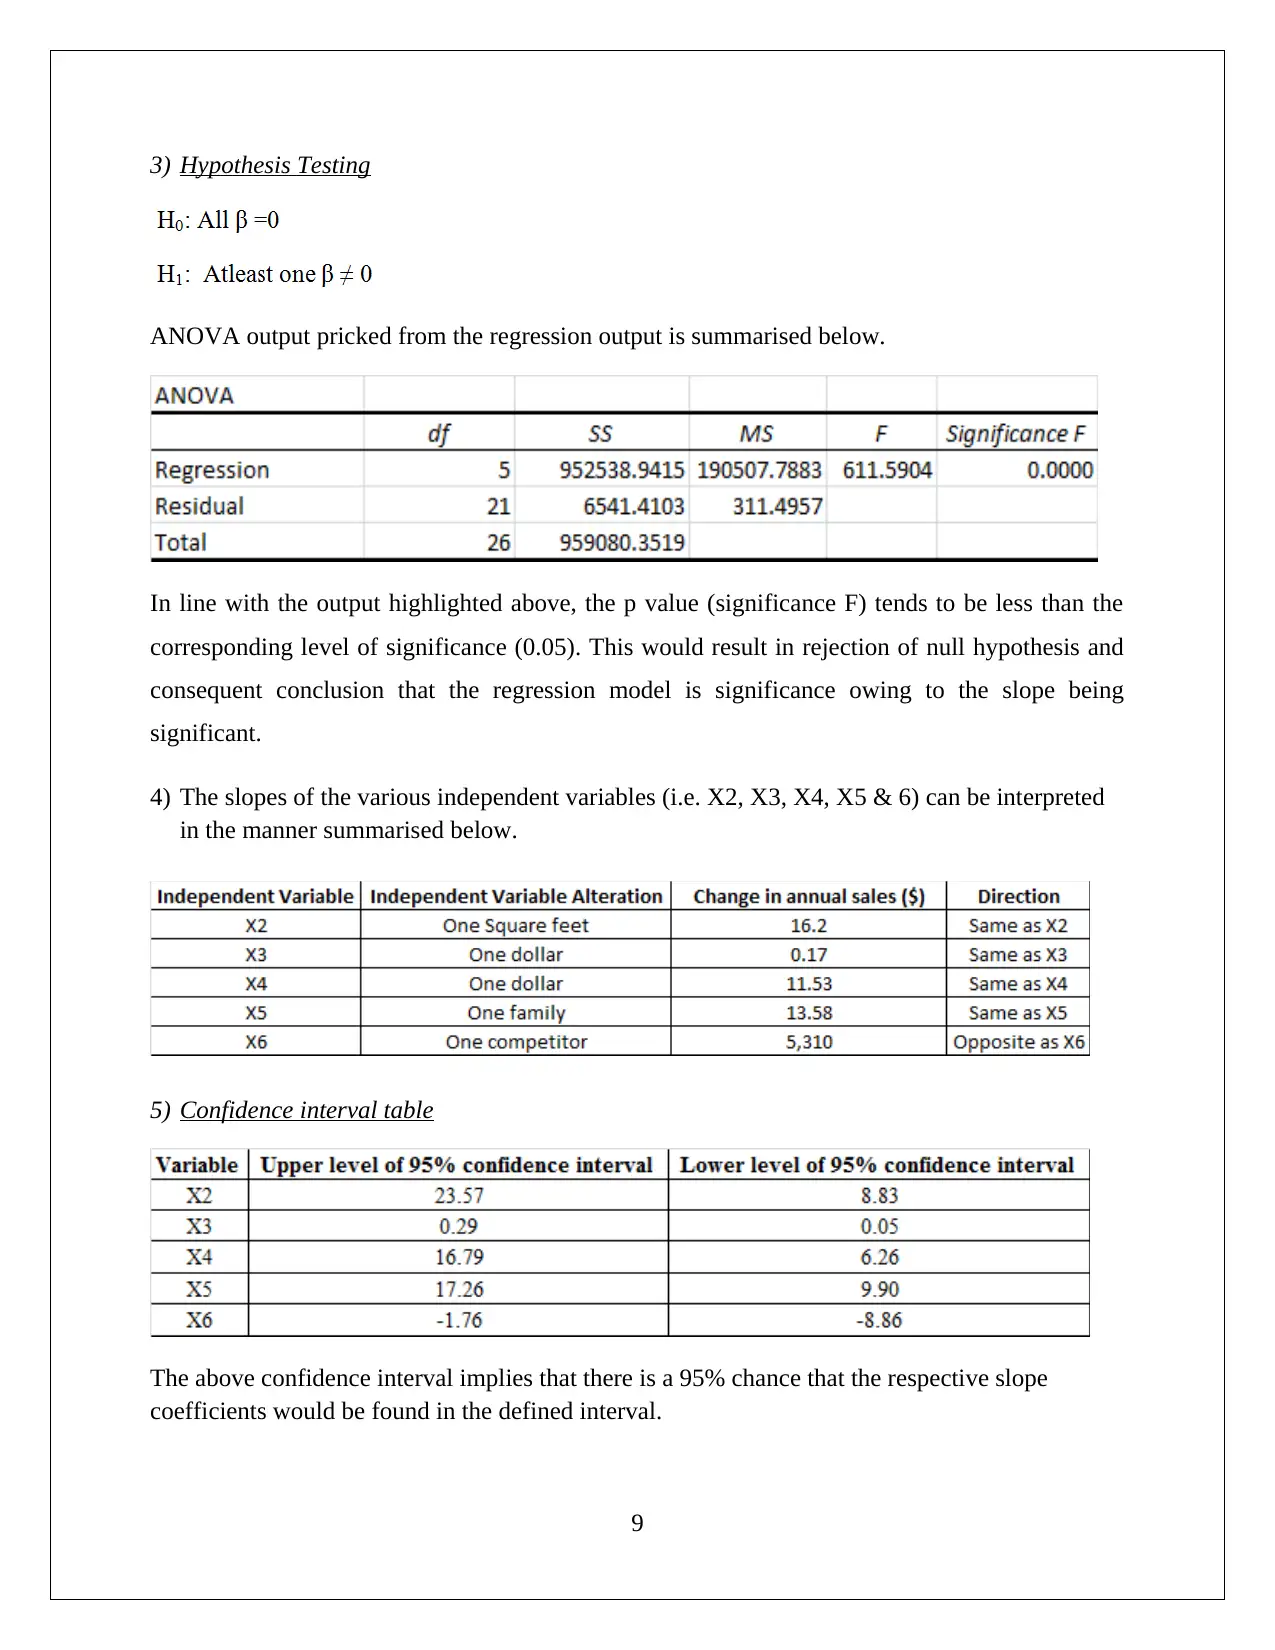
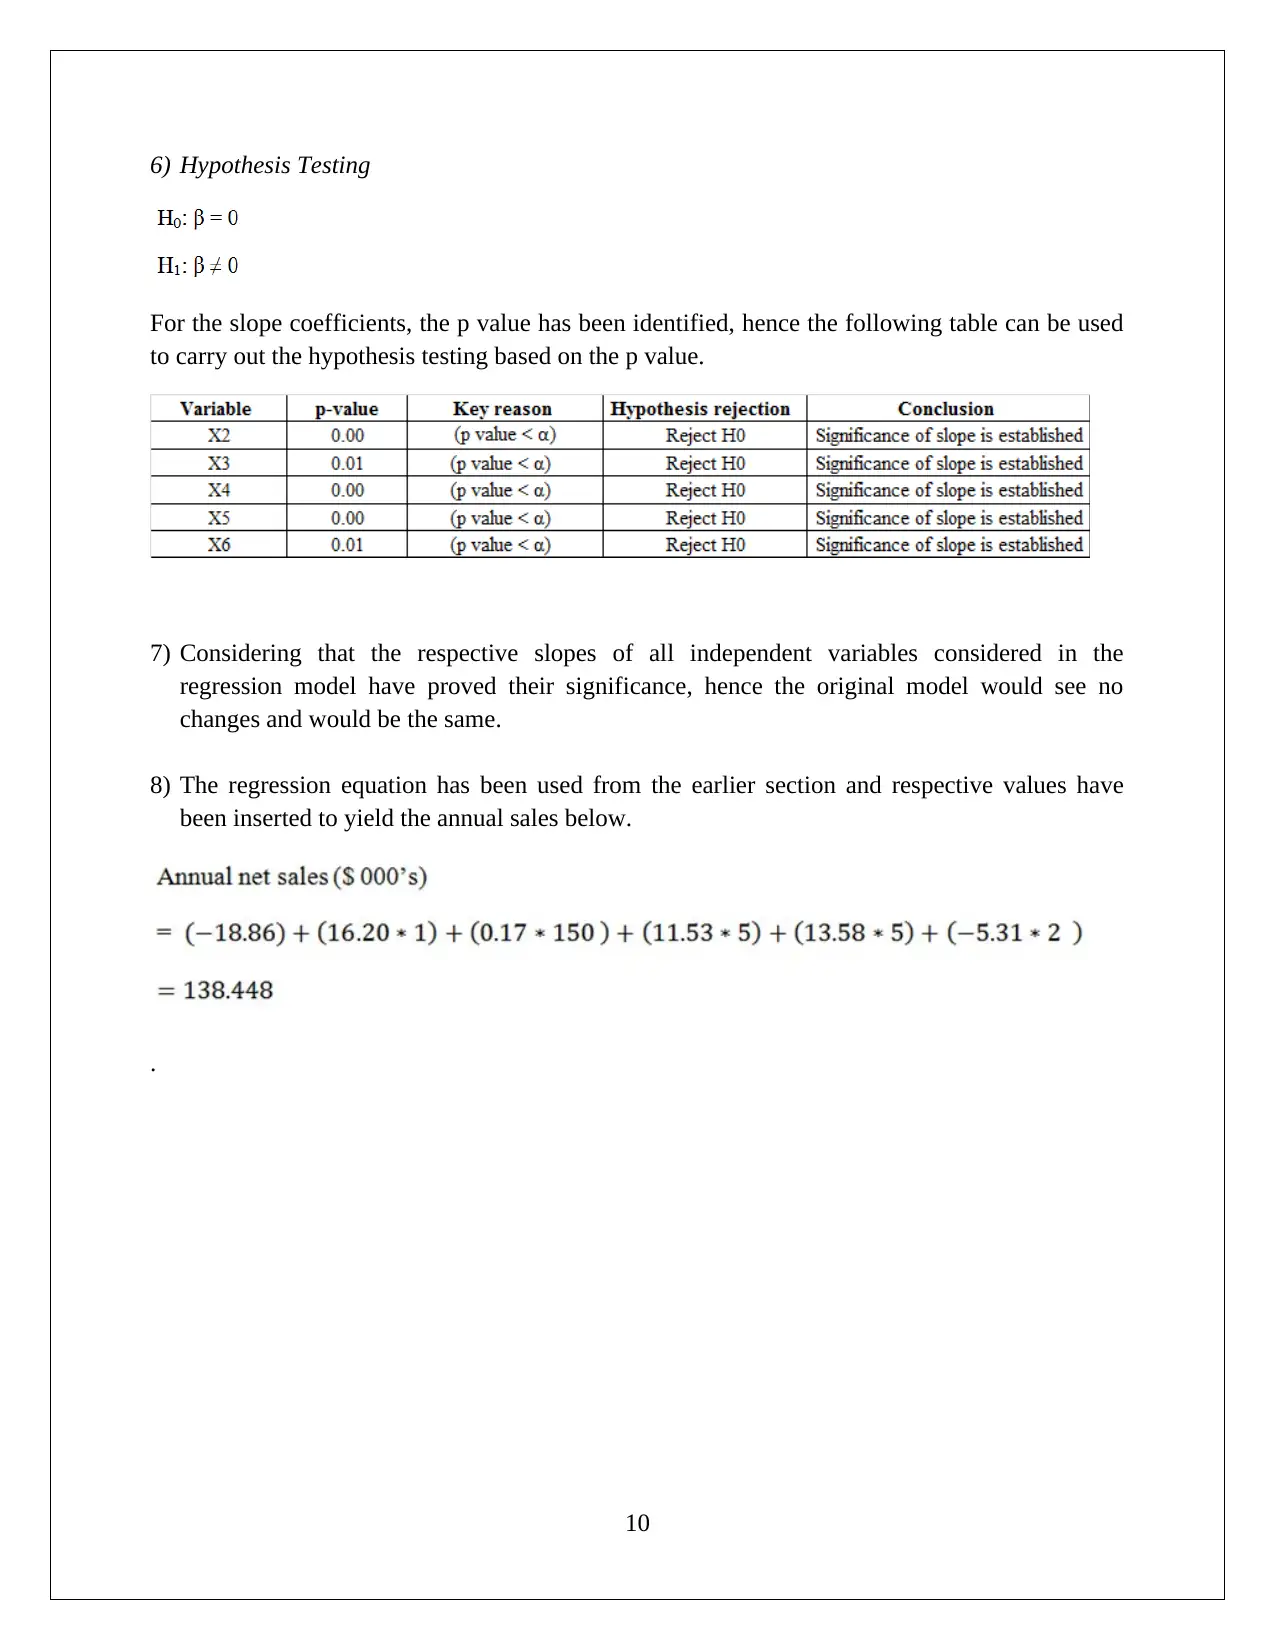
This statistics assignment delves into descriptive statistics and regression analysis, focusing on the analysis of startup costs. The assignment begins with an analysis of frequency distributions and histograms to understand the non-normal probability distribution of startup costs. It then proceeds to perform an ANOVA test to compare the means of startup costs across different businesses. The core of the assignment involves a regression model, where the coefficient of determination is used to assess the model's explanatory power. Hypothesis testing is conducted on the regression model, followed by an analysis of the slopes of independent variables and the creation of confidence intervals. The assignment concludes with the interpretation of the regression equation and its application in predicting annual sales. This assignment is a great resource for students looking to understand statistical concepts and how they apply to real-world business problems, all available on Desklib.
Document Page
STATISTICS
Student Id
[Pick the date]
tabler-icon-diamond-filled.svg

Paraphrase This Document

Need a fresh take? Get an instant paraphrase of this document with our AI Paraphraser
Document Page
TASK 1
1) Requisite descriptive statistics in relation to central tendency and dispersion of the data re
highlighted below.
1
Document Page
2
Document Page
2) A) Tables(Frequency Distribution)
3
tabler-icon-diamond-filled.svg

Paraphrase This Document

Need a fresh take? Get an instant paraphrase of this document with our AI Paraphraser
Document Page
B) Histograms (Startup Costs)
4
Document Page
5
Document Page
3) The noteworthy observations based on the above analysis are as highlighted below.
Non-normal probability distribution in relation to the startup costs.
Proof: i) For the various variables, there is no coincidence observed in the measures of central
tendency which should ideally happen.
6
tabler-icon-diamond-filled.svg

Paraphrase This Document

Need a fresh take? Get an instant paraphrase of this document with our AI Paraphraser
Document Page
ii) For the various variables, the histograms drawn indicating the start-up costs are non-
symmetric.
The startup costs required for different businesses tend to differ and are not the same.
Proof: i) The central tendency measures of startup costs across businesses do not coincide.
ii) The underlying patterns highlighted in the histograms of startup costs are different based on
the given sample data.
4)
The output for single factor ANOVA is outlined below which is preferred over T test for
comparing the means since there are a number of variables.
7
Document Page
In line with the output highlighted above, the p value (significance F) tends to be less than the
corresponding level of significance (0.05). This would result in rejection of null hypothesis and
consequent conclusion that the average startup costs tend to show variation across different
businesses.
TASK 2
1) Regression Output (MS-Excel Software)
Equation (Regression model)
2) It is apparent that coefficient of determination has a value equal to 0.9932.
Hence, the independent variables deployed in the regression model tend to have high explanatory
power which is why these tend to account for 99.32% of the changes in the dependent variable.
Thus, it would be appropriate to label the above regression model as having a good fit.
8
Document Page
3) Hypothesis Testing
ANOVA output pricked from the regression output is summarised below.
In line with the output highlighted above, the p value (significance F) tends to be less than the
corresponding level of significance (0.05). This would result in rejection of null hypothesis and
consequent conclusion that the regression model is significance owing to the slope being
significant.
4) The slopes of the various independent variables (i.e. X2, X3, X4, X5 & 6) can be interpreted
in the manner summarised below.
5) Confidence interval table
The above confidence interval implies that there is a 95% chance that the respective slope
coefficients would be found in the defined interval.
9
tabler-icon-diamond-filled.svg

Paraphrase This Document

Need a fresh take? Get an instant paraphrase of this document with our AI Paraphraser
Document Page
6) Hypothesis Testing
For the slope coefficients, the p value has been identified, hence the following table can be used
to carry out the hypothesis testing based on the p value.
7) Considering that the respective slopes of all independent variables considered in the
regression model have proved their significance, hence the original model would see no
changes and would be the same.
8) The regression equation has been used from the earlier section and respective values have
been inserted to yield the annual sales below.
.
10
chevron_up_icon
1 out of 11
circle_padding
hide_on_mobile
zoom_out_icon
[object Object]