Ask a question from expert
Introductory Statistics - STAT670
16 Pages1974 Words150 Views
Introductory Statistics (STAT670)
Added on 2020-04-21
Introductory Statistics - STAT670
Introductory Statistics (STAT670)
Added on 2020-04-21
BookmarkShareRelated Documents
StatisticsStudent Name:Student ID:Course: Date: 1st November 2017

Report 1 IntroductionA study was undertaken to investigate whether death rates could be predicted from factorsrelated to air pollution, weather and/or socioeconomic variables. In this report we present theresults of the regression analysis that was conducted.MethodsRegression analysis model was conducted to predict death rate from each of the 6 potentialpredictors (Average annual precipitation, Average January maximum temperature, Average Julymaximum temperature, Average household size (number of people in a household), Percentagewhite population in urbanized areas and Relative sulphur dioxide pollution potential in 1960).Analysis of data was done using Minitab. Six different regression models were performed. Thedata file contained data recorded on a random sample of 60 metropolitan areas in the USA. Eachmetropolitan area contains information from the late 1950s-early 1960s recorded on the each ofthe variables described below. ResultsAs mentioned in the methodology, six different regression models were performed. Table 1: Regression modelsModelIndependent VariableR-SquaredCoefficientP-valueModel 1Average annual precipitation26.0%3.170.000Model 2AverageJanuarymaximumtemperature0.3%-0.300.660Model 3AverageJulymaximumtemperature7.8%3.630.031
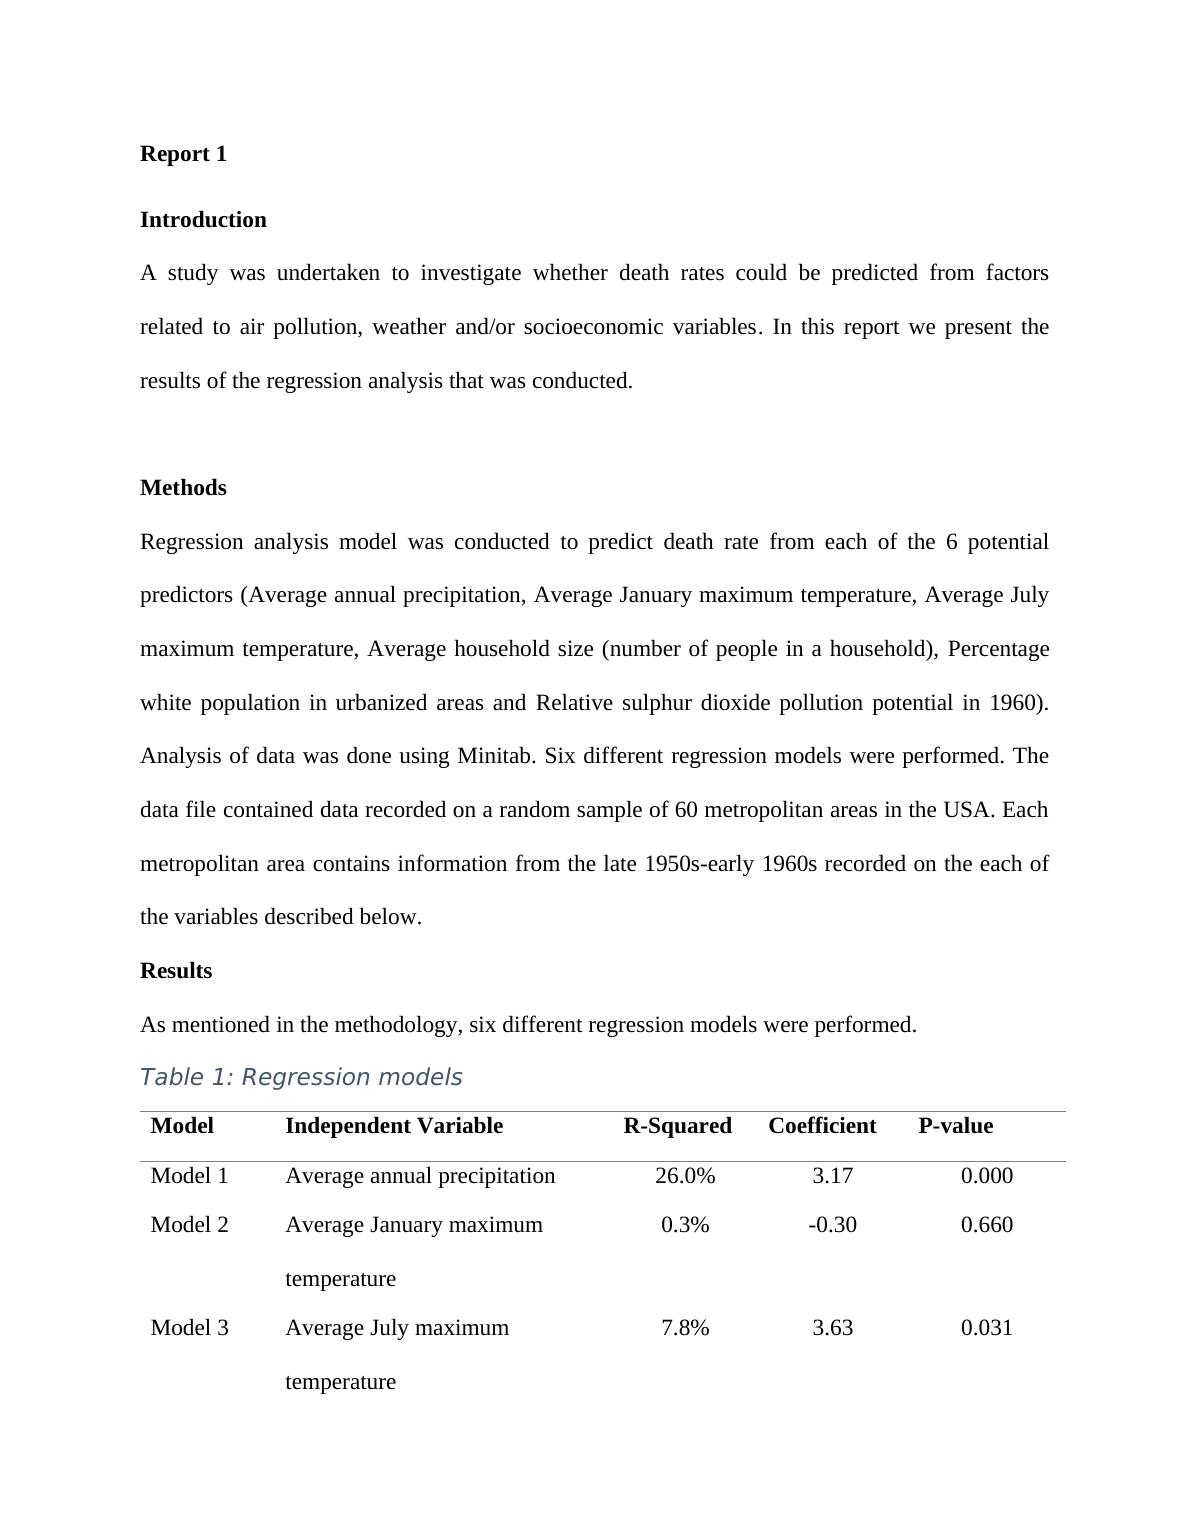
Model 4Average household size12.8%164.340.005Model 5Percentagewhitepopulationinurbanized areas41.4%-4.490.000Model 6Relative sulphur dioxidepollution potential in 196018.1%0.420.001Ascanbeseenfromtable1,itisonlymodel2(independentvariablebeing“AverageJanuarymaximum temperature”) that was found to be insignificance (p-value > 0.05). The rest of the othermodels were significant.The best predictor of mortality is the “Percentagewhitepopulationin urbanized areas”, this isbased on the fact that it explains a large proportion of variation (41.4%) in the dependentvariable (mortality).Interpretation of the coefficients for the significant predictorsThe coefficient of the Average annual precipitation is 3.17; this suggests that a unitincrease in the Average annual precipitation would result to an increase in the mortalityby 3.17. Similarly, a unit decrease in the Average annual precipitation would result to adecrease in the mortality by 3.17.The coefficient of the AverageJulymaximum temperature is 3.63; this suggests that aunit increase in the AverageJulymaximum temperature would result to an increase in themortality by 3.63. Similarly, a unit decrease in the AverageJulymaximum temperaturewould result to a decrease in the mortality by 3.63.The coefficient of the Average household size is 164.34; this suggests that a unit increasein the Average household size would result to an increase in the mortality by 164.34.Similarly, a unit decrease in the Average household size would result to a decrease in themortality by 164.34.
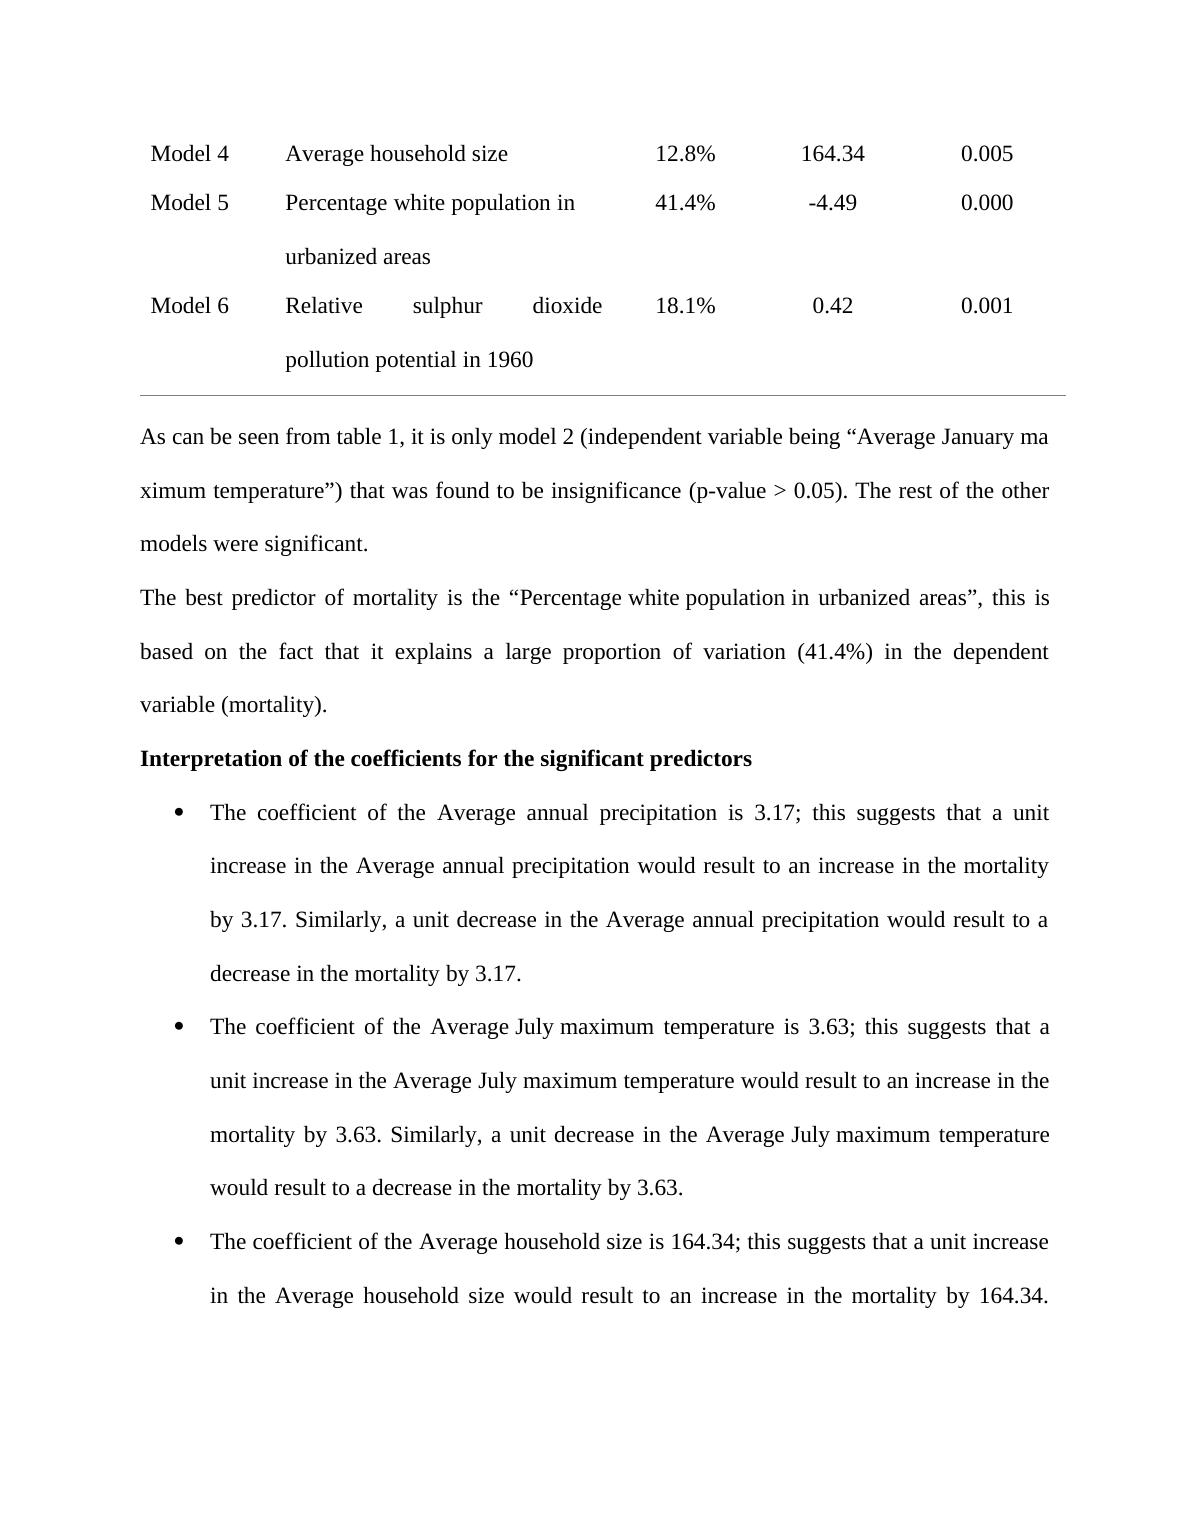
The coefficient of the Percentagewhitepopulationin urbanized areas is -4.49; thissuggests that a unit increase in the Percentagewhitepopulationin urbanized areas wouldresult to a decrease in the mortality by 4.49. Similarly, a unit decrease in thePercentagewhitepopulationin urbanized areas would result to an increase in themortality by 4.49.The coefficient of the Relative sulphur dioxide pollution potential in 1960 is 0.42; thissuggests that a unit increase in the Relative sulphur dioxide pollution potential in 1960would result to an increase in the mortality by 0.42. Similarly, a unit decrease in theRelative sulphur dioxide pollution potential in 1960 would result to a decrease in themortality by 0.42.ConclusionThis study sought to predict the mortality using the different predictors. Results showed that 5out 6 predictors were significant in the model. AverageJanuarymaximum temperature wasfound to be insignificant in the model (p-value > 0.05). The best predictor of mortality is the“Percentagewhitepopulationin urbanized areas”, this is based on the fact that it explains a largeproportion of variation (41.4%) in the dependent variable (mortality).AppendixModel 1:Regression Analysis: Mort versus Precip The regression equation isMort = 822 + 3.17 Precip
End of preview
Want to access all the pages? Upload your documents or become a member.