Statistics Summative Assessment 1: GHG Emission, ANOVA & Correlation

Verified

Added on  2023/06/15

|8
|856
|189
Homework Assignment
AI Summary
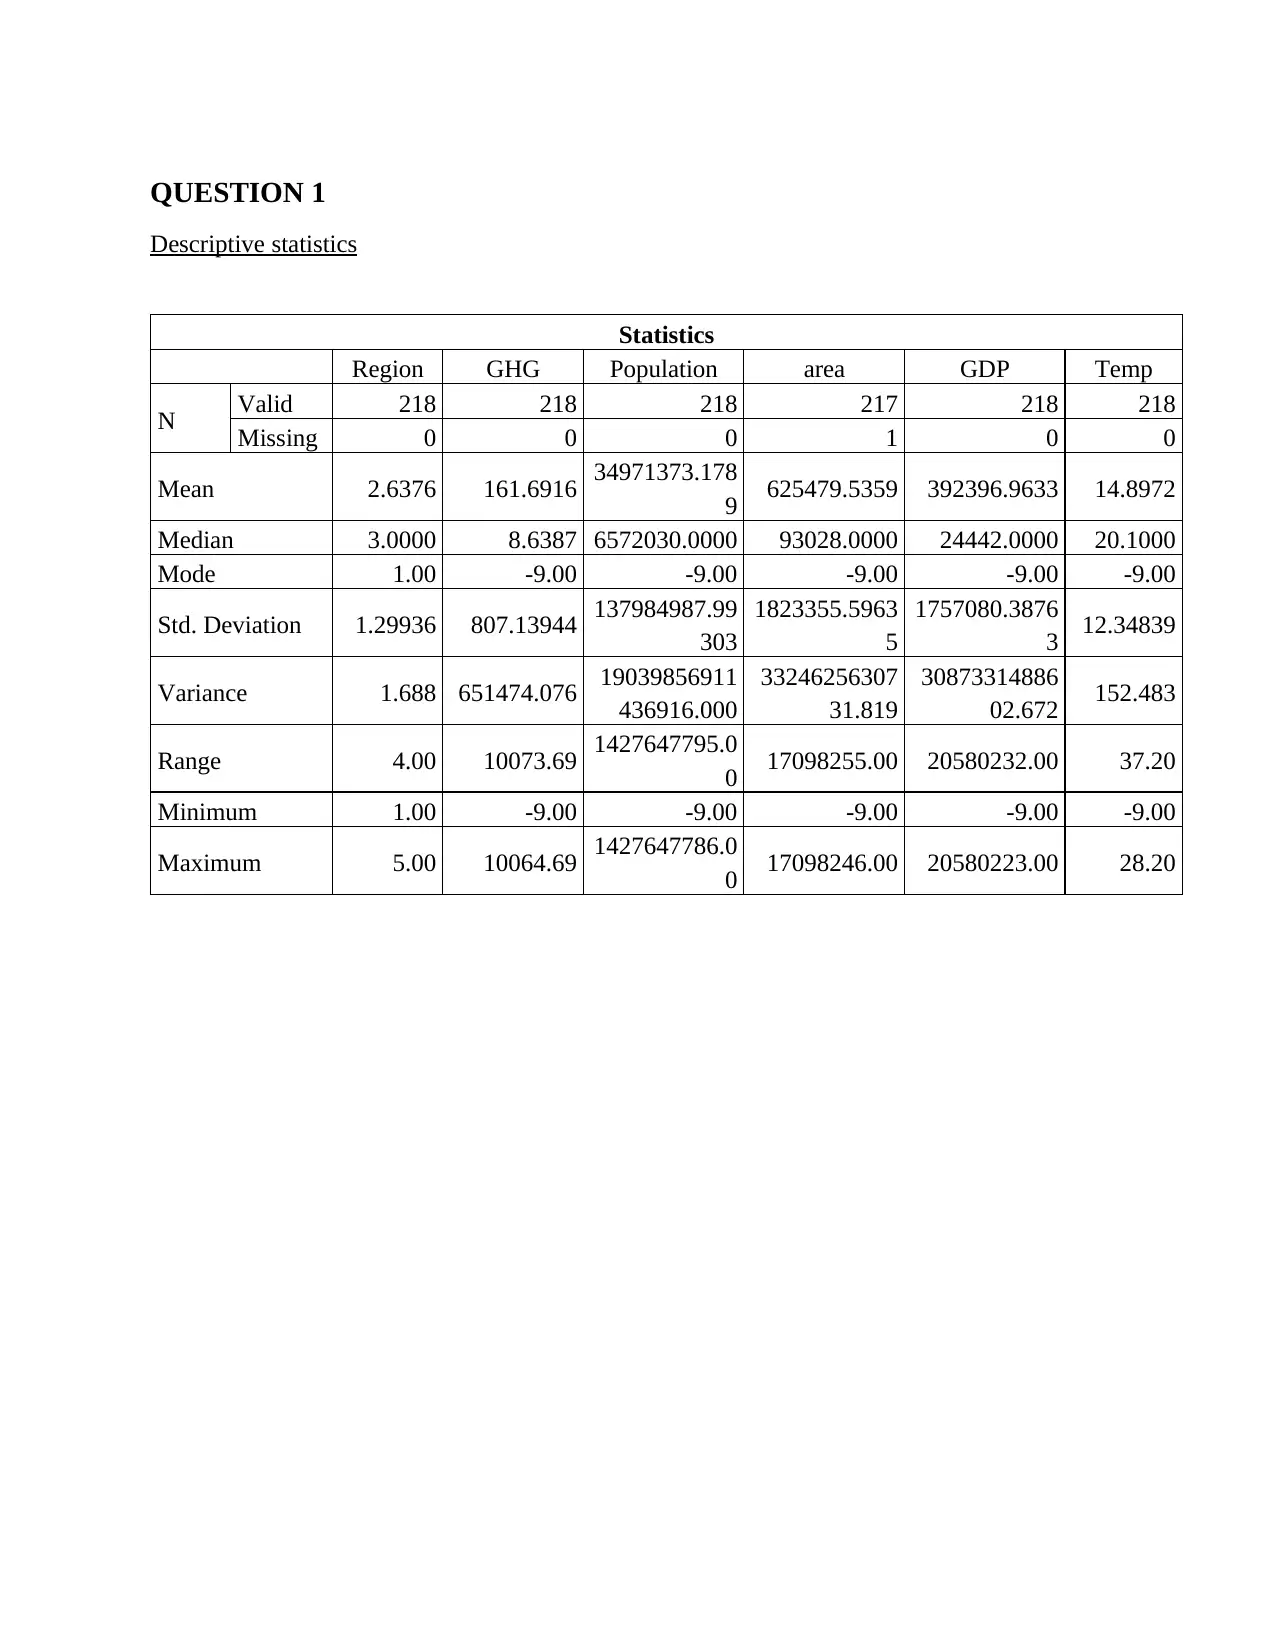
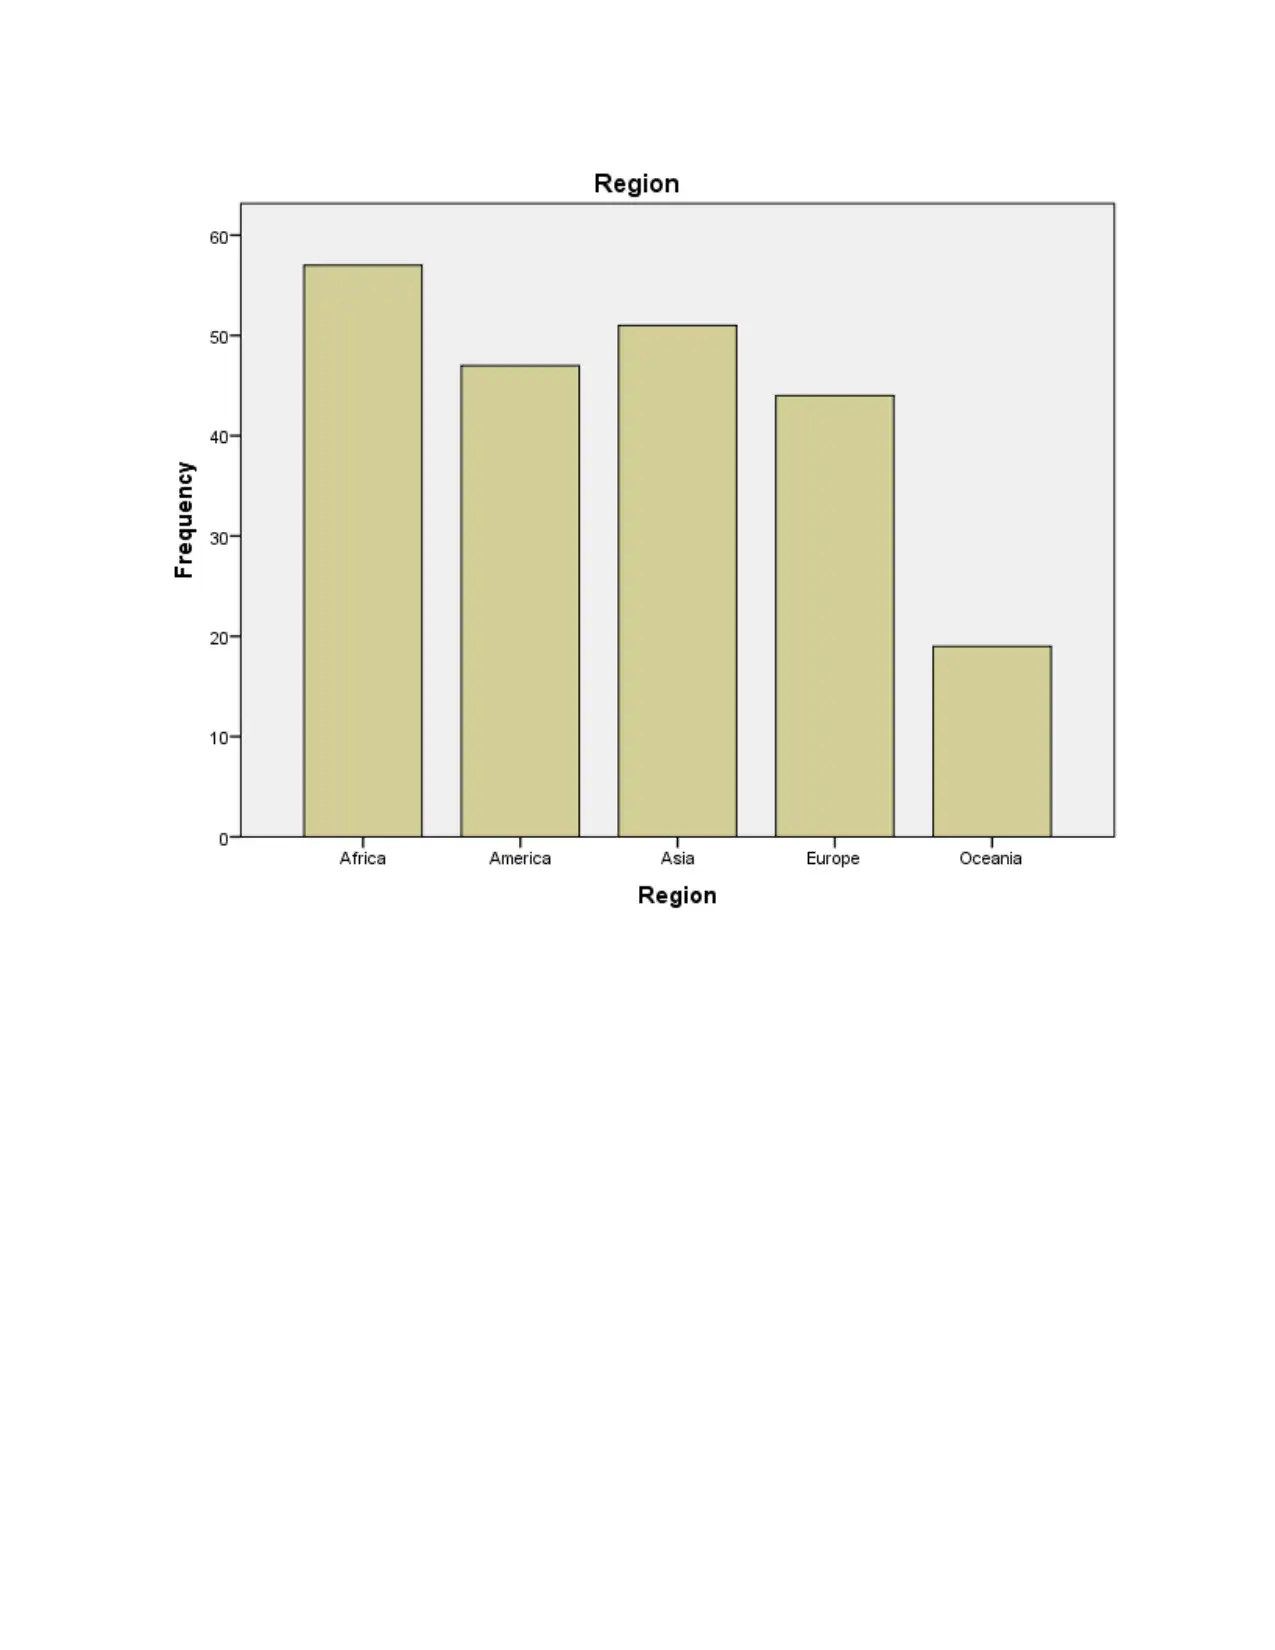
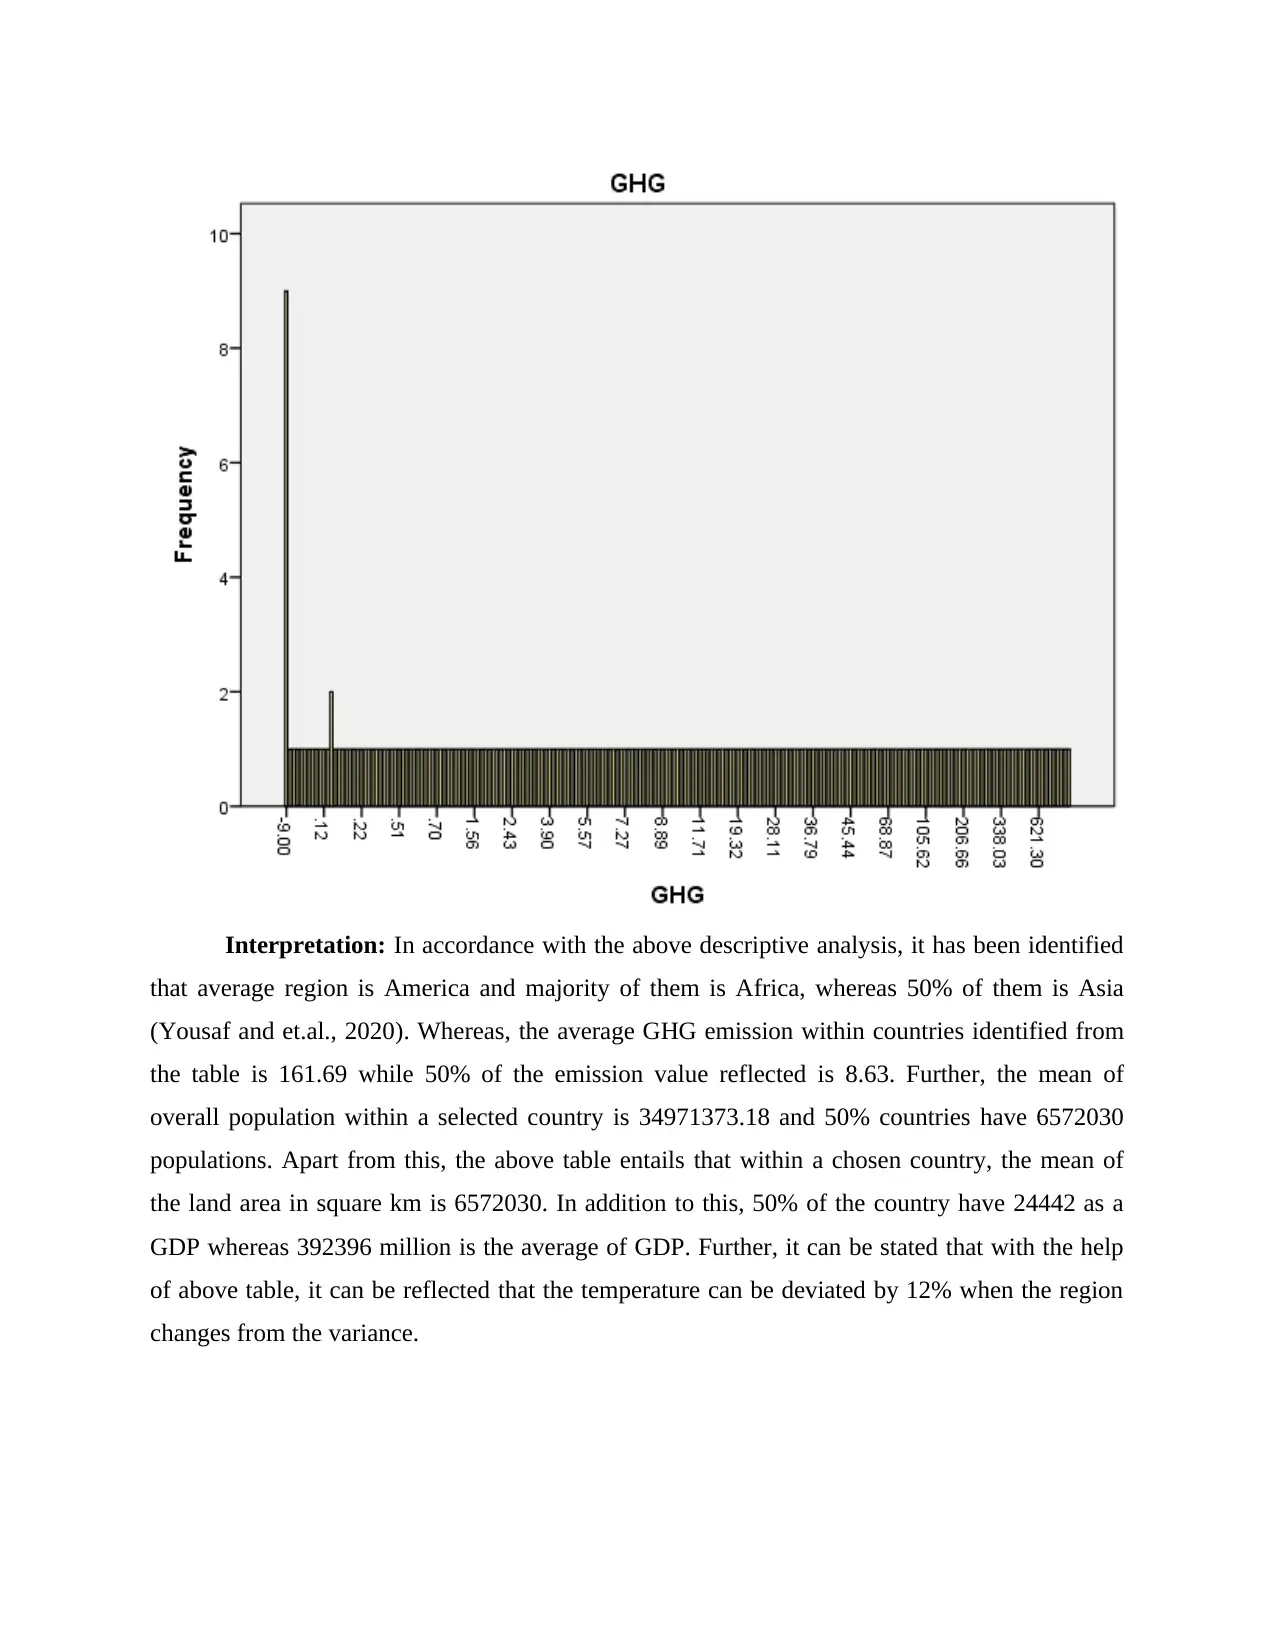
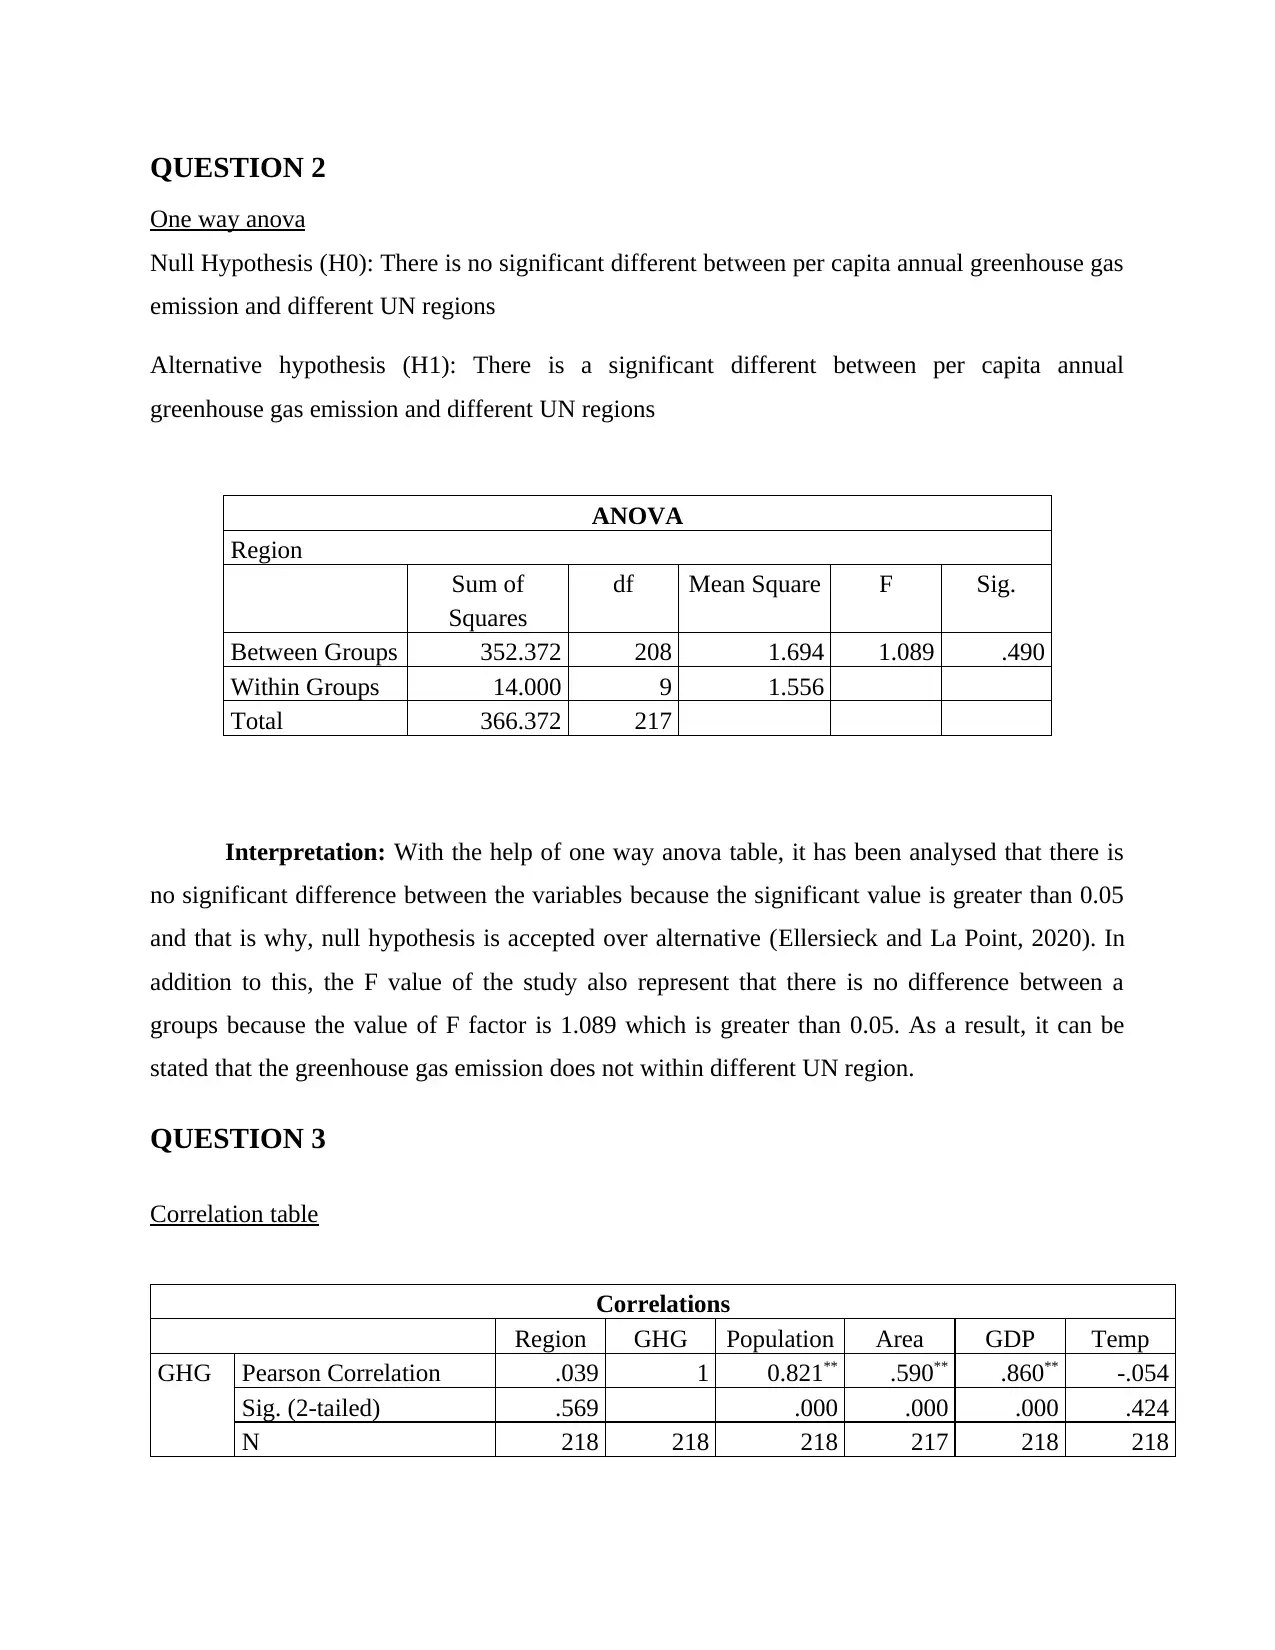
This assignment solution provides a comprehensive analysis of statistical data, focusing on greenhouse gas (GHG) emissions and their relationship with various factors such as region, population, GDP, and temperature. Descriptive statistics are used to summarize the data, revealing insights into the average GHG emissions, population sizes, GDP, and temperature variations across different regions. A one-way ANOVA test is conducted to determine if there is a significant difference in per capita annual greenhouse gas emissions between different UN regions, concluding that no significant difference exists. Furthermore, a correlation table explores the relationships between GHG emissions and other variables, indicating a strong positive correlation with population and GDP, and a weak negative correlation with temperature. The analysis highlights the multivariate associations, emphasizing the significant impact of population and GDP on GHG emissions. Desklib offers a variety of study resources, including past papers and solved assignments, to support students in their academic endeavors.
Document Page
Statistics- Summative Assessment 1
tabler-icon-diamond-filled.svg

Paraphrase This Document

Need a fresh take? Get an instant paraphrase of this document with our AI Paraphraser
Document Page
TABLE OF CONTENTS
QUESTION 1..................................................................................................................................3
Descriptive statistics....................................................................................................................3
QUESTION 2..................................................................................................................................6
One way anova............................................................................................................................6
QUESTION 3..................................................................................................................................6
Correlation table..........................................................................................................................6
REFERENCES................................................................................................................................8
Document Page
QUESTION 1
Descriptive statistics
Statistics
Region GHG Population area GDP Temp
N Valid 218 218 218 217 218 218
Missing 0 0 0 1 0 0
Mean 2.6376 161.6916 34971373.178
9 625479.5359 392396.9633 14.8972
Median 3.0000 8.6387 6572030.0000 93028.0000 24442.0000 20.1000
Mode 1.00 -9.00 -9.00 -9.00 -9.00 -9.00
Std. Deviation 1.29936 807.13944 137984987.99
303
1823355.5963
5
1757080.3876
3 12.34839
Variance 1.688 651474.076 19039856911
436916.000
33246256307
31.819
30873314886
02.672 152.483
Range 4.00 10073.69 1427647795.0
0 17098255.00 20580232.00 37.20
Minimum 1.00 -9.00 -9.00 -9.00 -9.00 -9.00
Maximum 5.00 10064.69 1427647786.0
0 17098246.00 20580223.00 28.20
Document Page
tabler-icon-diamond-filled.svg

Paraphrase This Document

Need a fresh take? Get an instant paraphrase of this document with our AI Paraphraser
Document Page
Interpretation: In accordance with the above descriptive analysis, it has been identified
that average region is America and majority of them is Africa, whereas 50% of them is Asia
(Yousaf and et.al., 2020). Whereas, the average GHG emission within countries identified from
the table is 161.69 while 50% of the emission value reflected is 8.63. Further, the mean of
overall population within a selected country is 34971373.18 and 50% countries have 6572030
populations. Apart from this, the above table entails that within a chosen country, the mean of
the land area in square km is 6572030. In addition to this, 50% of the country have 24442 as a
GDP whereas 392396 million is the average of GDP. Further, it can be stated that with the help
of above table, it can be reflected that the temperature can be deviated by 12% when the region
changes from the variance.
Document Page
QUESTION 2
One way anova
Null Hypothesis (H0): There is no significant different between per capita annual greenhouse gas
emission and different UN regions
Alternative hypothesis (H1): There is a significant different between per capita annual
greenhouse gas emission and different UN regions
ANOVA
Region
Sum of
Squares
df Mean Square F Sig.
Between Groups 352.372 208 1.694 1.089 .490
Within Groups 14.000 9 1.556
Total 366.372 217
Interpretation: With the help of one way anova table, it has been analysed that there is
no significant difference between the variables because the significant value is greater than 0.05
and that is why, null hypothesis is accepted over alternative (Ellersieck and La Point, 2020). In
addition to this, the F value of the study also represent that there is no difference between a
groups because the value of F factor is 1.089 which is greater than 0.05. As a result, it can be
stated that the greenhouse gas emission does not within different UN region.
QUESTION 3
Correlation table
Correlations
Region GHG Population Area GDP Temp
GHG Pearson Correlation .039 1 0.821** .590** .860** -.054
Sig. (2-tailed) .569 .000 .000 .000 .424
N 218 218 218 217 218 218
Document Page
** Correlation is significant at 0.01 level (2-tailed)
Interpretation: With the help of correlation table, it has been stated that the association between
per capita annual greenhouse gas emission has only 3% association with region. Further, the
relationship between GHG with population is also high because the table indicate that there is
82% relationship between the variables which reflected that when number of population
increases, the chances of GHG emission also increases. Further, the association between area and
GHG is moderate because there is 59% chances of fluctuation in GHG if area of a country
increases and decrease (Livadiotis, 2020). Also, there is a high relationship between GDP and
GHG because the value indicate from the table shows that there is 86% change identified within
a dependent variable. Thus, it can be stated that if there is any change in greenhouse gas
emission, then there is 86% change in the overall country’s GDP. Lastly, there is negative
correlation between temperature and GHG because the value reflected is -5% change over the
variable.
Overall, it can be reflected through the multivariate association that there is highly
association between GHG and Population, GDP. However, negative association with
temperature of countries with GHG.
tabler-icon-diamond-filled.svg

Paraphrase This Document

Need a fresh take? Get an instant paraphrase of this document with our AI Paraphraser
Document Page
REFERENCES
Books and Journals
Ellersieck, M. R. and La Point, T. W., 2020. Statistical analysis. In Fundamentals of Aquatic
Toxicology (pp. 307-343). CRC Press.
Livadiotis, G., 2020. Statistical analysis of the impact of environmental temperature on the
exponential growth rate of cases infected by COVID-19. PLoS one. 15(5). p.e0233875.
Yousaf, M. and et.al., 2020. Statistical analysis of forecasting COVID-19 for upcoming month in
Pakistan. Chaos, Solitons & Fractals. 138. p.109926.
chevron_up_icon
1 out of 8
circle_padding
hide_on_mobile
zoom_out_icon
[object Object]