Statistics Report: Data Analysis, Trend Lines, and Forecasting
VerifiedAdded on 2022/12/28
|9
|1346
|20
Report
AI Summary
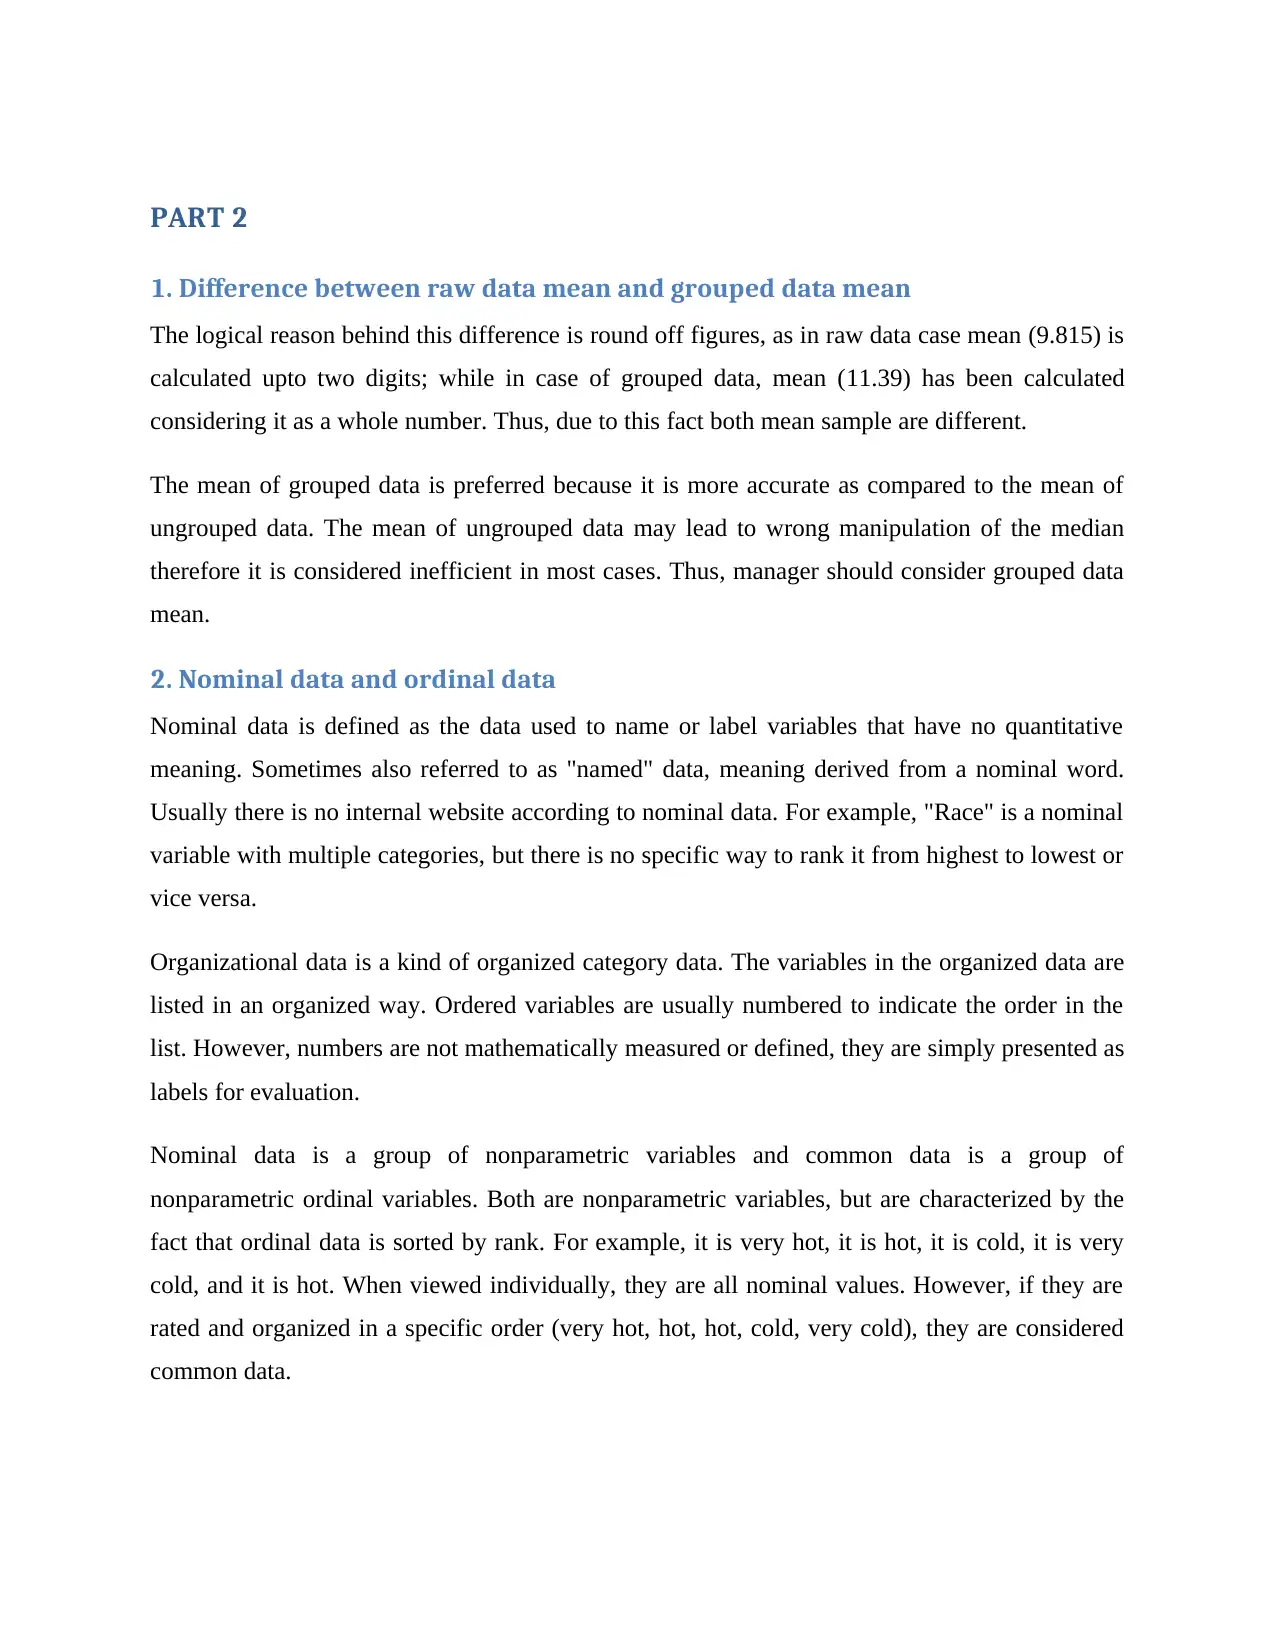
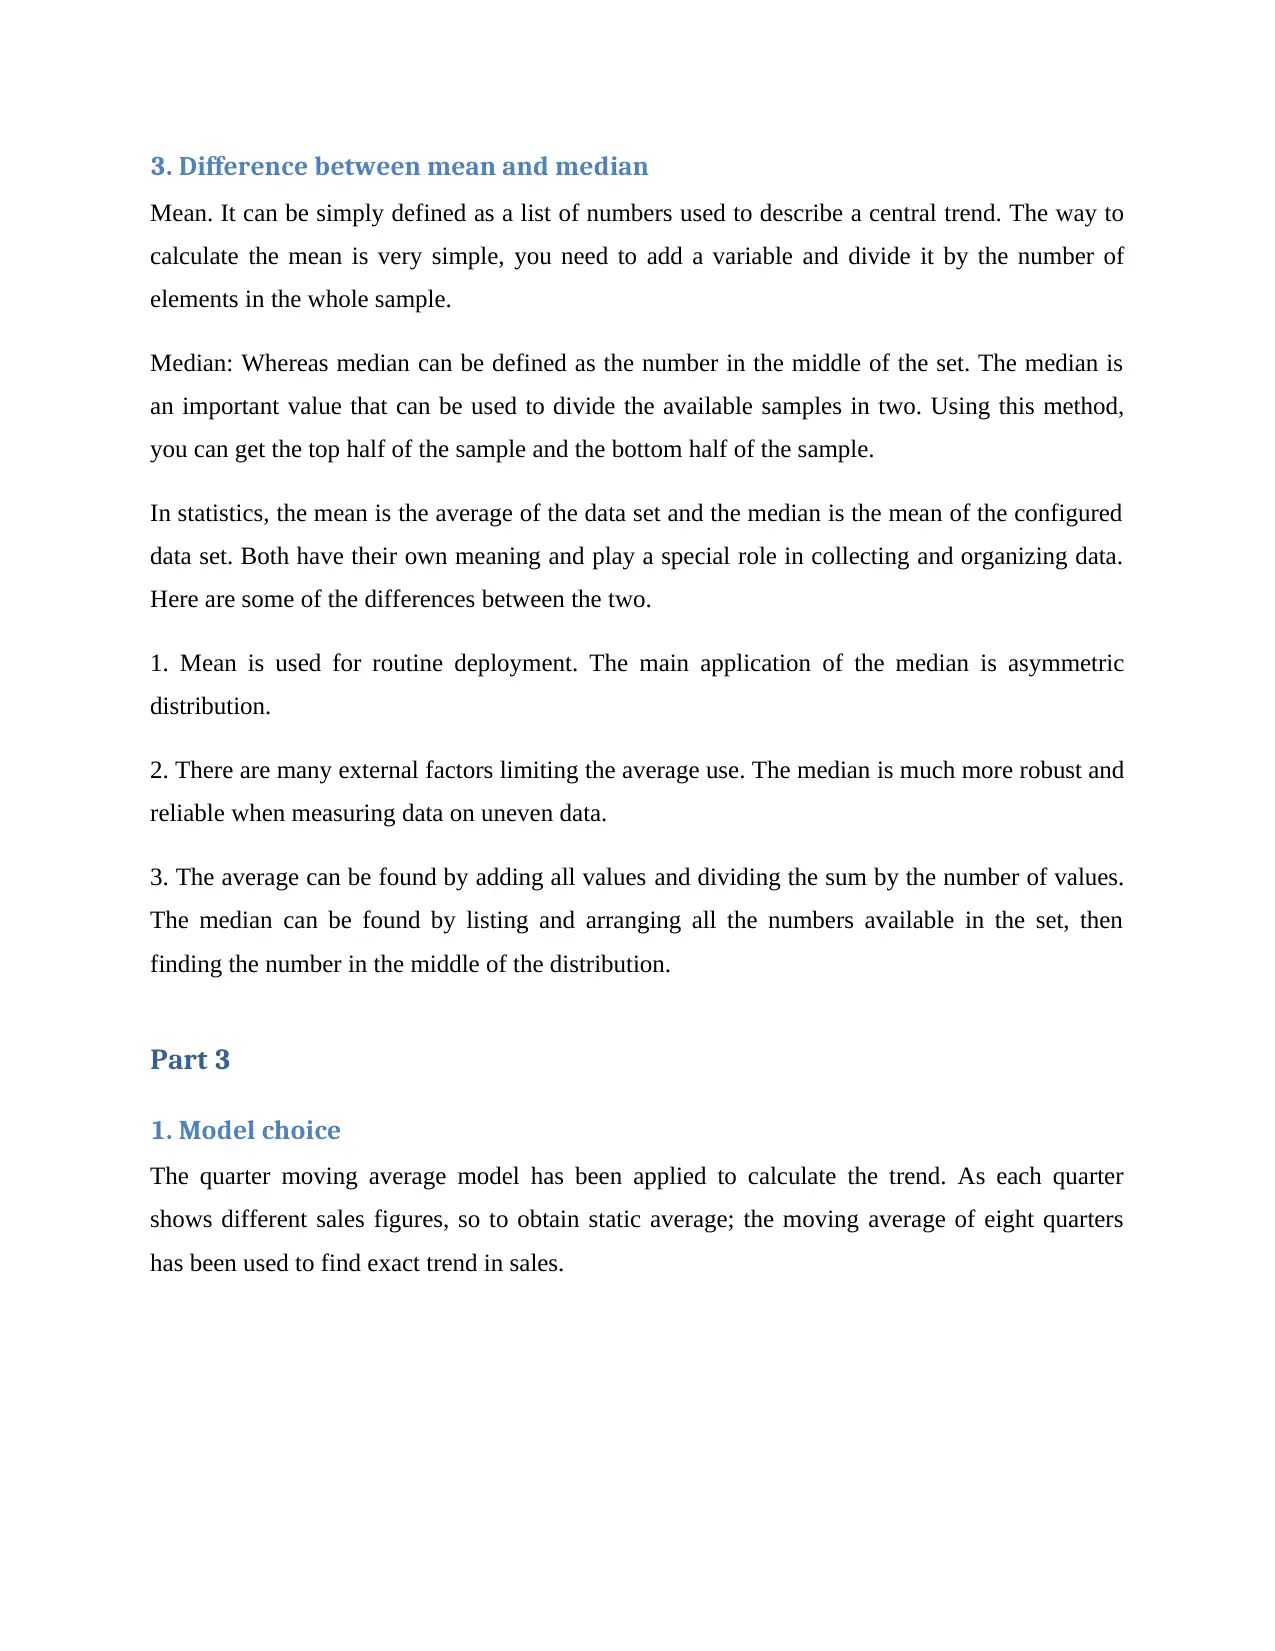
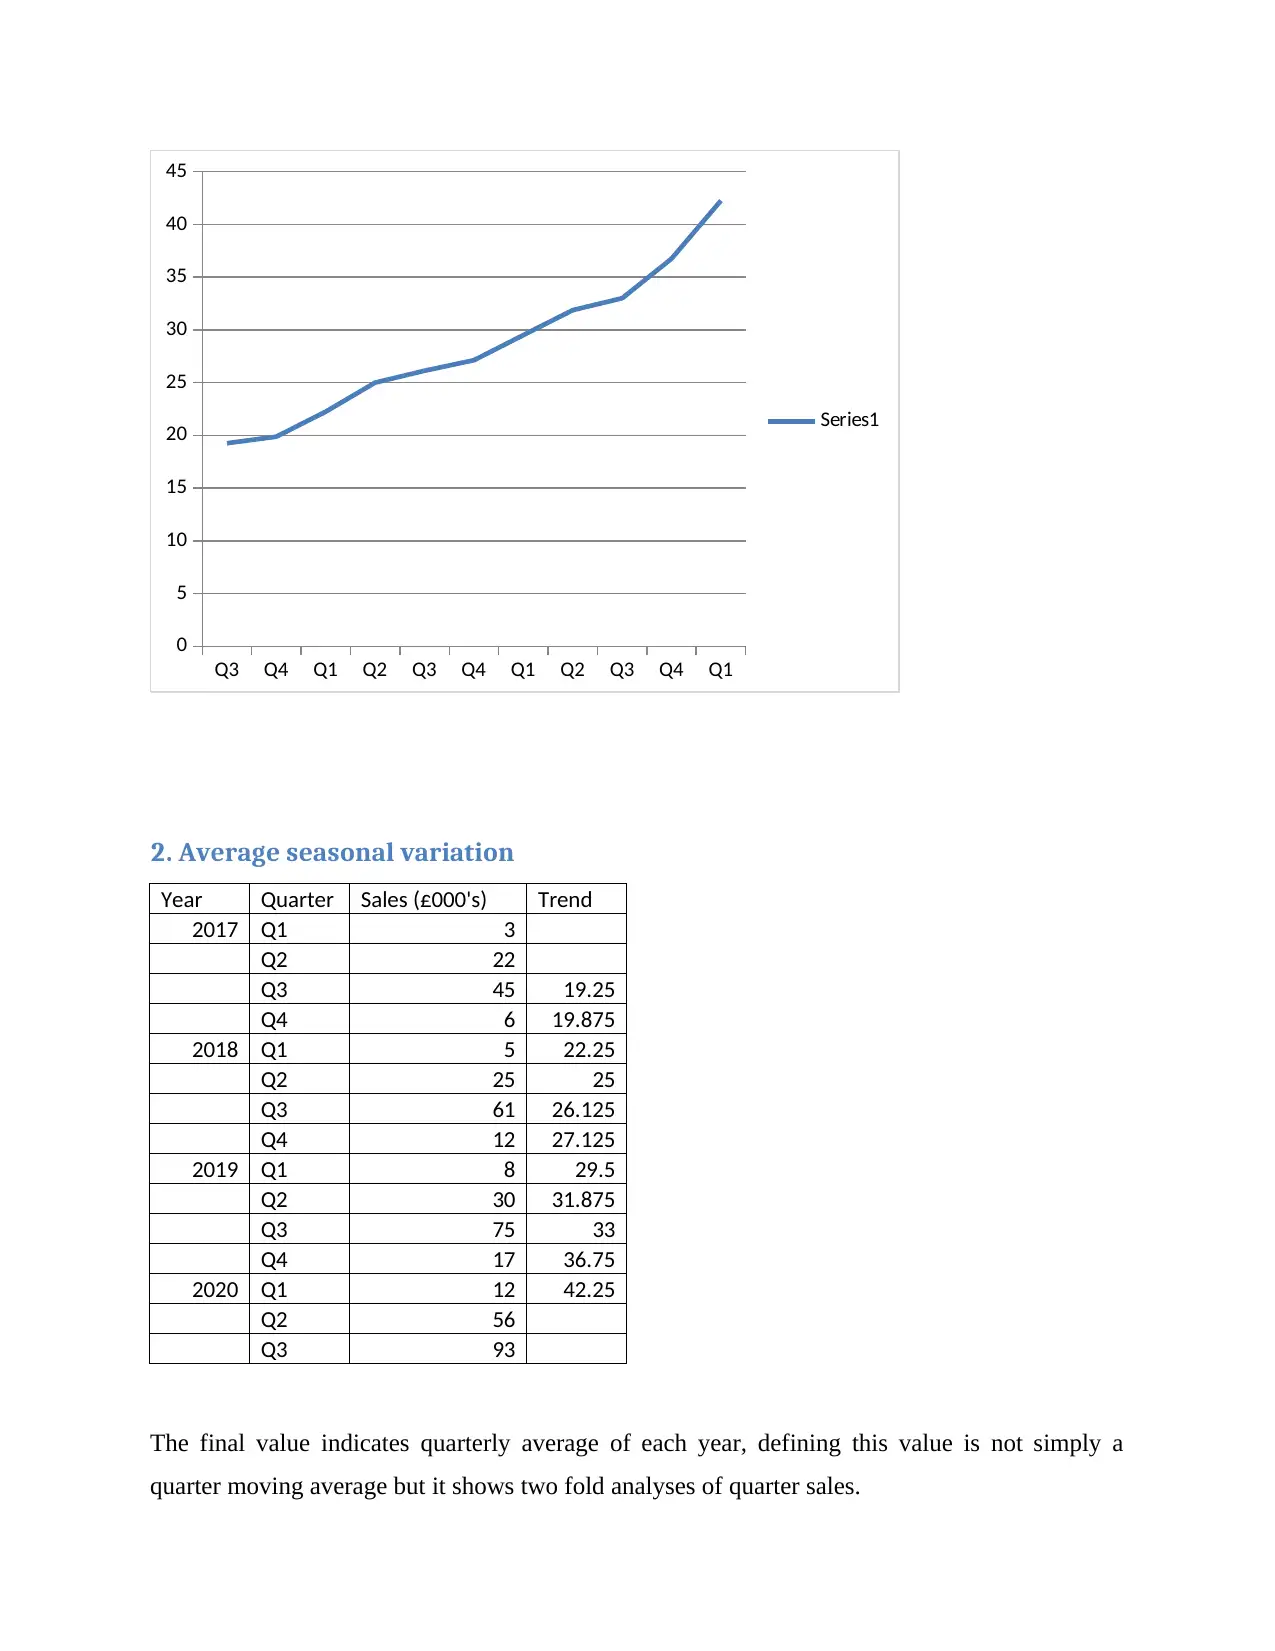
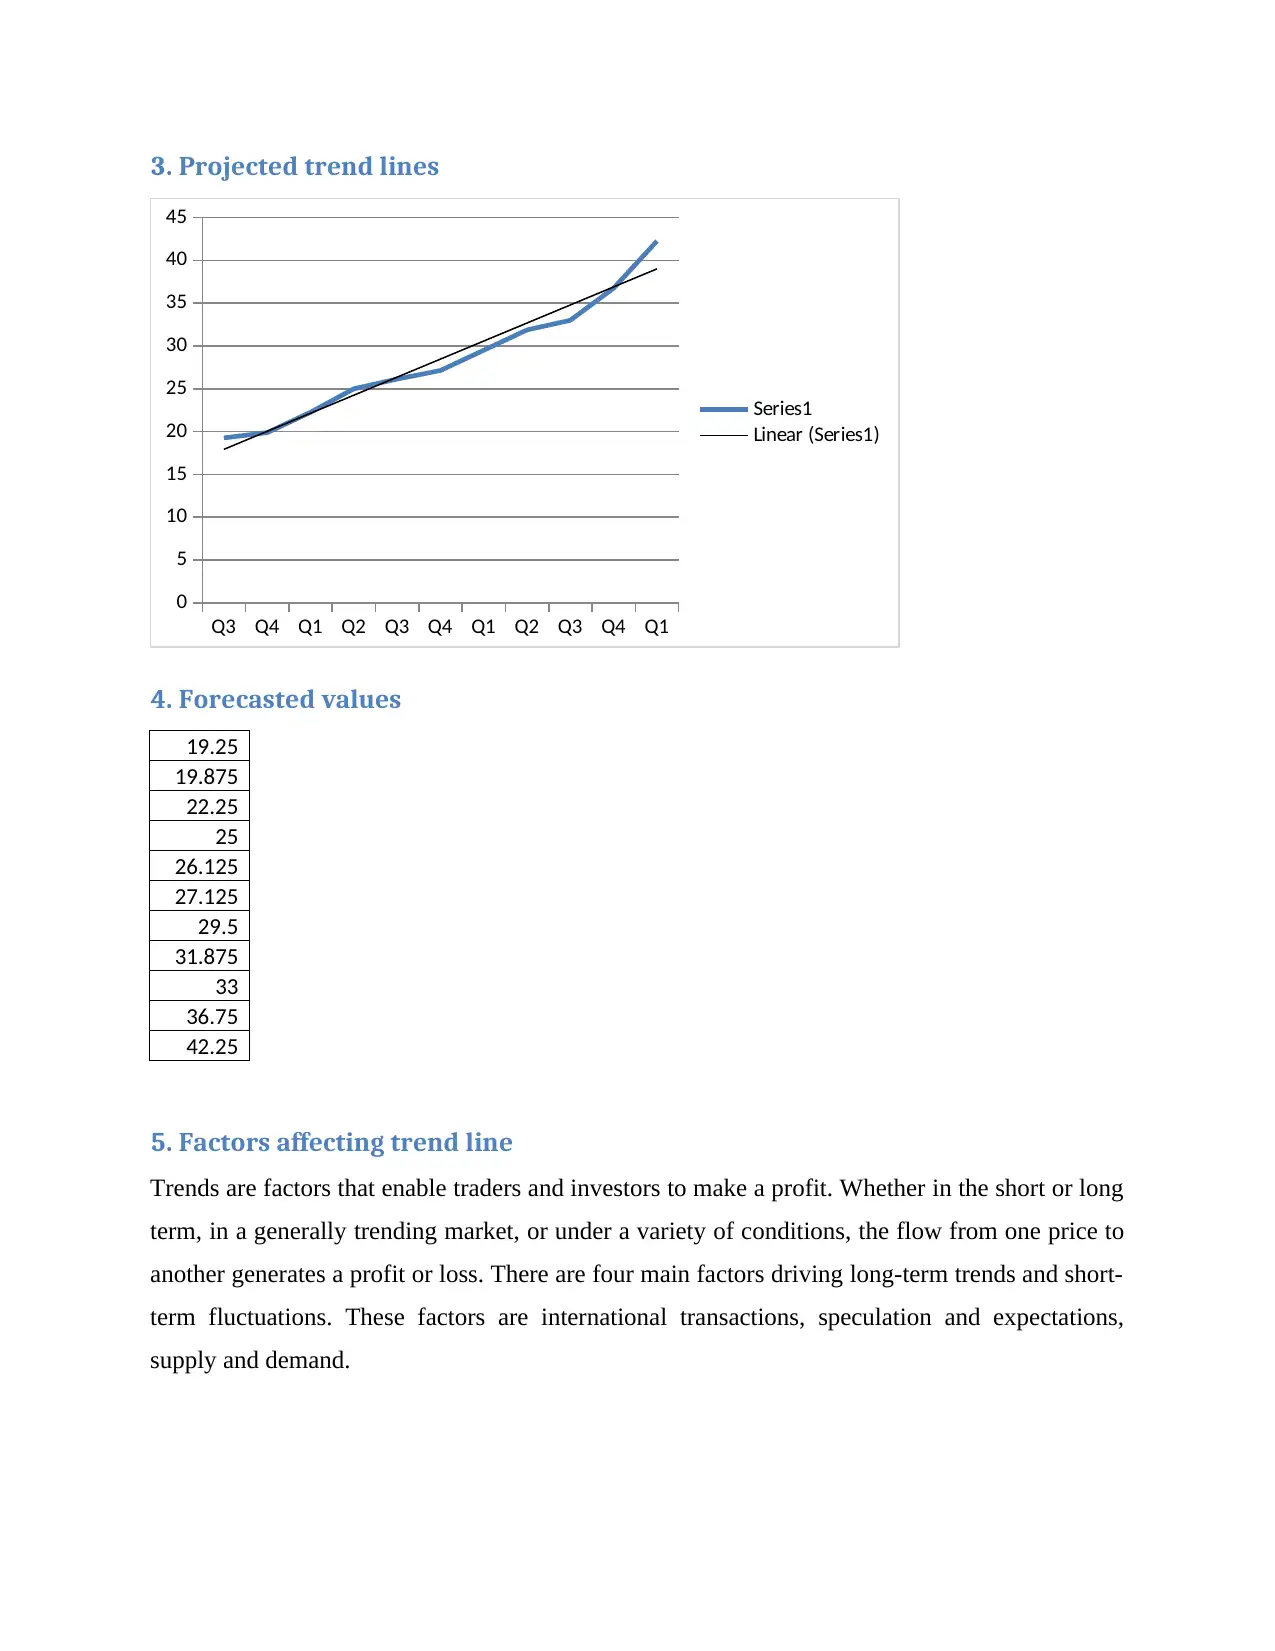
This report presents a comprehensive statistical analysis, beginning with a comparison of raw data and grouped data means, highlighting the impact of data organization on central tendency measures. It differentiates between nominal and ordinal data, emphasizing their distinct characteristics and applications. The report then contrasts the mean and median, elucidating their respective roles and appropriate uses in data analysis. Further, it delves into time series analysis, employing a quarter moving average model to identify trends in sales data. The analysis includes average seasonal variations, projected trend lines, and forecasted values. Finally, the report explores the factors influencing trend lines, such as international transactions, speculation, and supply and demand, providing a holistic understanding of the statistical concepts and their real-world implications.
1 out of 9
Related Documents


Your All-in-One AI-Powered Toolkit for Academic Success.
+13062052269
info@desklib.com
Available 24*7 on WhatsApp / Email
![[object Object]](/_next/static/media/star-bottom.7253800d.svg)
Copyright © 2020–2025 A2Z Services. All Rights Reserved. Developed and managed by ZUCOL.