Statistics Report: Analysis of Renovation Cost and Selling Prices Data

Verified

Added on  2020/10/05

|17
|1088
|172
Report
AI Summary
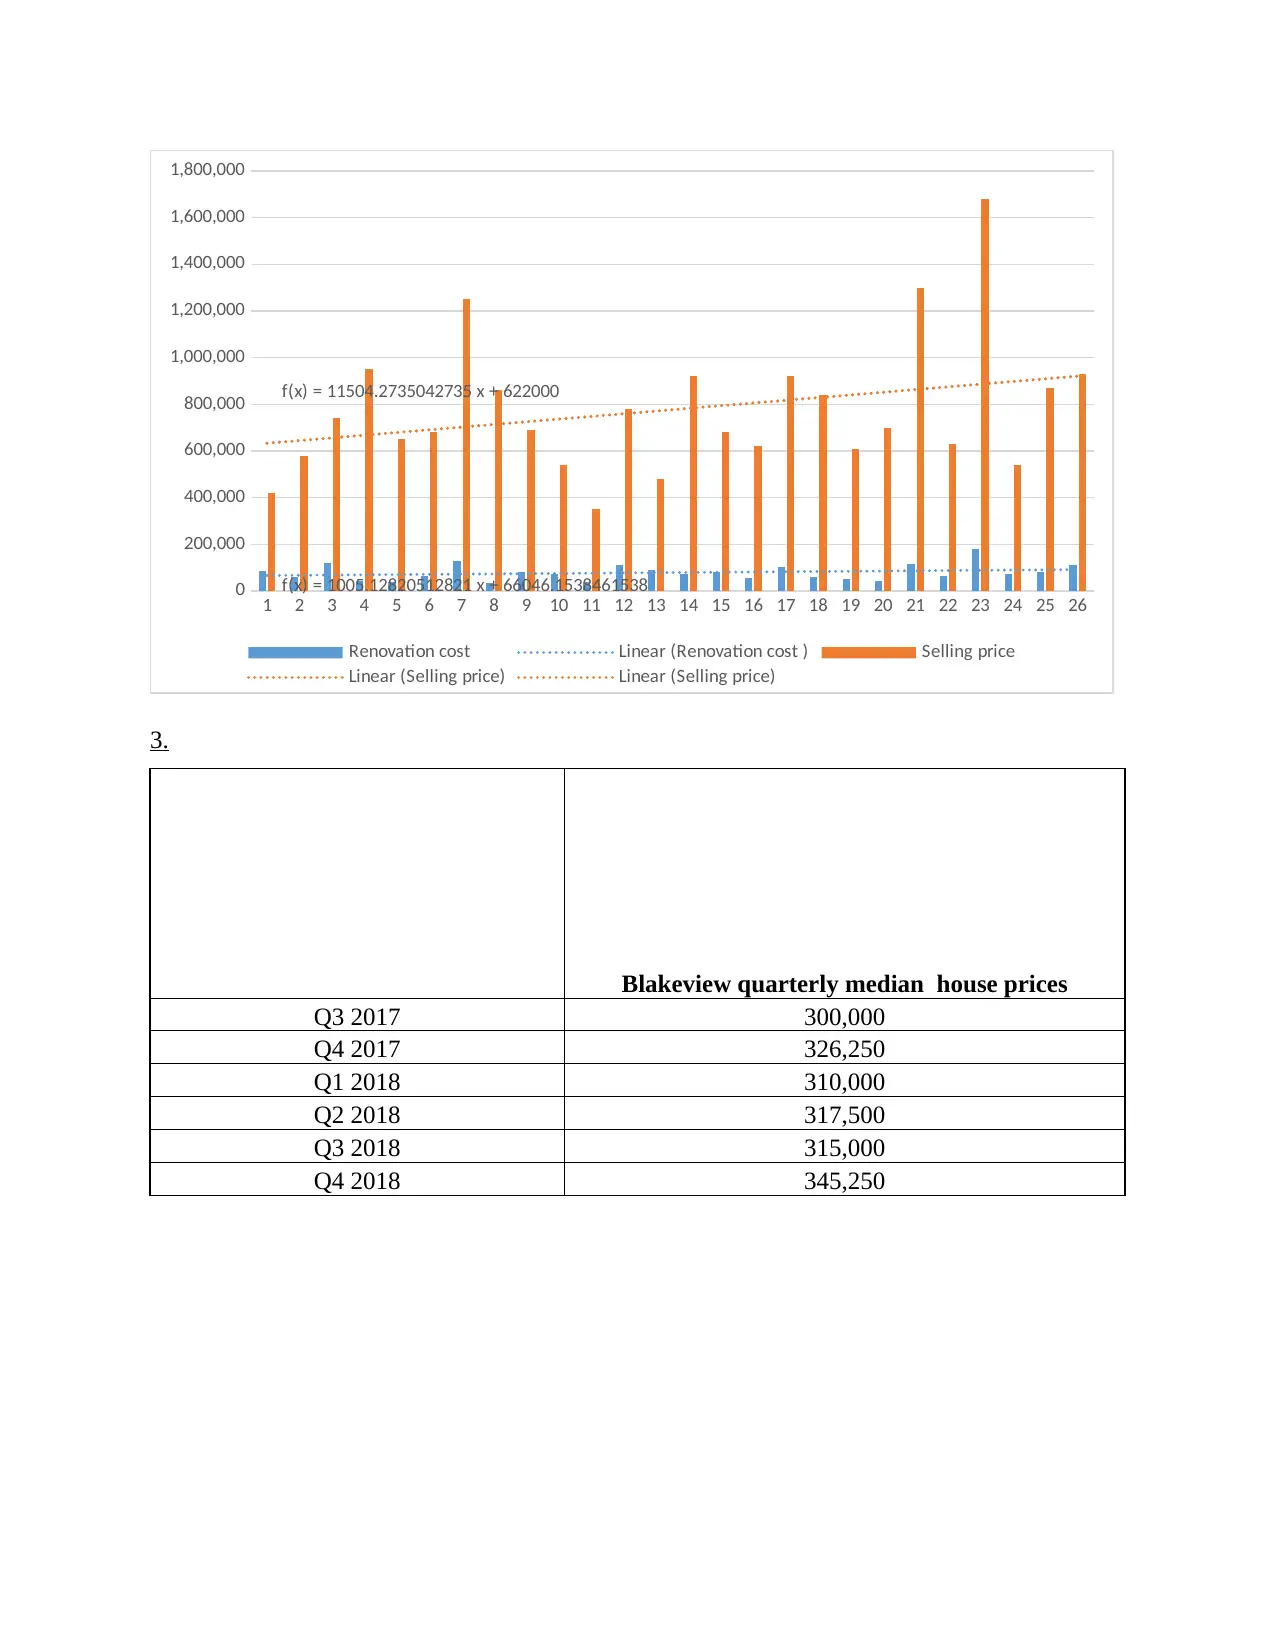
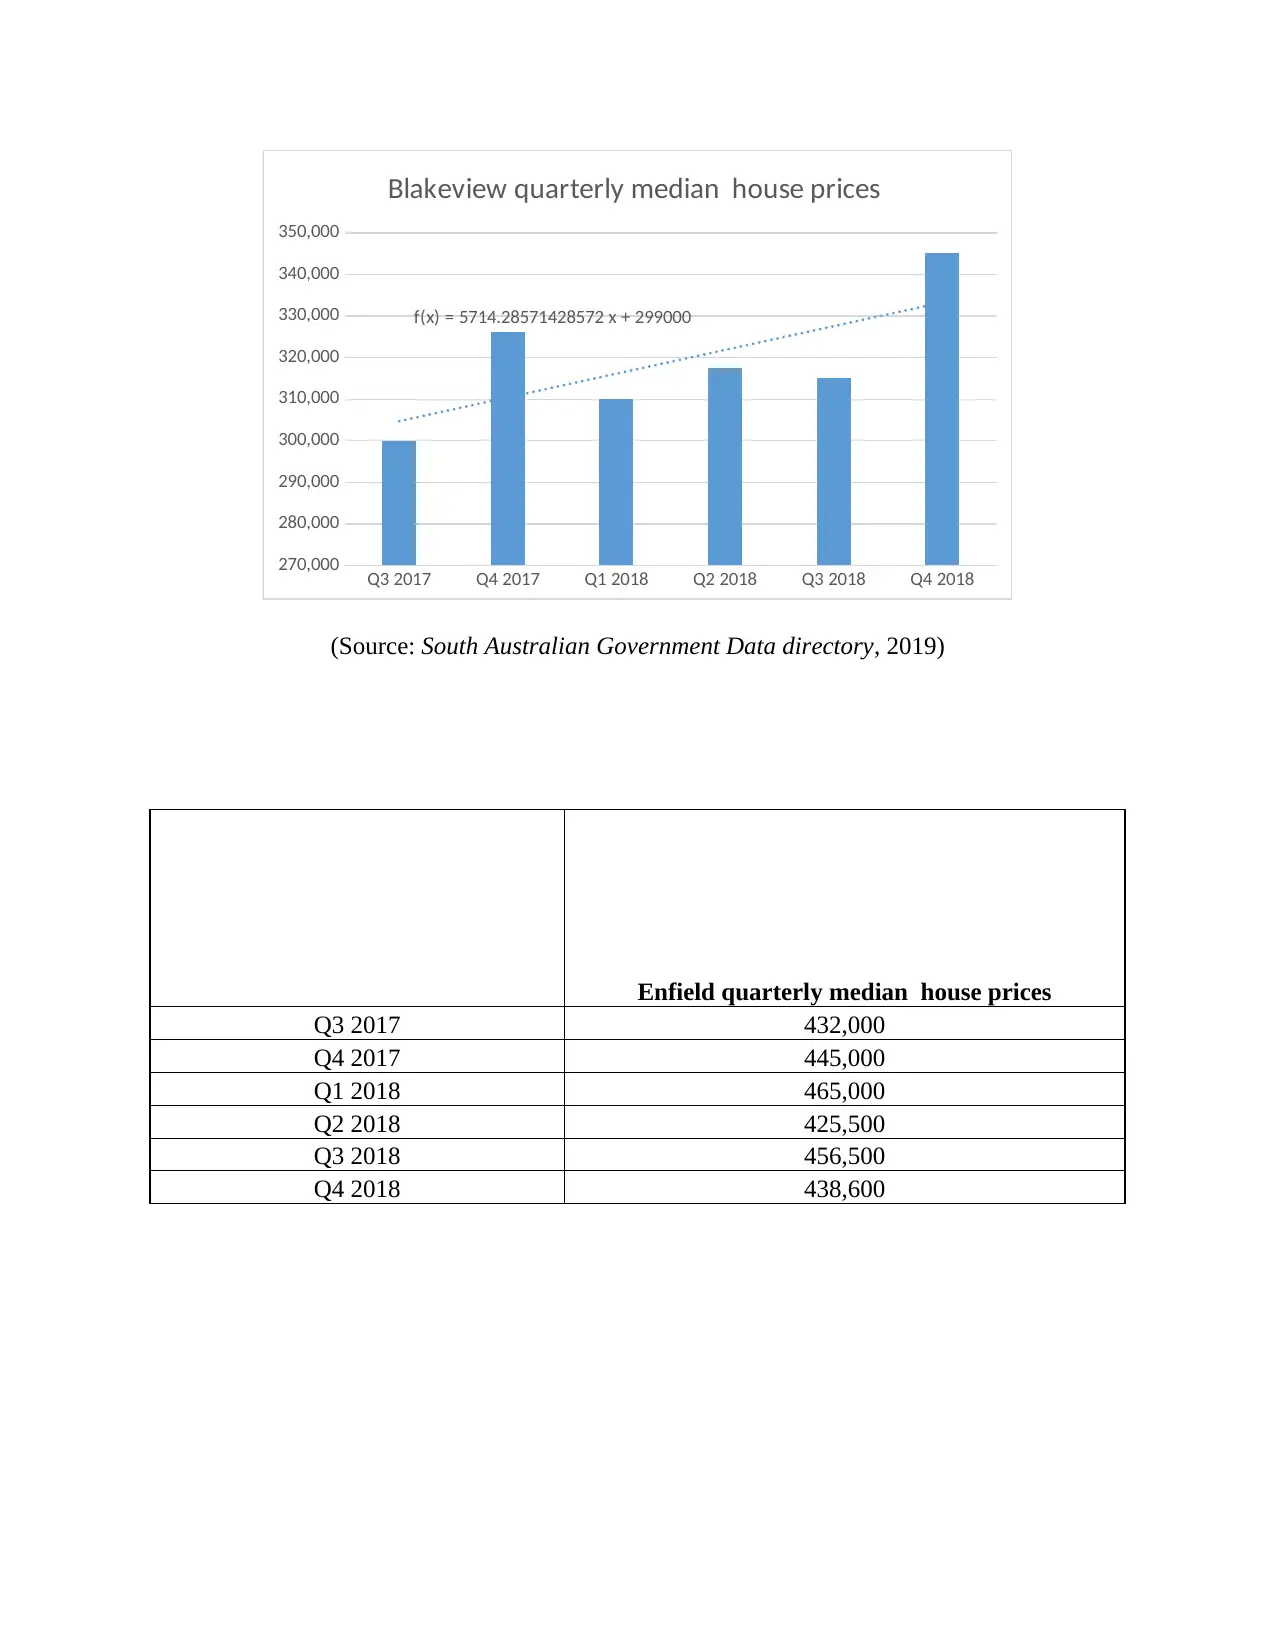
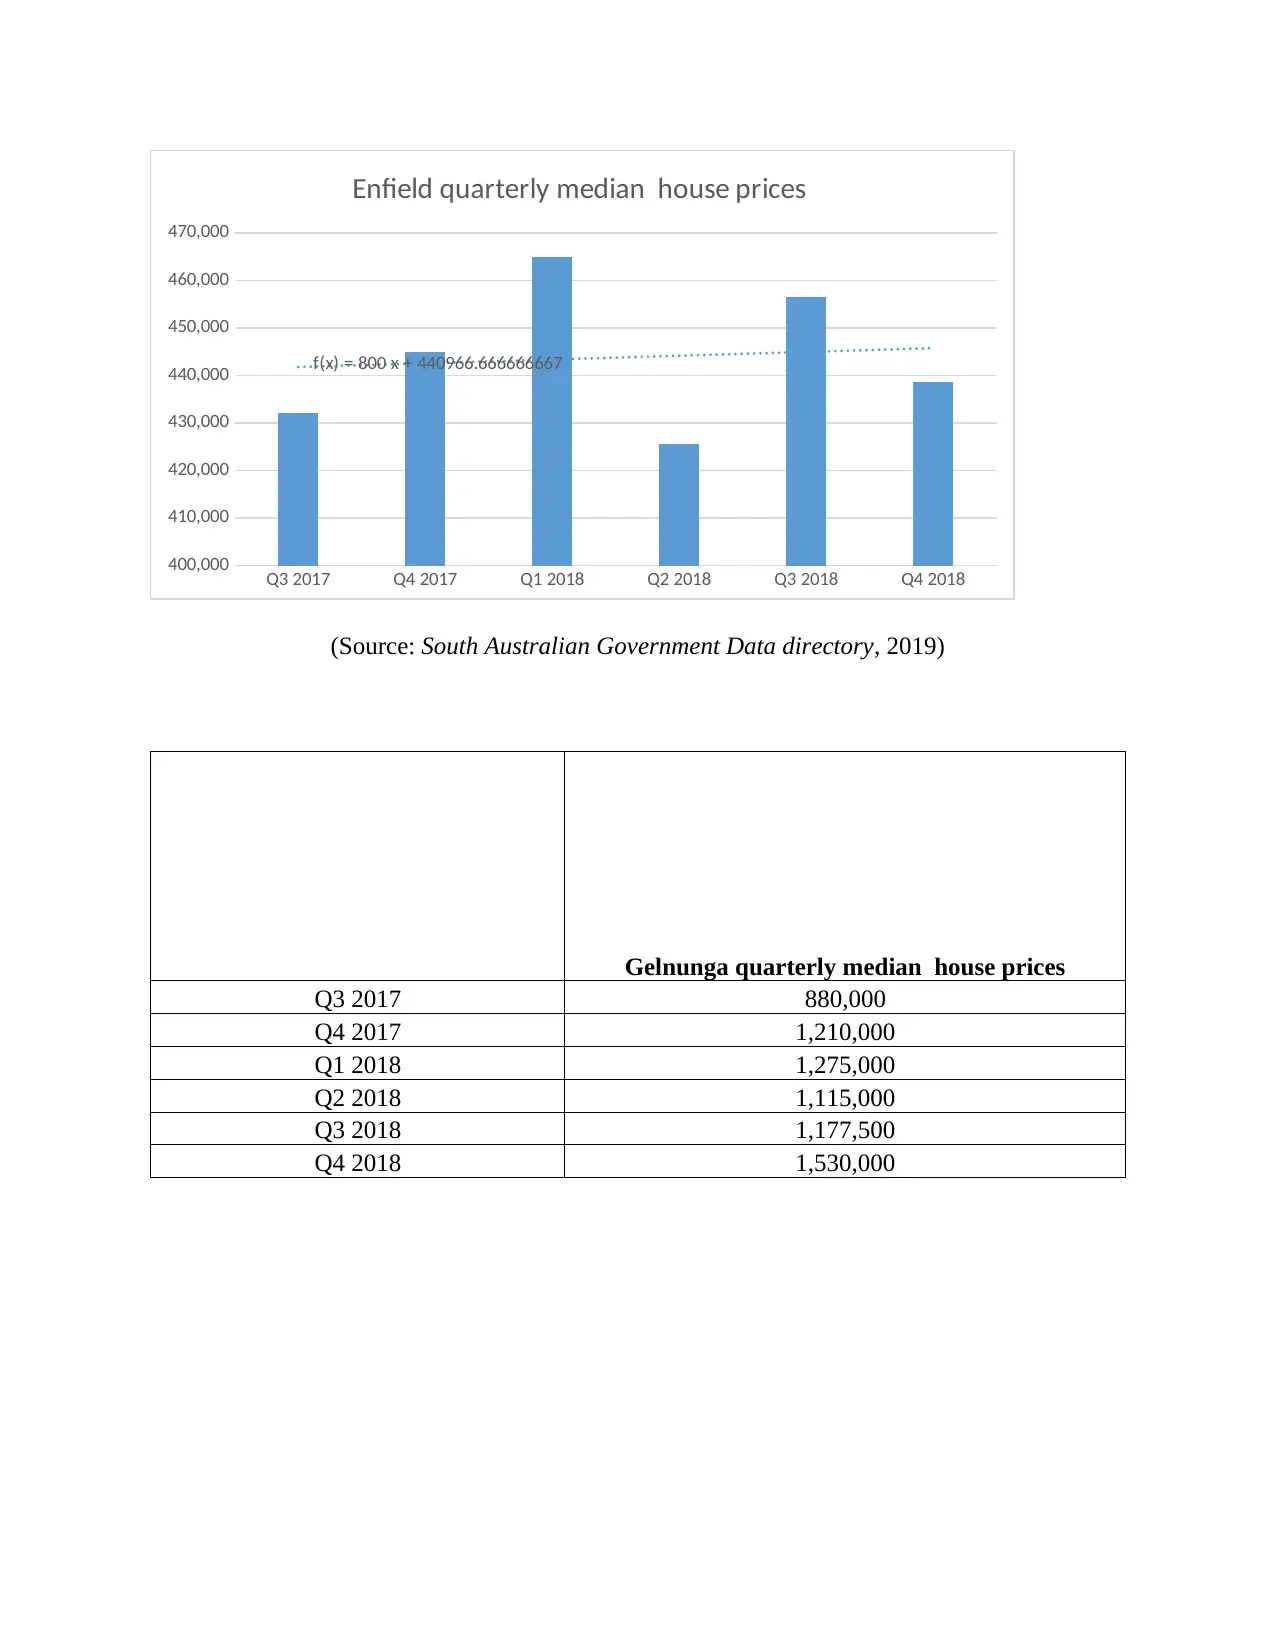
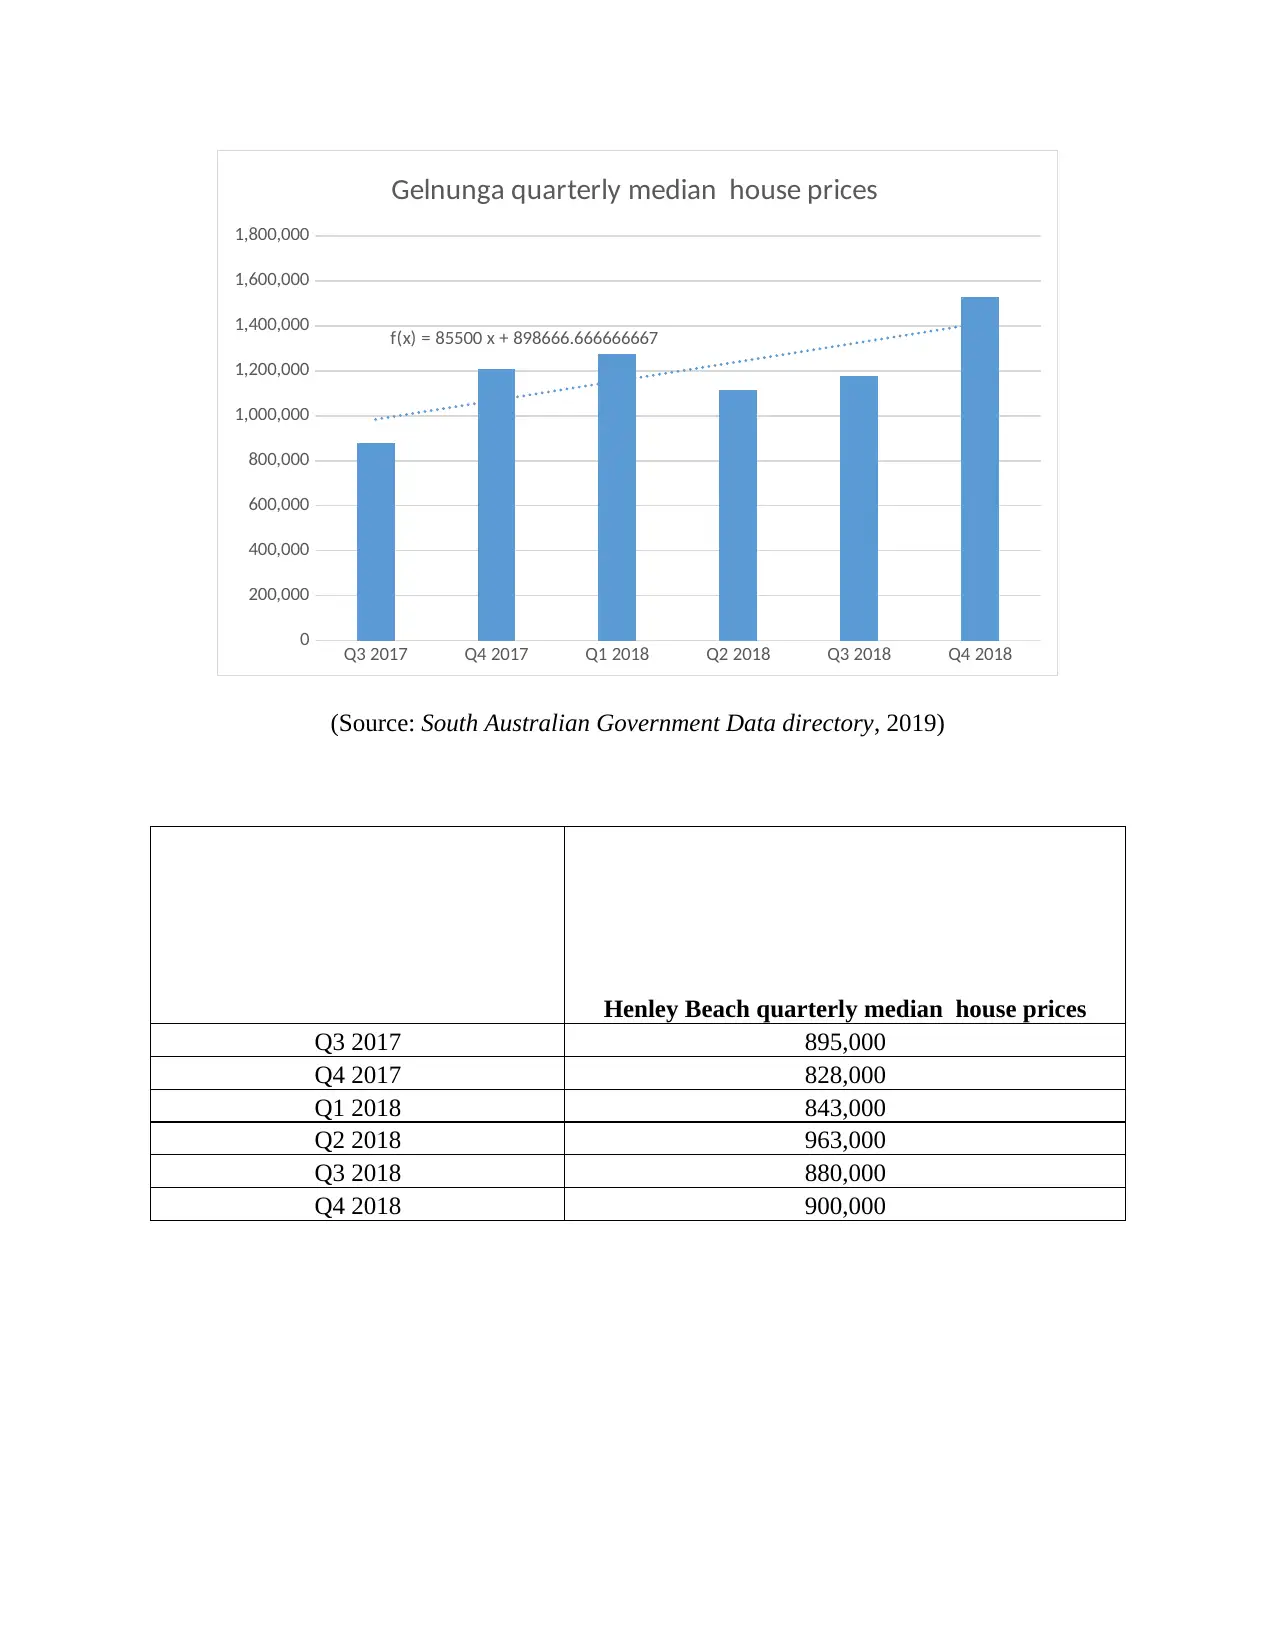
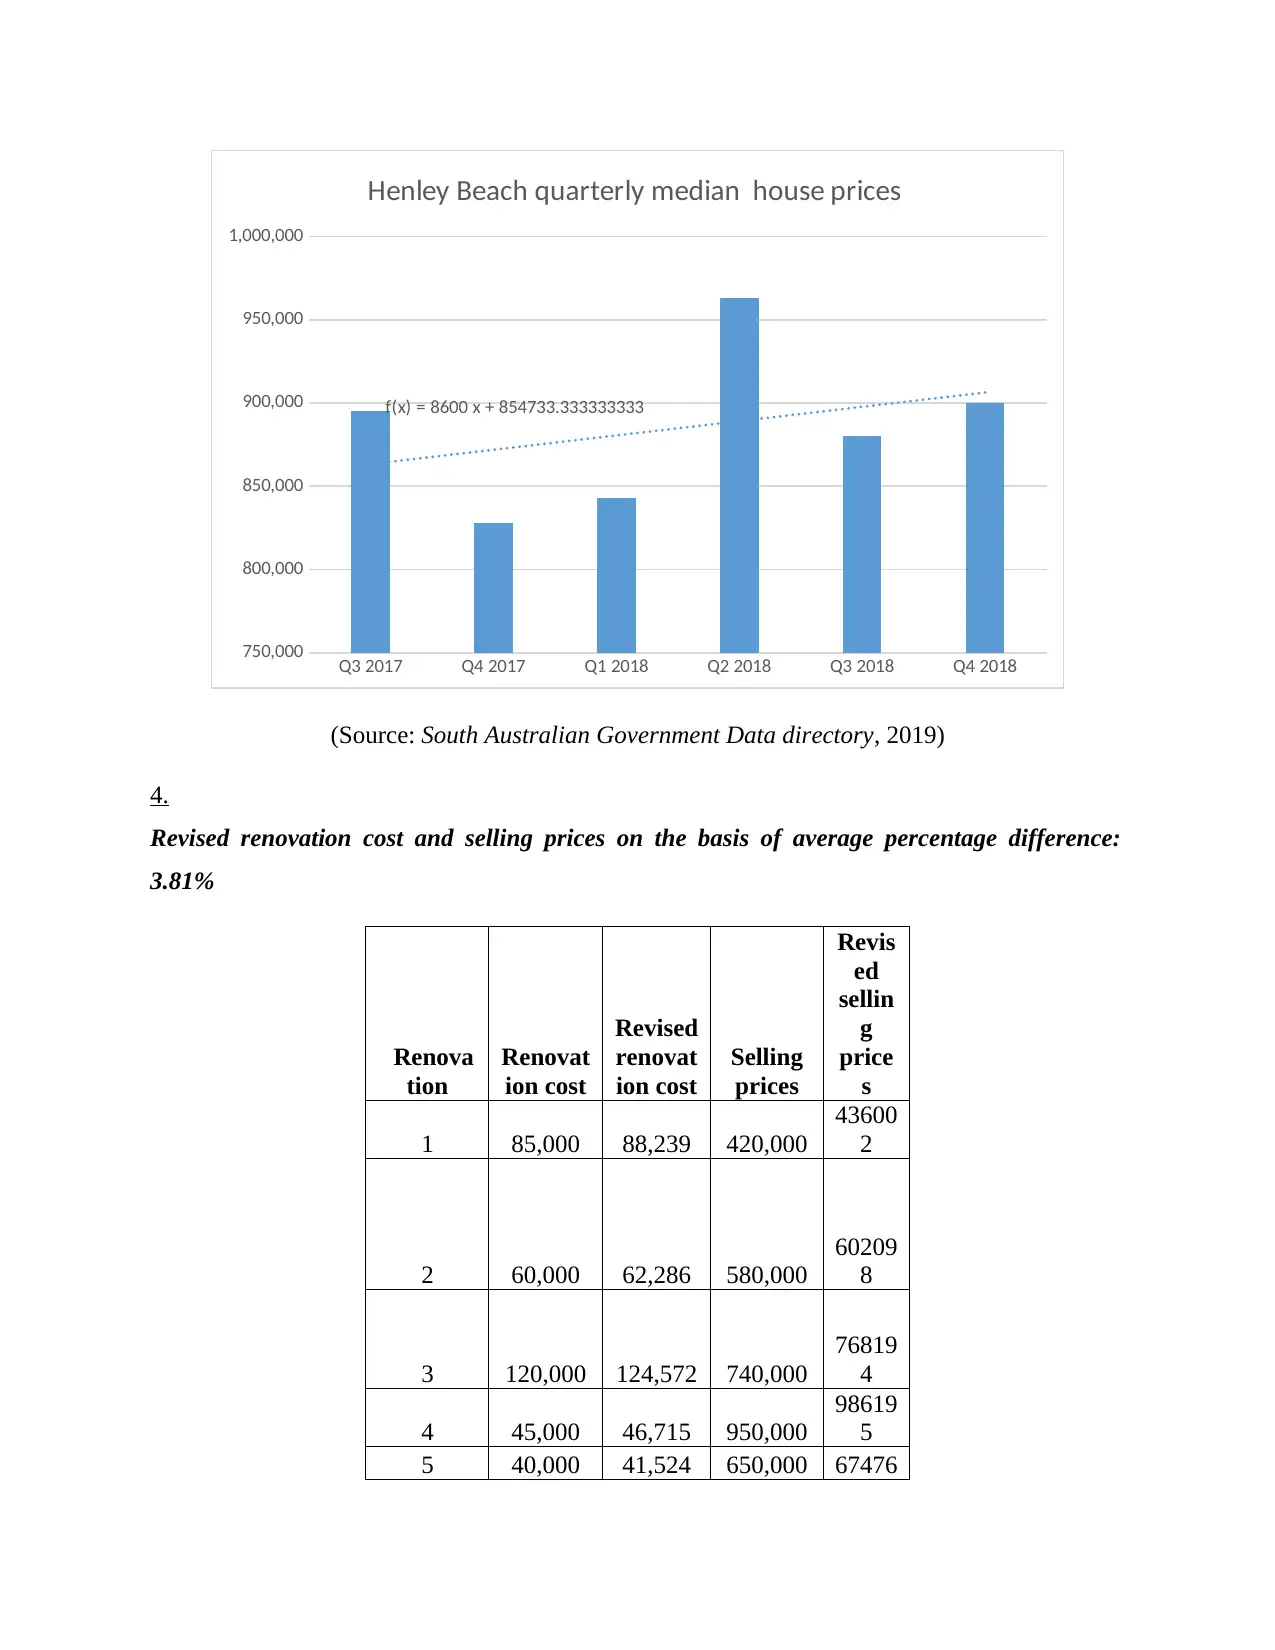
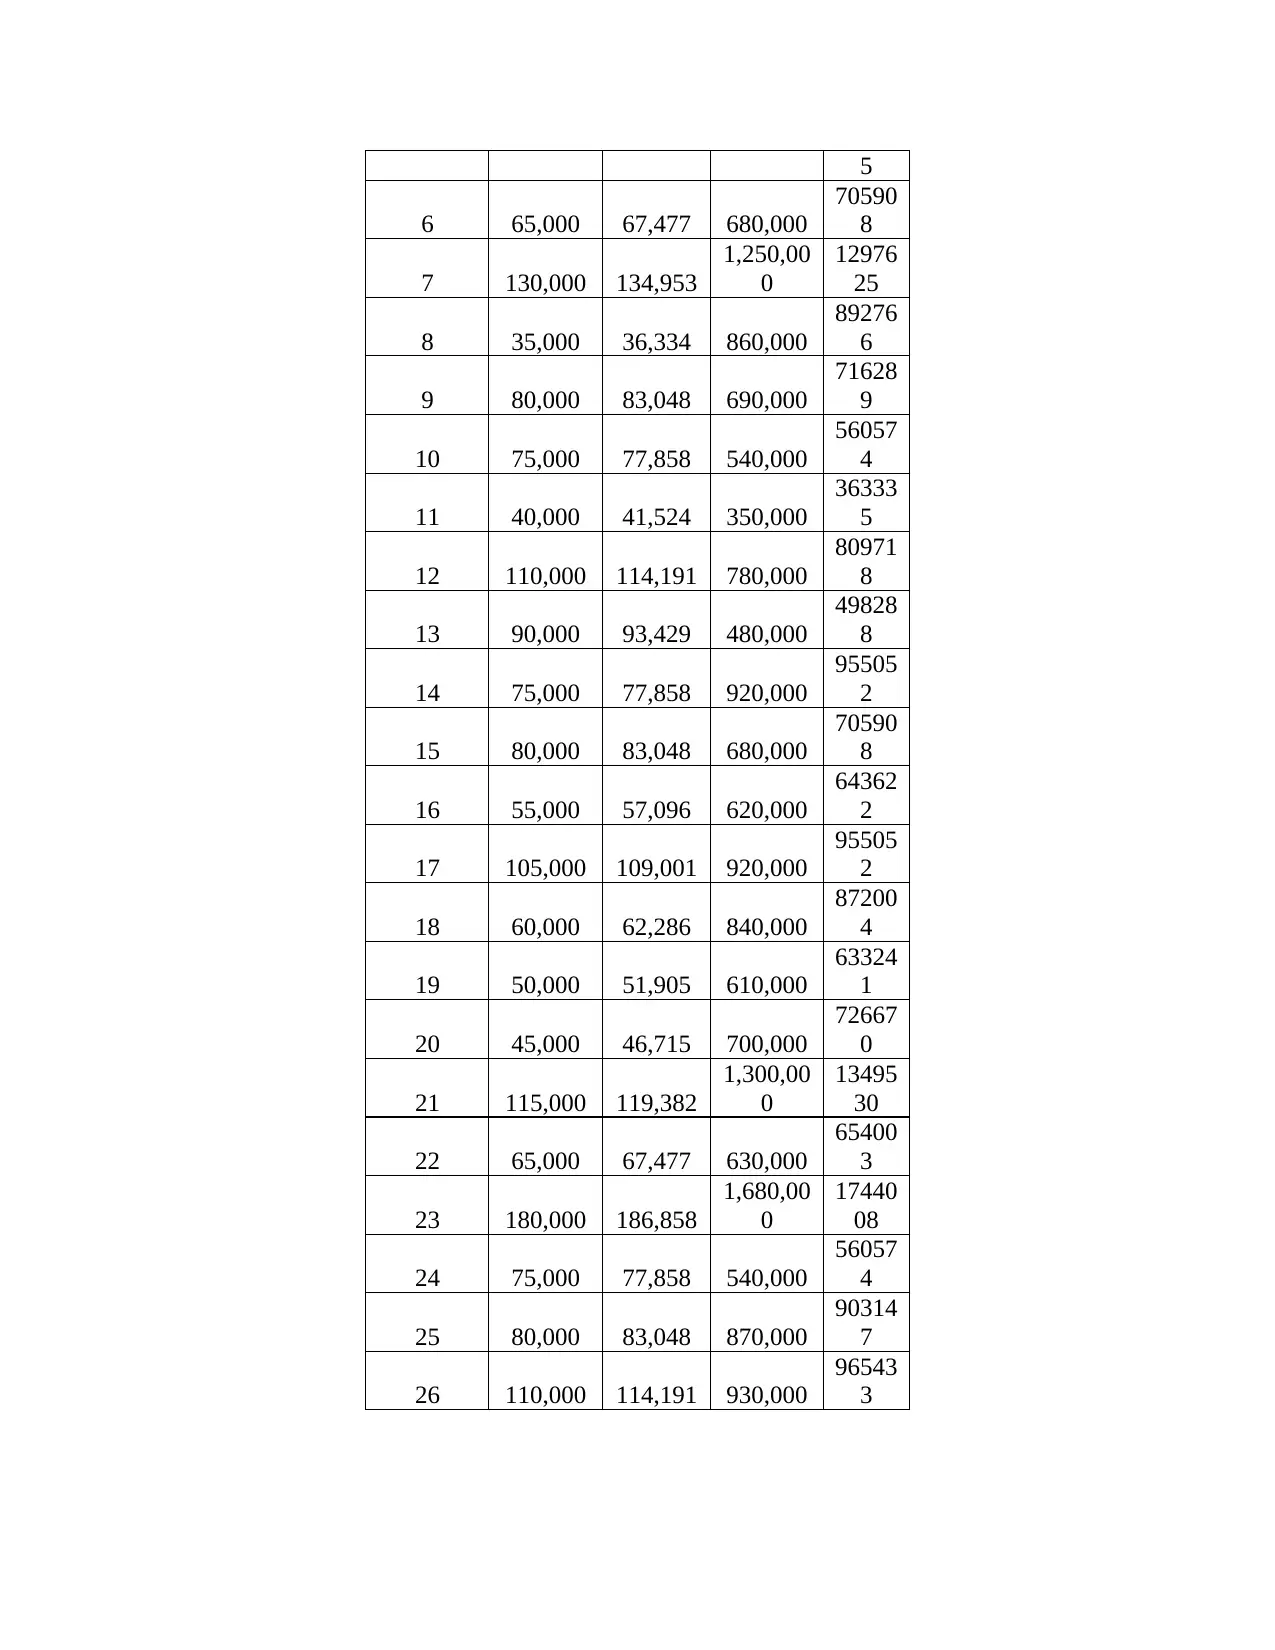
This report presents a statistical analysis of renovation costs and selling prices of houses. It includes a correlation analysis, hypothesis testing, and regression analysis to determine the relationship between renovation expenses and the eventual selling price. The report compares estimated and actual renovation costs and selling prices, calculates percentage differences, and revises figures based on these differences. The analysis incorporates data from various locations, including Blakeview, Enfield, Gelnunga, and Henley Beach, examining quarterly median house prices. The findings suggest that houses in Henley Beach may offer better investment potential. The report provides a comprehensive overview of the data sources, sampling techniques used, and graphical presentations, culminating in recommendations based on the statistical results. The data analysis aims to provide insights for a building company to make informed decisions about property renovation and purchasing, and the report concludes with an assessment of mean renovation costs and selling prices based on different methodologies, supporting the final conclusions.
Document Page
Statistics
tabler-icon-diamond-filled.svg

Paraphrase This Document

Need a fresh take? Get an instant paraphrase of this document with our AI Paraphraser
Document Page
TABLE OF CONTENTS
ASSESSMENT................................................................................................................................3
2...................................................................................................................................................3
a....................................................................................................................................................3
b...................................................................................................................................................3
c....................................................................................................................................................5
d...................................................................................................................................................5
3...................................................................................................................................................6
4.................................................................................................................................................10
Estimations for renovation cost and selling prices on the basis of regression equation............11
5.................................................................................................................................................12
6.................................................................................................................................................13
TASK 2..........................................................................................................................................13
Summary of relevant data set....................................................................................................13
Details of data source.................................................................................................................13
Sampling technique used for obtaining data set........................................................................13
Graphical presentation...............................................................................................................13
Analysis.....................................................................................................................................15
Principles of statistical standards...............................................................................................15
Results........................................................................................................................................15
Recommendations......................................................................................................................15
Document Page
Document Page
ASSESSMENT
2.
a.
Computation of correlation
Particulars Figures
Correlation between renovation cost and
selling prices of estimates
.68
Correlation between renovation cost and
selling prices of estimates
.71
b.
Hypothesis:
Null hypothesis (H0): There is no statistical significant correlation between renovation cost and
selling price of houses.
Alternative hypothesis (H1): There is a statistical significant correlation between renovation cost
and selling price of houses.
Regression analysis: Estimates
SUMMARY
OUTPUT
Regression Statistics
Multiple
R 0.680978
R Square 0.463731
Adjusted
R Square 0.441386
Standard
Error 216593.2
Observati
ons 26
tabler-icon-diamond-filled.svg

Paraphrase This Document

Need a fresh take? Get an instant paraphrase of this document with our AI Paraphraser
Document Page
ANOVA
df SS MS F
Significa
nce F
Regressio
n 1
9.74E+
11
9.74E+
11
20.753
65 0.000129
Residual 24
1.13E+
12
4.69E+
10
Total 25
2.1E+1
2
Coefficie
nts
Standar
d Error t Stat
P-
value
Lower
95%
Upper
95%
Lower
95.0%
Upper
95.0%
Intercept 311121.5 110798
2.8080
06
0.0097
46 82445.62
539797
.4
82445.
62
539797
.4
Renovatio
n Costs 5.855479
1.28533
1
4.5556
18
0.0001
29 3.202685
8.5082
72
3.2026
85
8.5082
72
P<0.05: Hypothesis accepted
Referring this, it can be presented significant correlation takes place between selling
price and renovation cost of houses.
Regression analysis: Originals
SUMMARY OUTPUT
Regression Statistics
Multiple R
0.70781
4
R Square
0.50100
1
Adjusted R
Square
0.48020
9
Standard
Error
197596.
9
Observations 26
ANOVA
df SS MS F
Significan
ce F
Regression 1
9.40827E+
11
9.41E+
11
24.09
626 5.24E-05
Document Page
Residual 24
9.37069E+
11
3.9E+1
0
Total 25
1.8779E+1
2
Coeffici
ents
Standard
Error t Stat
P-
value
Lower
95%
Upper
95%
Lower
95.0%
Upper
95.0%
Intercept
278159.
2
101680.10
1
2.735
631
0.011
523 68301.79
488016
.6
68301.7
9 488016.6
Renovation
Costs
5.58299
7
1.1373458
74
4.908
794
5.24E-
05 3.235631
7.9303
64
3.23563
1 7.930364
c.
Particulars Figures
Average figure on the basis of estimation $2070
Average figure on the basis of actuals $2149
Difference 2149 – 2070
= $79
% difference (79 / 2070) * 100
= 3.81%
d.
Assessing regression equation using renovation cost and selling price related to estimates
Document Page
1 2 3 4 5 6 7 8 9 10 11 12 13 14 15 16 17 18 19 20 21 22 23 24 25 26
0
200,000
400,000
600,000
800,000
1,000,000
1,200,000
1,400,000
1,600,000
1,800,000
f(x) = 1005.12820512821 x + 66046.1538461538
f(x) = 11504.2735042735 x + 622000
Renovation cost Linear (Renovation cost ) Selling price
Linear (Selling price) Linear (Selling price)
3.
Blakeview quarterly median house prices
Q3 2017 300,000
Q4 2017 326,250
Q1 2018 310,000
Q2 2018 317,500
Q3 2018 315,000
Q4 2018 345,250
tabler-icon-diamond-filled.svg

Paraphrase This Document

Need a fresh take? Get an instant paraphrase of this document with our AI Paraphraser
Document Page
Q3 2017 Q4 2017 Q1 2018 Q2 2018 Q3 2018 Q4 2018
270,000
280,000
290,000
300,000
310,000
320,000
330,000
340,000
350,000
f(x) = 5714.28571428572 x + 299000
Blakeview quarterly median house prices
(Source: South Australian Government Data directory, 2019)
Enfield quarterly median house prices
Q3 2017 432,000
Q4 2017 445,000
Q1 2018 465,000
Q2 2018 425,500
Q3 2018 456,500
Q4 2018 438,600
Document Page
Q3 2017 Q4 2017 Q1 2018 Q2 2018 Q3 2018 Q4 2018
400,000
410,000
420,000
430,000
440,000
450,000
460,000
470,000
f(x) = 800 x + 440966.666666667
Enfield quarterly median house prices
(Source: South Australian Government Data directory, 2019)
Gelnunga quarterly median house prices
Q3 2017 880,000
Q4 2017 1,210,000
Q1 2018 1,275,000
Q2 2018 1,115,000
Q3 2018 1,177,500
Q4 2018 1,530,000
Document Page
Q3 2017 Q4 2017 Q1 2018 Q2 2018 Q3 2018 Q4 2018
0
200,000
400,000
600,000
800,000
1,000,000
1,200,000
1,400,000
1,600,000
1,800,000
f(x) = 85500 x + 898666.666666667
Gelnunga quarterly median house prices
(Source: South Australian Government Data directory, 2019)
Henley Beach quarterly median house prices
Q3 2017 895,000
Q4 2017 828,000
Q1 2018 843,000
Q2 2018 963,000
Q3 2018 880,000
Q4 2018 900,000
tabler-icon-diamond-filled.svg

Paraphrase This Document

Need a fresh take? Get an instant paraphrase of this document with our AI Paraphraser
Document Page
Q3 2017 Q4 2017 Q1 2018 Q2 2018 Q3 2018 Q4 2018
750,000
800,000
850,000
900,000
950,000
1,000,000
f(x) = 8600 x + 854733.333333333
Henley Beach quarterly median house prices
(Source: South Australian Government Data directory, 2019)
4.
Revised renovation cost and selling prices on the basis of average percentage difference:
3.81%
Renova
tion
Renovat
ion cost
Revised
renovat
ion cost
Selling
prices
Revis
ed
sellin
g
price
s
1 85,000 88,239 420,000
43600
2
2 60,000 62,286 580,000
60209
8
3 120,000 124,572 740,000
76819
4
4 45,000 46,715 950,000
98619
5
5 40,000 41,524 650,000 67476
Document Page
5
6 65,000 67,477 680,000
70590
8
7 130,000 134,953
1,250,00
0
12976
25
8 35,000 36,334 860,000
89276
6
9 80,000 83,048 690,000
71628
9
10 75,000 77,858 540,000
56057
4
11 40,000 41,524 350,000
36333
5
12 110,000 114,191 780,000
80971
8
13 90,000 93,429 480,000
49828
8
14 75,000 77,858 920,000
95505
2
15 80,000 83,048 680,000
70590
8
16 55,000 57,096 620,000
64362
2
17 105,000 109,001 920,000
95505
2
18 60,000 62,286 840,000
87200
4
19 50,000 51,905 610,000
63324
1
20 45,000 46,715 700,000
72667
0
21 115,000 119,382
1,300,00
0
13495
30
22 65,000 67,477 630,000
65400
3
23 180,000 186,858
1,680,00
0
17440
08
24 75,000 77,858 540,000
56057
4
25 80,000 83,048 870,000
90314
7
26 110,000 114,191 930,000
96543
3
chevron_up_icon
1 out of 17
circle_padding
hide_on_mobile
zoom_out_icon