Statistics Assignment - Histogram
13 Pages2004 Words66 Views
Added on 2020-07-23
Statistics Assignment - Histogram
Added on 2020-07-23
ShareRelated Documents
STATISTICS

TABLE OF CONTENTSINTRODUCTION...........................................................................................................................1Question 1........................................................................................................................................1(a).................................................................................................................................................1(1)Histogram and shape of distribution...................................................................................1(2)Measures of central tendency and OGIVE chart................................................................2(b)Analysis of descriptive statistics.............................................................................................4© Analysis of data.......................................................................................................................5(1)Drawing of table and comparison of results.......................................................................5(2)Difference between mean and median and their uses.........................................................5(3) Explaination of quartiles....................................................................................................5(4) Additional information required........................................................................................6(5) Comparison of standard deviation.....................................................................................6Question 2........................................................................................................................................6(a).................................................................................................................................................6(1)Selection of model..............................................................................................................6(2) Brief explaination on seasonal variation model.................................................................7(b).................................................................................................................................................7(1)Graphical representation.....................................................................................................7(2)Forecast values....................................................................................................................8(C)................................................................................................................................................8(1) Accuracy of forecasts and identification of random factors..............................................8(2) Comment on Mr Sweaty opinion.......................................................................................8(d) Charting of data......................................................................................................................8CONCLUSION................................................................................................................................9

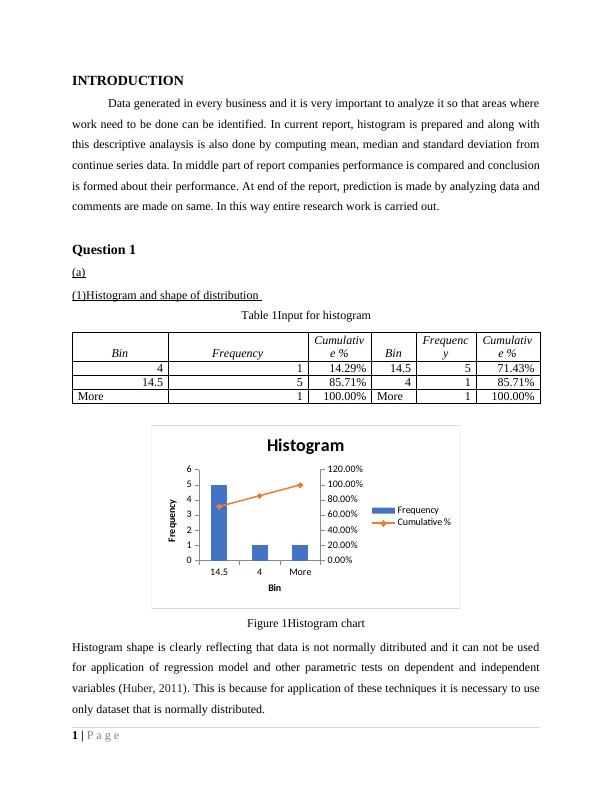
INTRODUCTIONData generated in every business and it is very important to analyze it so that areas wherework need to be done can be identified. In current report, histogram is prepared and along withthis descriptive analaysis is also done by computing mean, median and standard deviation fromcontinue series data. In middle part of report companies performance is compared and conclusionis formed about their performance. At end of the report, prediction is made by analyzing data andcomments are made on same. In this way entire research work is carried out.Question 1(a)(1)Histogram and shape of distribution Table 1Input for histogramBinFrequencyCumulative %BinFrequencyCumulative %4114.29%14.5571.43%14.5585.71%4185.71%More1100.00%More1100.00%14.54More01234560.00%20.00%40.00%60.00%80.00%100.00%120.00%HistogramFrequencyCumulative %BinFrequencyFigure 1Histogram chartHistogram shape is clearly reflecting that data is not normally ditributed and it can not be usedfor application of regression model and other parametric tests on dependent and independentvariables (Huber, 2011). This is because for application of these techniques it is necessary to useonly dataset that is normally distributed.1 | P a g e
End of preview
Want to access all the pages? Upload your documents or become a member.
Related Documents
Solved Statistics Assignment (Doc)lg...
|17
|1920
|253
BUGEN1502 | Statistical Chartslg...
|6
|564
|15
Analytical methods in engineering PDFlg...
|14
|1147
|300
Assessment —Research Reportlg...
|8
|1296
|53
Statistics: ANOVA, Regression and Frequency Distributionlg...
|7
|818
|371
MNC Google - The Pioneer of Search Enginelg...
|16
|926
|17