Statistics Report: Statistical Analysis of Earnings and Prices
VerifiedAdded on 2021/02/21
|21
|2421
|84
Report
AI Summary
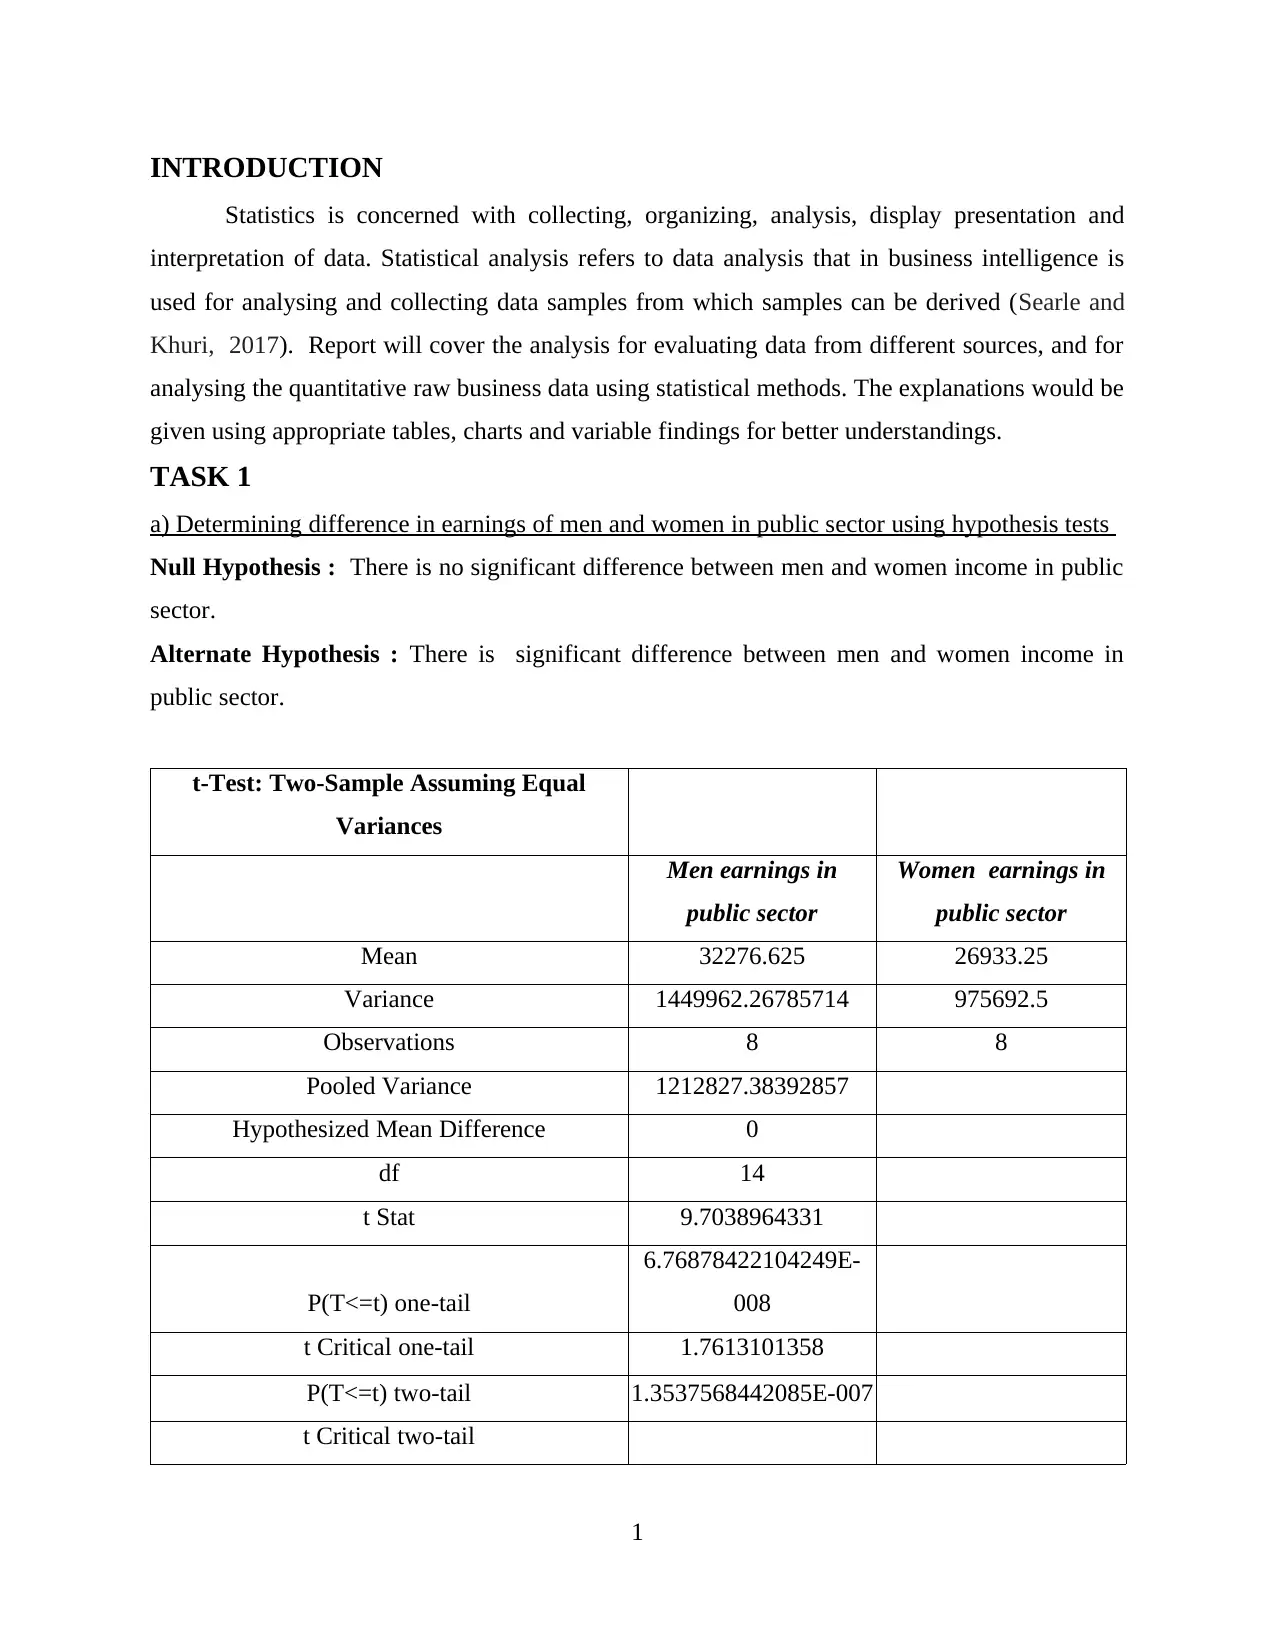
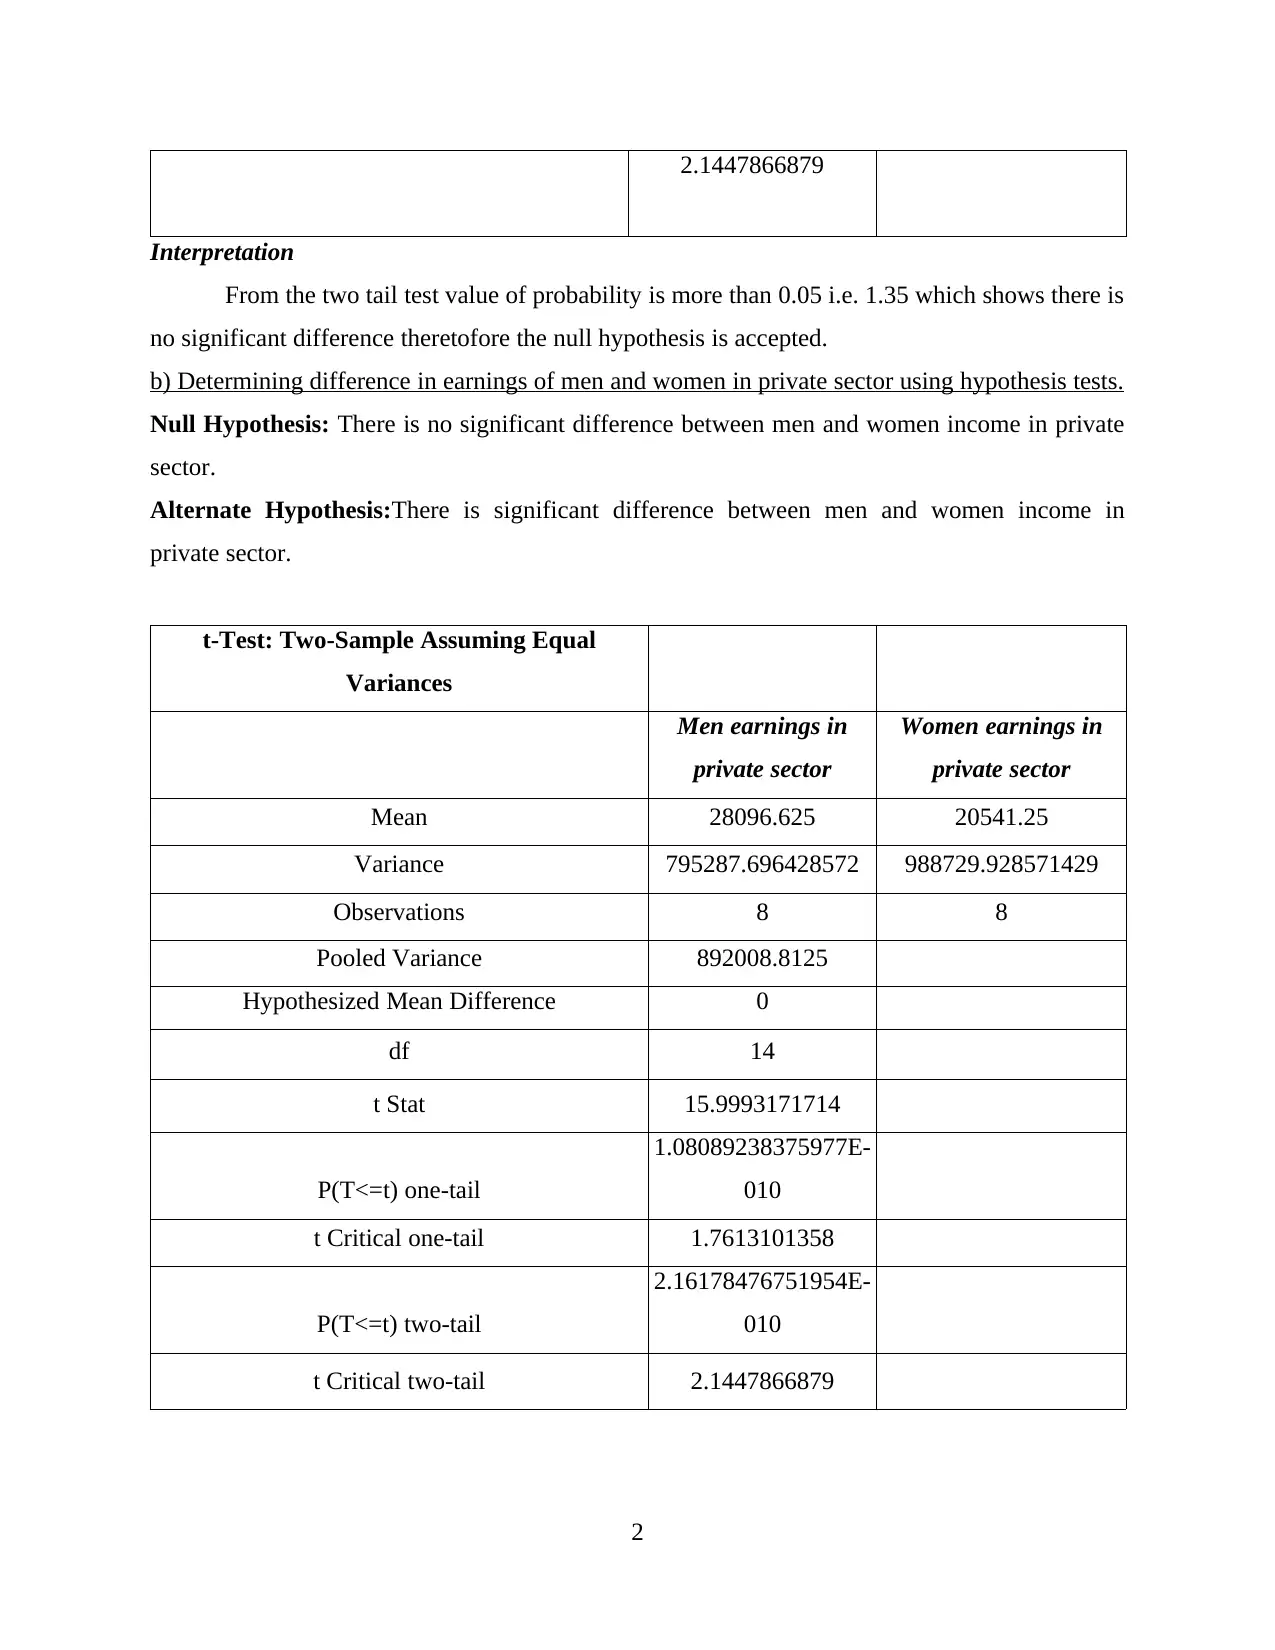
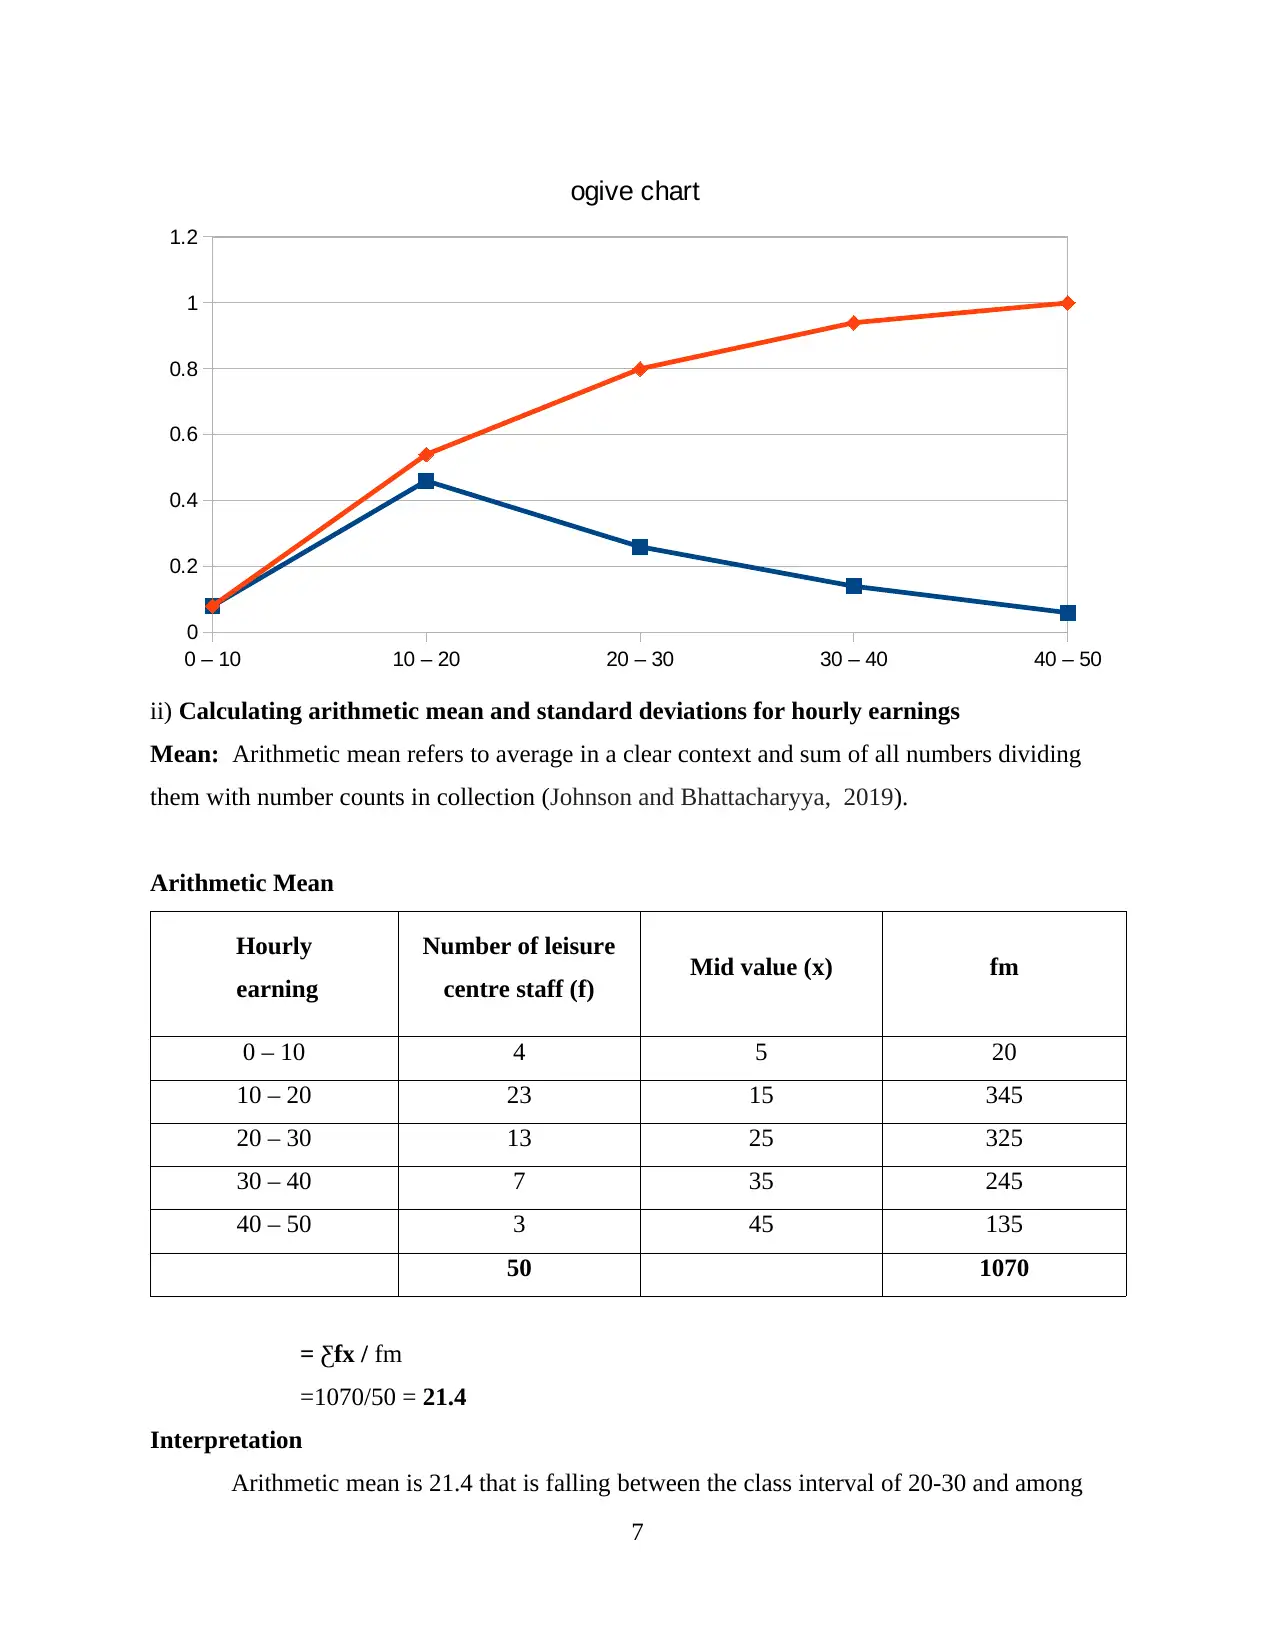
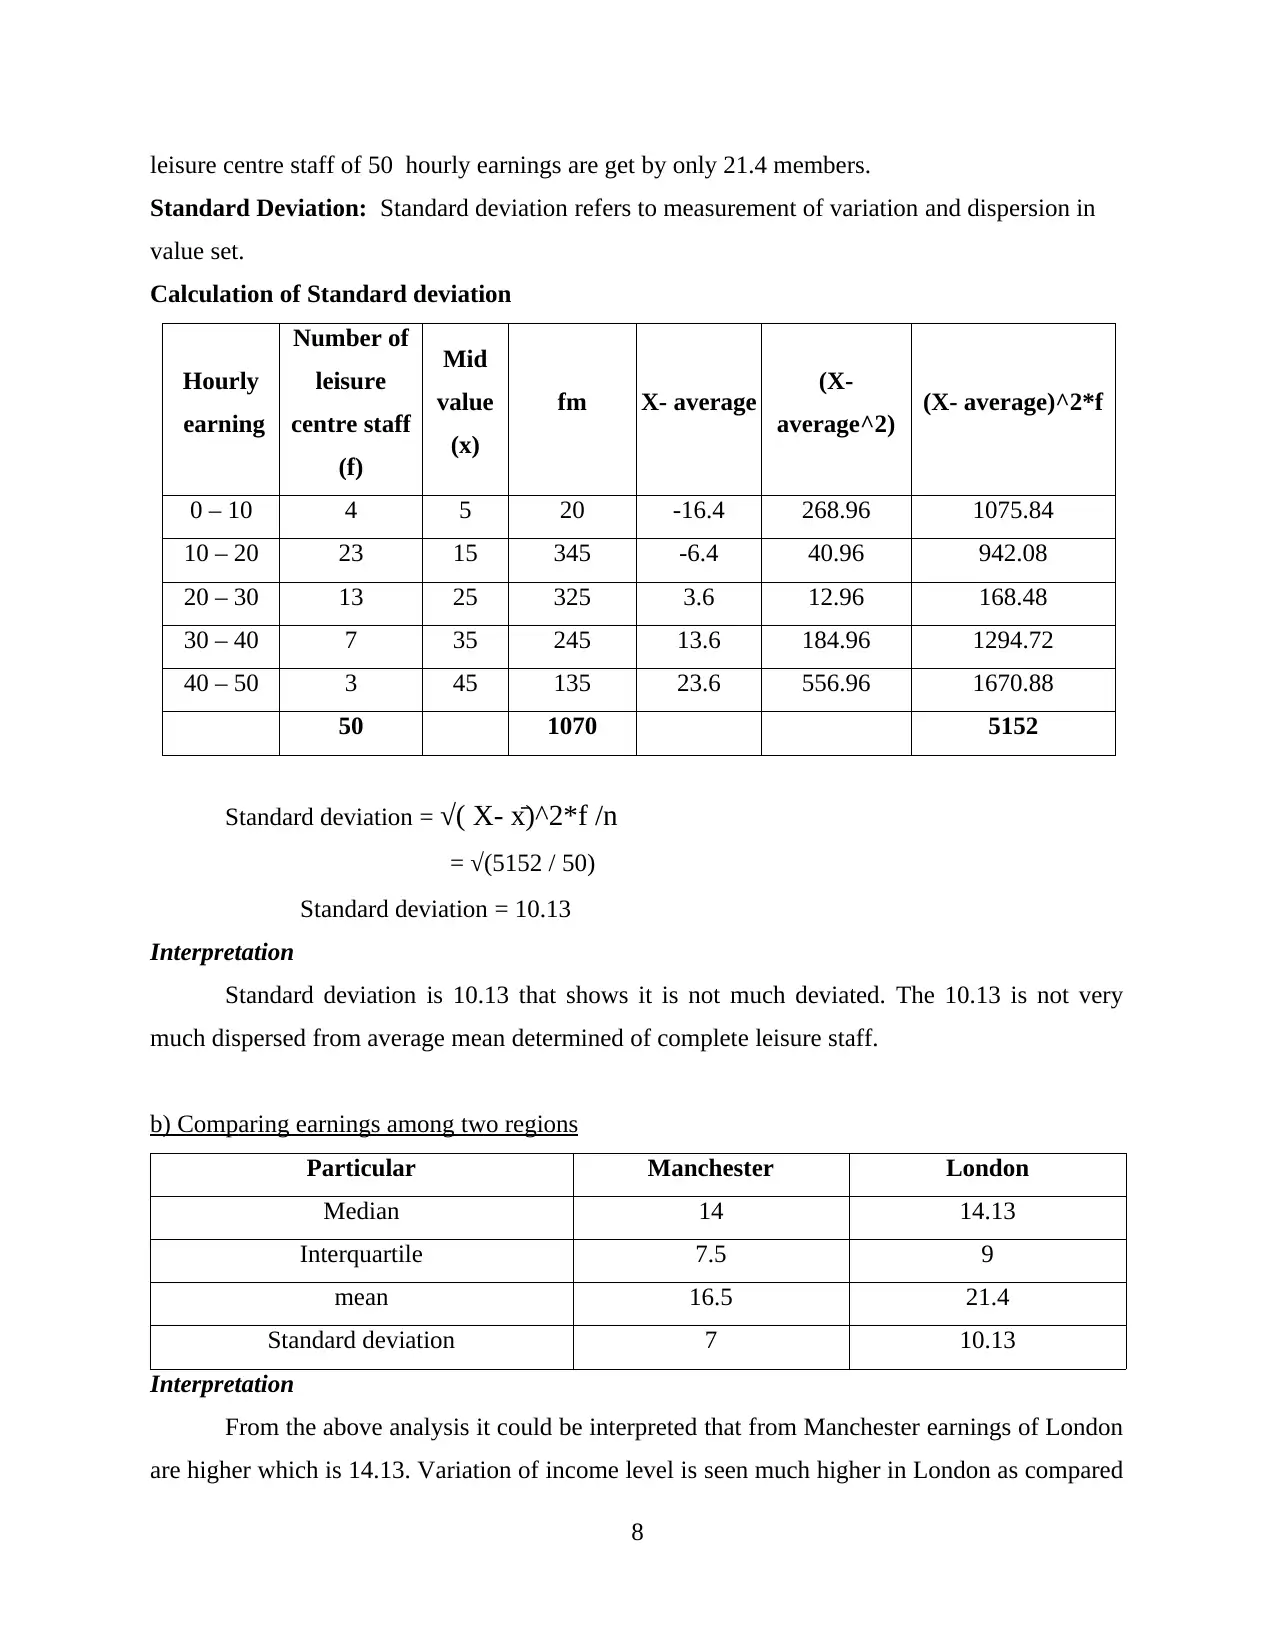
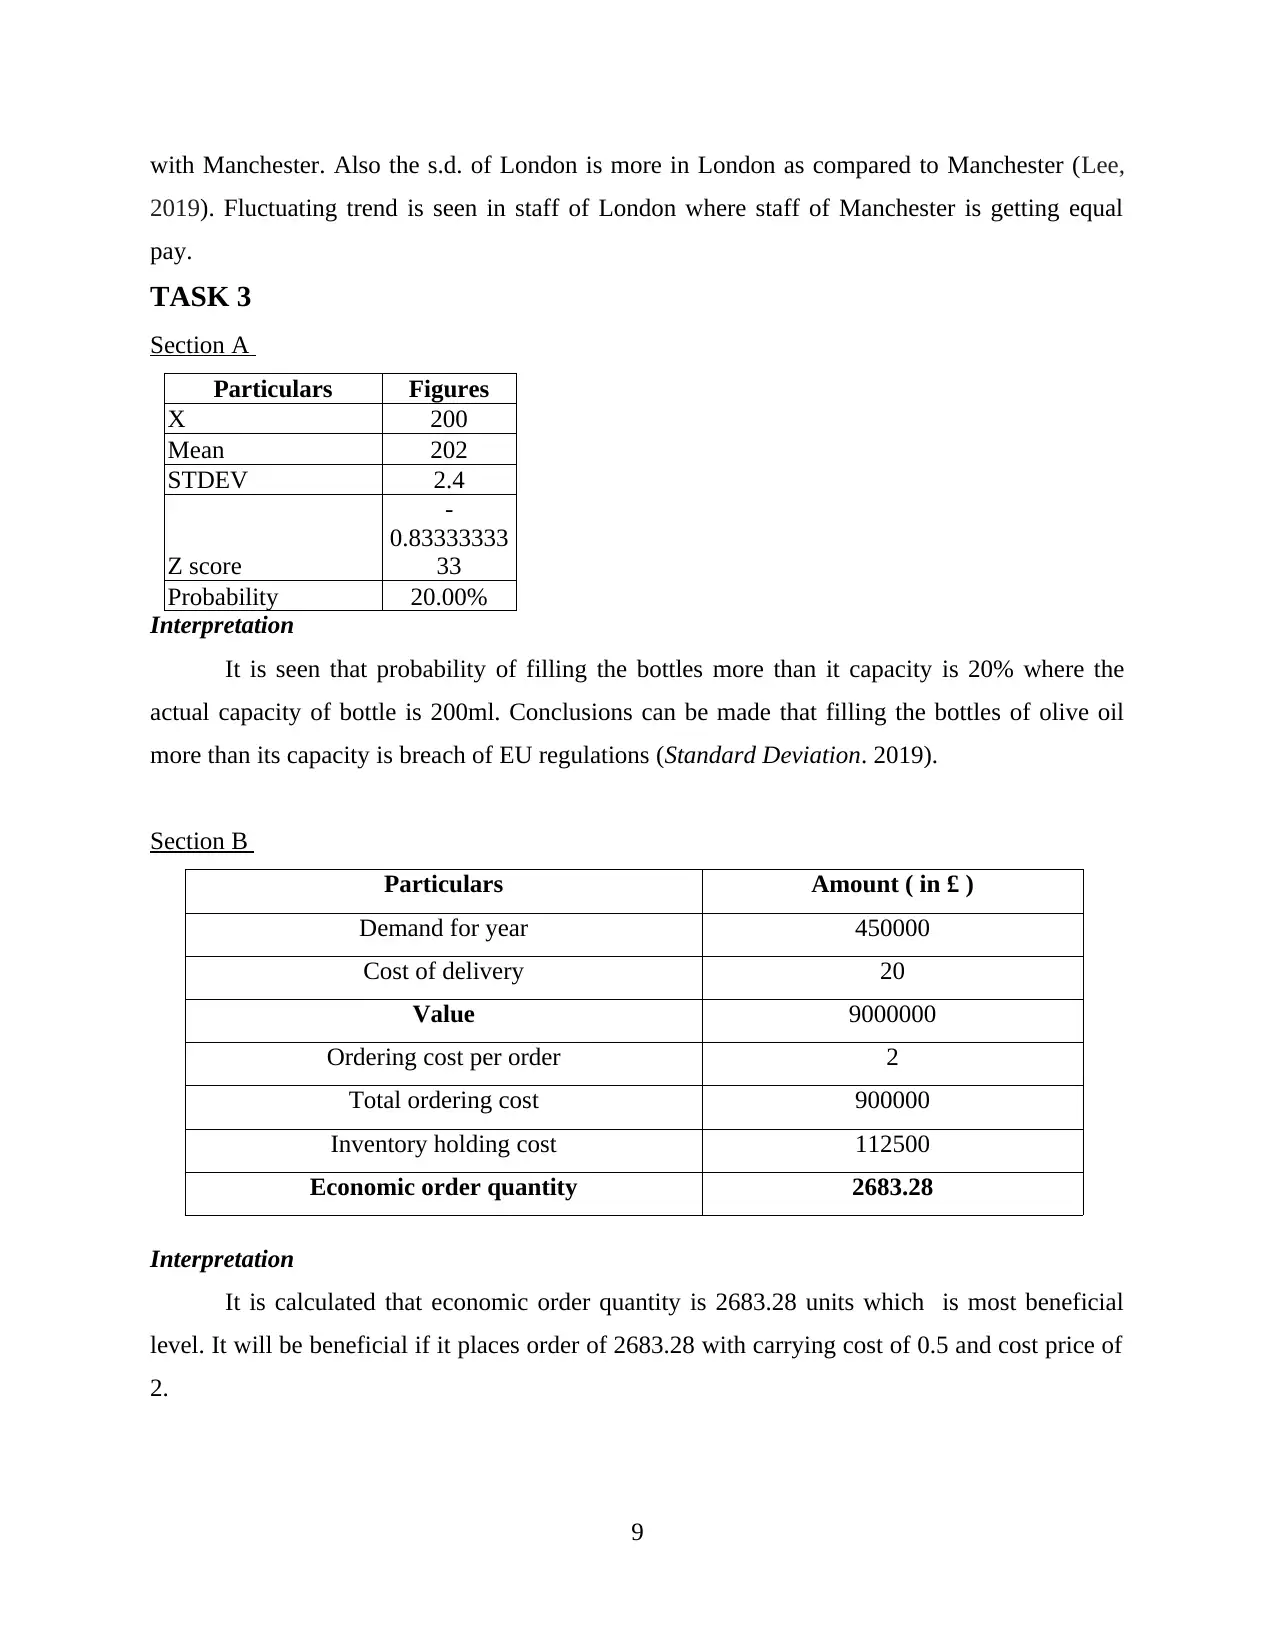
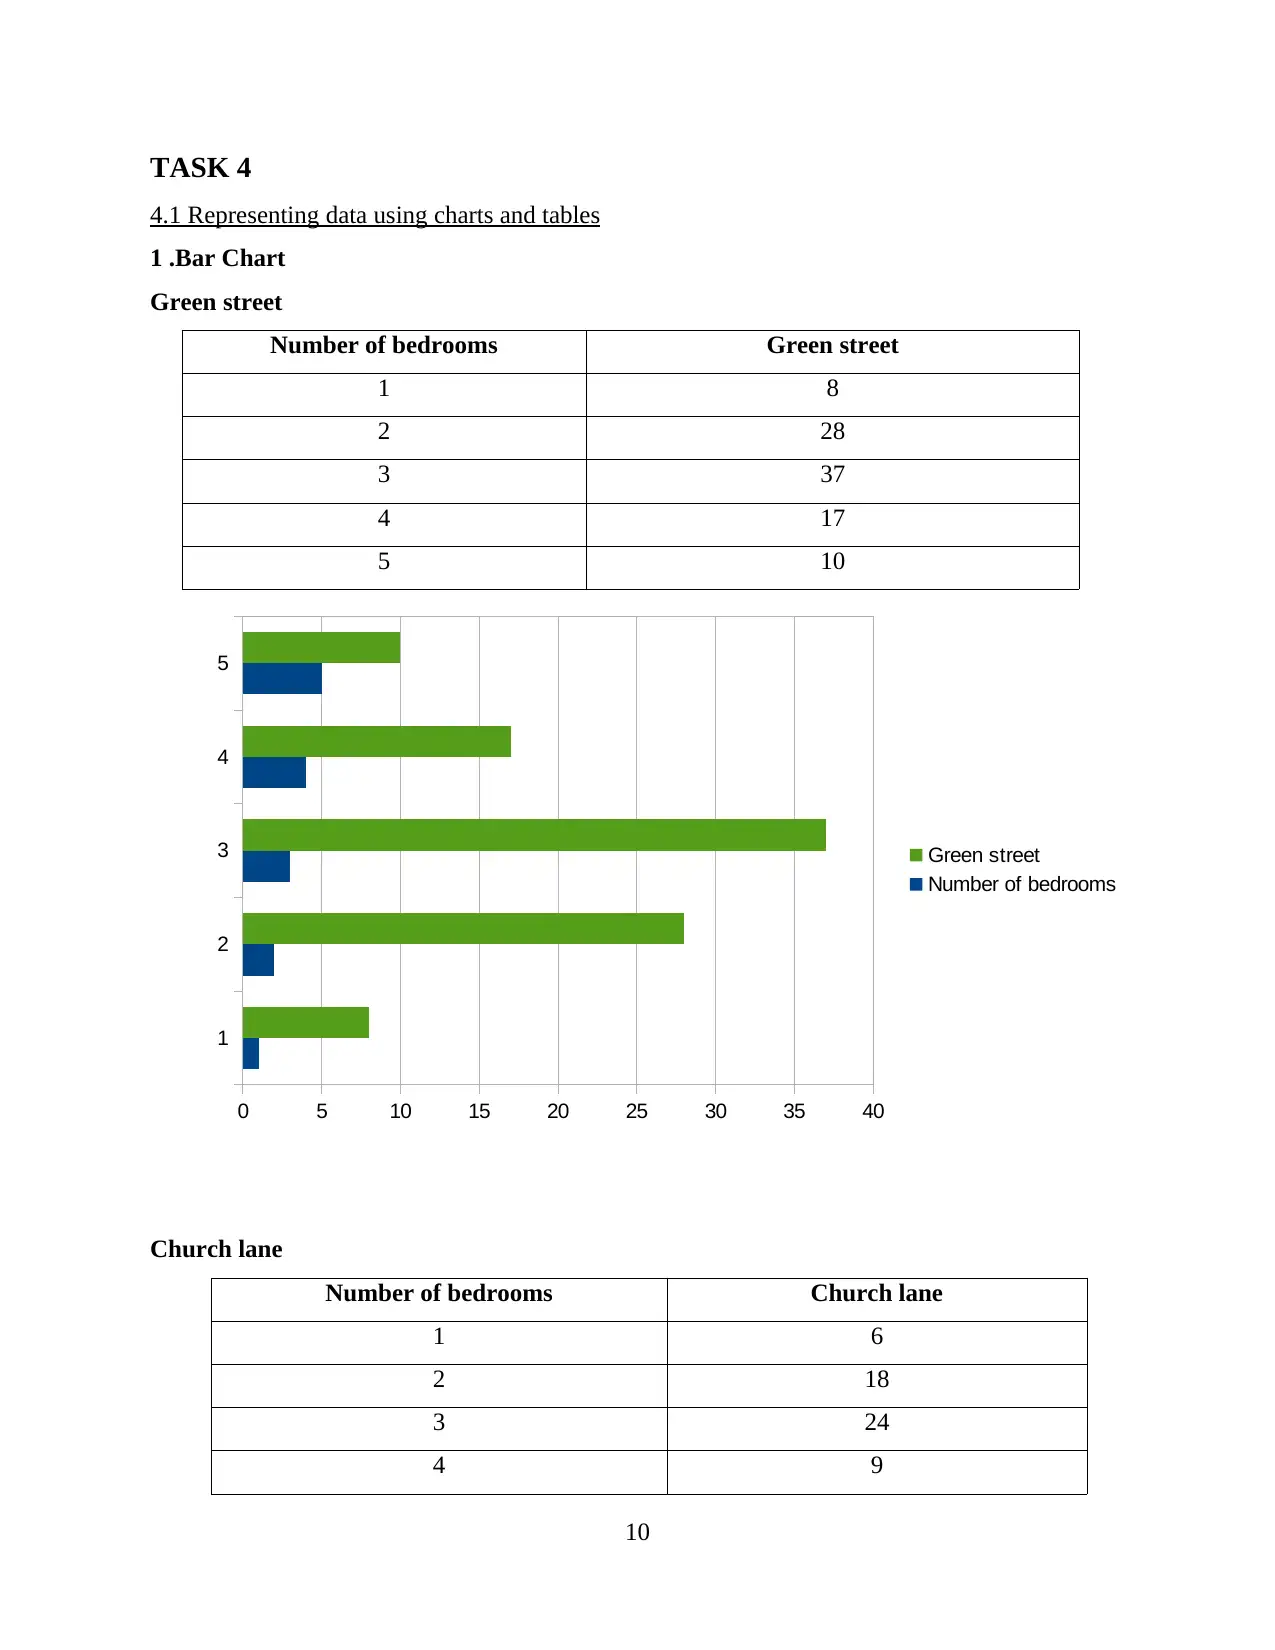
This report presents a comprehensive statistical analysis of earnings, prices, and growth rates across various sectors. It begins with hypothesis testing to determine differences in earnings between men and women in both the public and private sectors, followed by the creation of earning time charts and the calculation of annual growth rates. The report further evaluates hourly pay rates, compares earnings across different regions, and analyzes data representation using charts and tables, including bar and pie charts. Statistical methods such as calculating medians, quartiles, arithmetic means, and standard deviations are employed to interpret data from different sources. Additionally, the report delves into the analysis of average prices for two and three-bedroom properties across multiple streets, providing detailed interpretations and conclusions drawn from the data. Economic order quantity and probability calculations are also included to provide a comprehensive statistical overview.
1 out of 21
Related Documents


Your All-in-One AI-Powered Toolkit for Academic Success.
+13062052269
info@desklib.com
Available 24*7 on WhatsApp / Email
![[object Object]](/_next/static/media/star-bottom.7253800d.svg)
Copyright © 2020–2026 A2Z Services. All Rights Reserved. Developed and managed by ZUCOL.