Statistics Assignment Solution: Problems 2 and 3 - Analysis
VerifiedAdded on 2023/04/21
|7
|461
|437
Homework Assignment
AI Summary
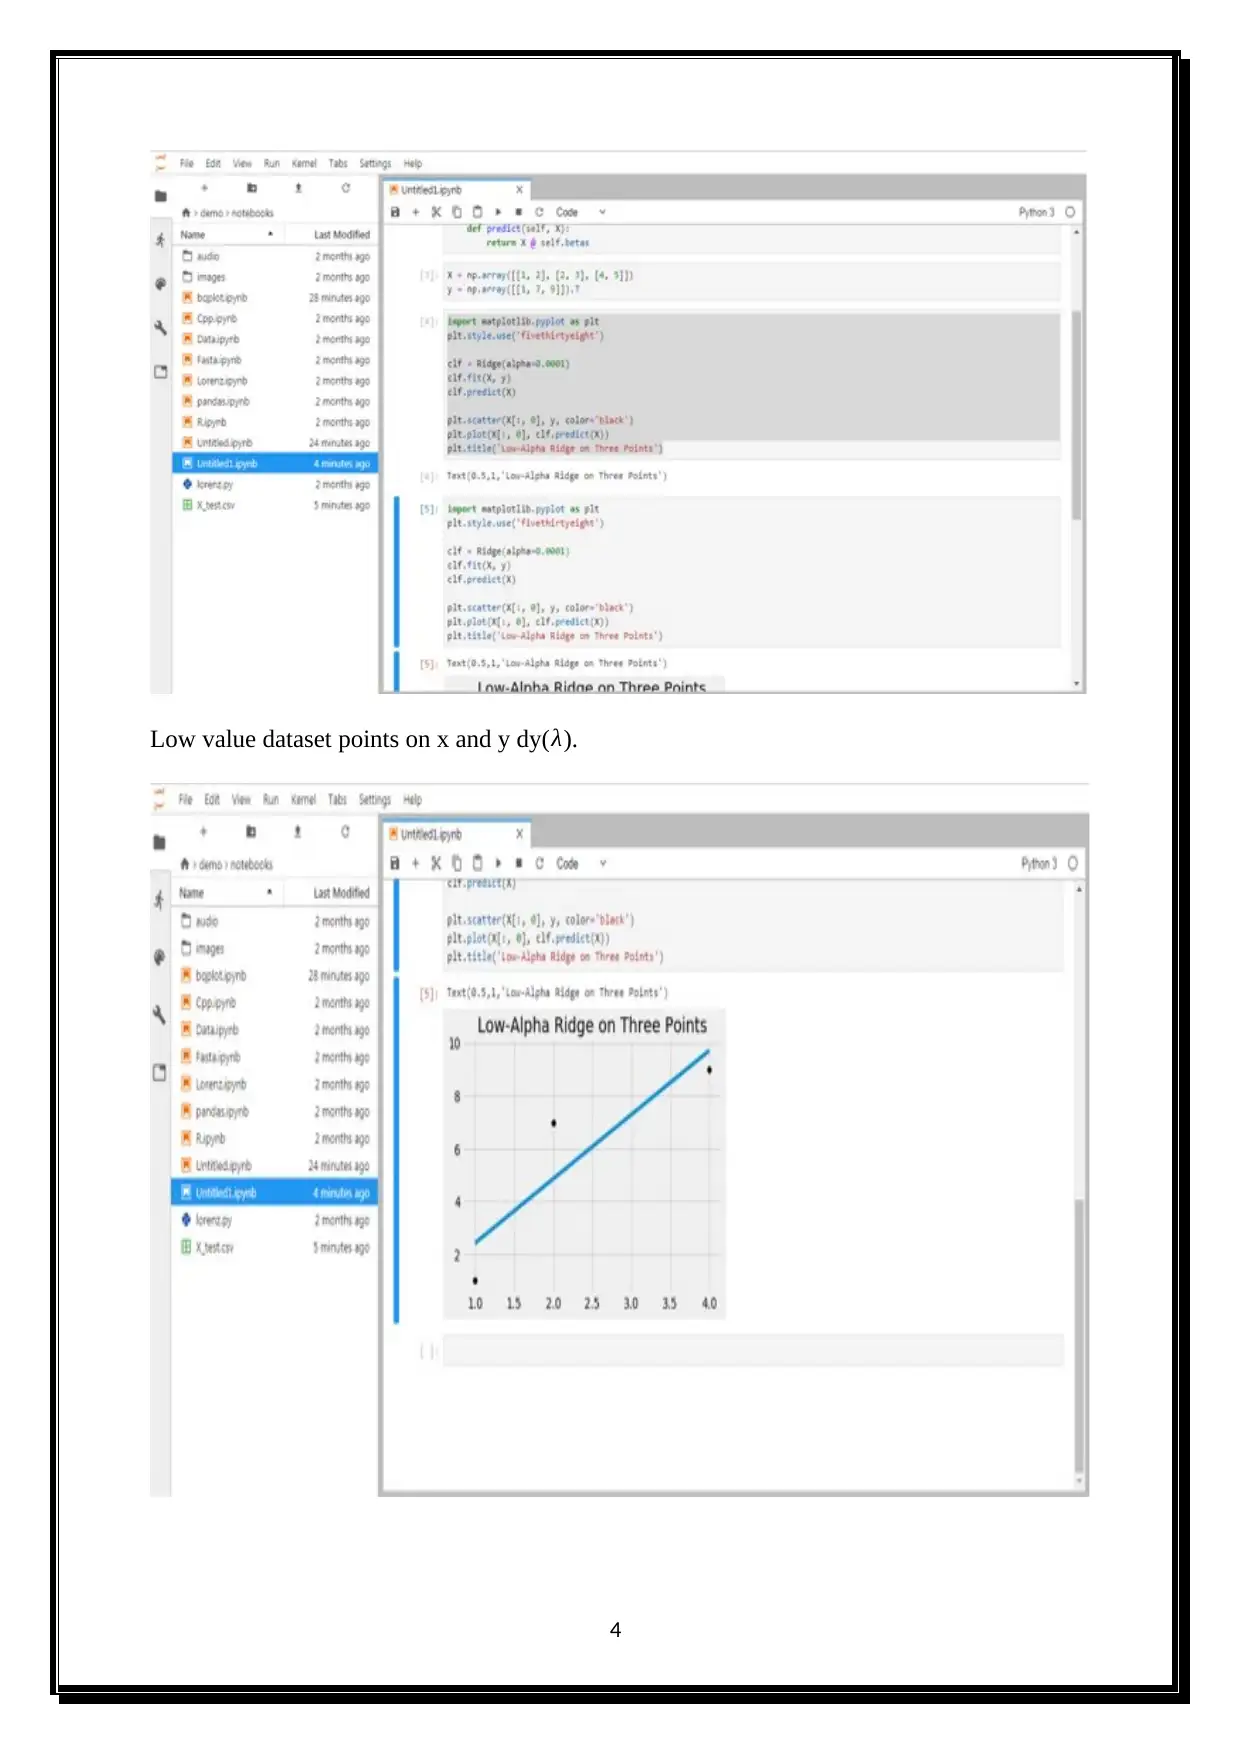
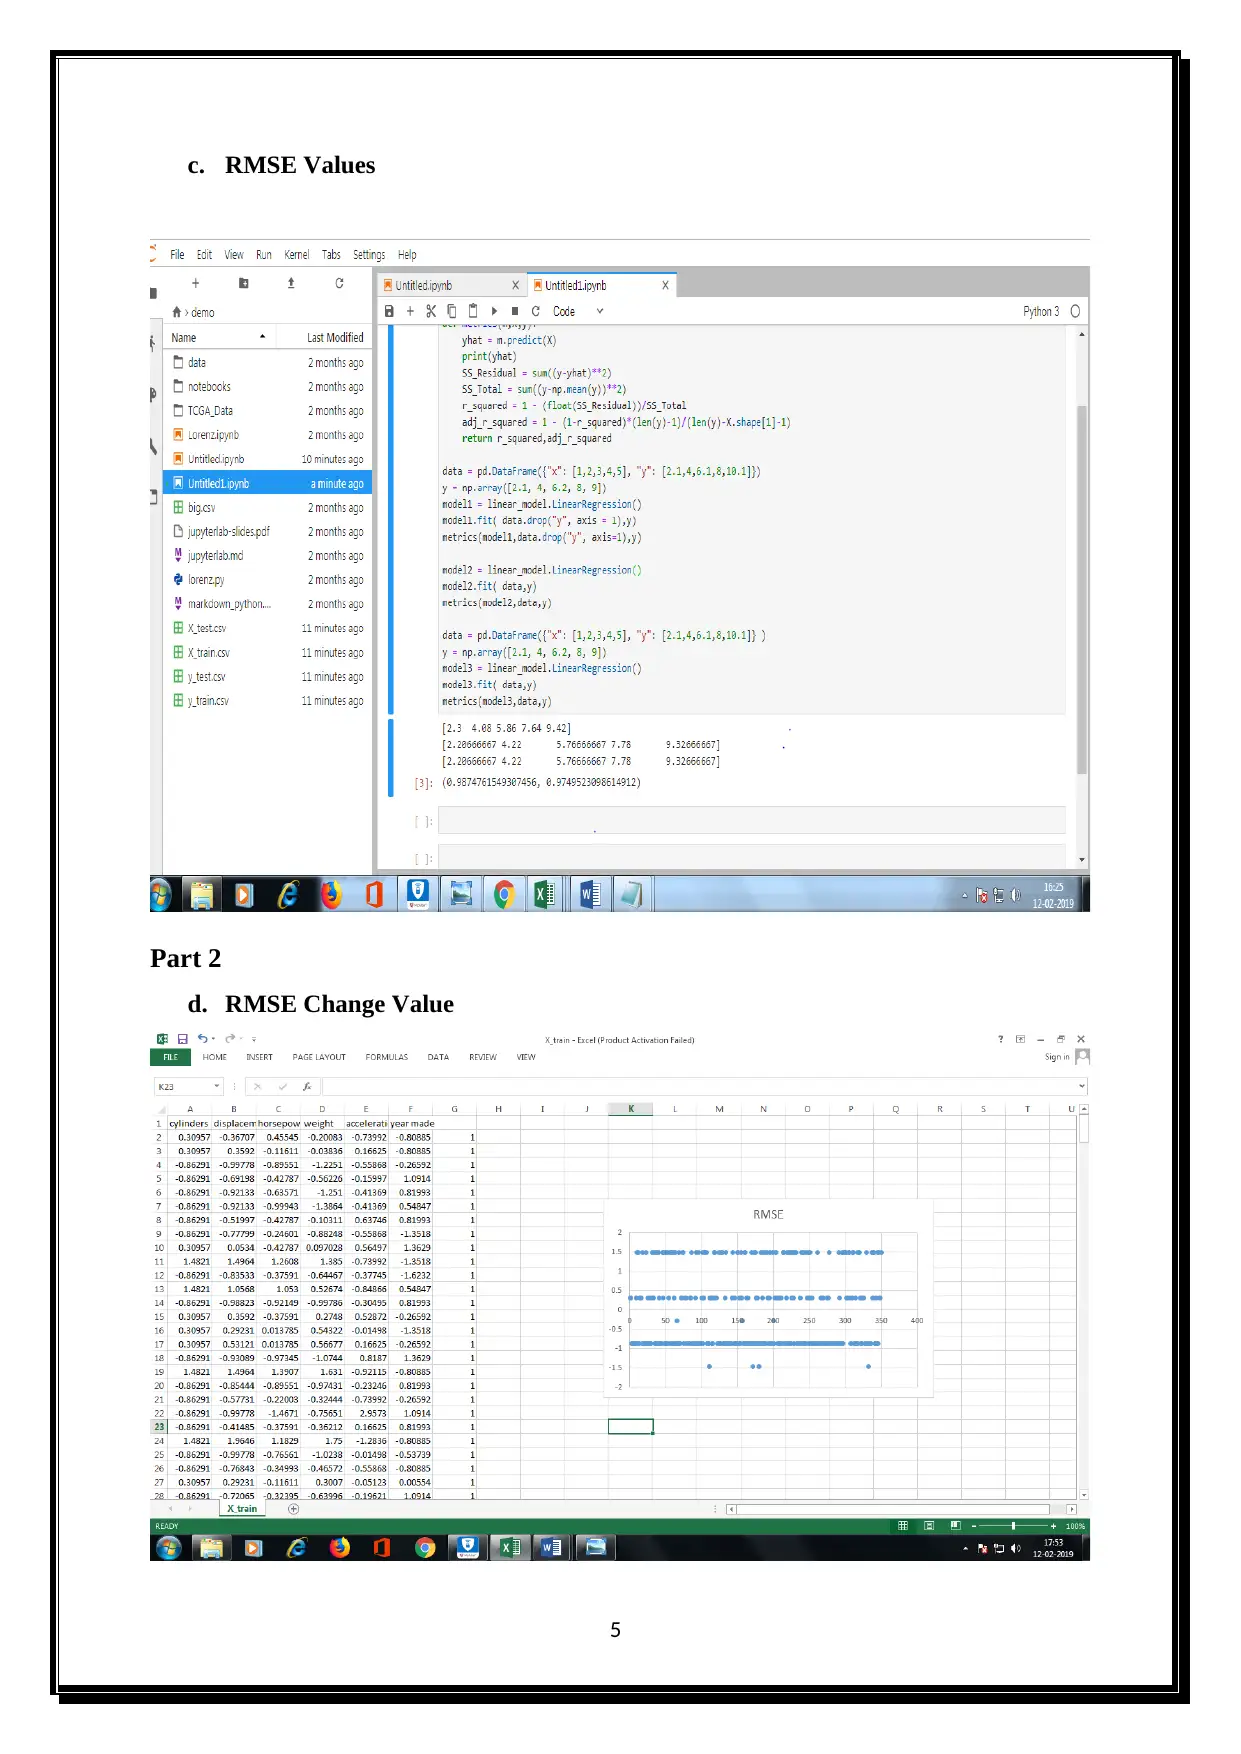
This document presents a solution to a statistics assignment, addressing problems 2 and 3. The solution to problem 2 involves applying linear regression techniques to a dataset, calculating the values of w, and minimizing errors using least squares. It includes detailed formulas and calculations for finding the intercept and vector elements within the matrix. Problem 3 is divided into two parts, with part 1 focusing on large square values, rapid expressions, low-value dataset points, and RMSE values. Part 2 addresses RMSE change values. The assignment demonstrates a practical application of statistical concepts and problem-solving skills.

1 out of 7
Related Documents


Your All-in-One AI-Powered Toolkit for Academic Success.
+13062052269
info@desklib.com
Available 24*7 on WhatsApp / Email
![[object Object]](/_next/static/media/star-bottom.7253800d.svg)
Copyright © 2020–2025 A2Z Services. All Rights Reserved. Developed and managed by ZUCOL.