Financial Ratio Analysis of Two Companies
VerifiedAdded on 2020/01/28
|36
|5153
|120
Report
AI Summary
This assignment examines the financial health and performance of two companies, Wolseley and Booker, through a comprehensive analysis of financial ratios. The analysis encompasses both traditional ratios (liquidity, solvency, profitability, activity) and comparative techniques like vertical and horizontal analysis across income statement, balance sheet, and cash flow statement data.
Contribute Materials
Your contribution can guide someone’s learning journey. Share your
documents today.

STRATEGIC FINANCIAL
ANALYSIS
ANALYSIS
Secure Best Marks with AI Grader
Need help grading? Try our AI Grader for instant feedback on your assignments.
TABLE OF CONTENTS
INTRODUCTION...........................................................................................................................1
Strategic financial analysis and its importance......................................................................1
Objectives...............................................................................................................................1
Overview of companies..........................................................................................................1
Methods of analysis................................................................................................................1
RATIO ANALYSIS.........................................................................................................................1
Profitability Ratios..................................................................................................................2
Liquidity Ratios......................................................................................................................6
Efficiency ratios......................................................................................................................8
Solvency ratio.......................................................................................................................12
Investor ratio.........................................................................................................................13
COMMON –SIZE..........................................................................................................................15
Horizontal.............................................................................................................................15
Vertical analysis...................................................................................................................16
Du-Pont.................................................................................................................................16
Segmental revenues..............................................................................................................17
ADVANTAGE AND DISADVANTAGE....................................................................................17
Ratio analysis........................................................................................................................17
Du-Pont.................................................................................................................................18
Segmental.............................................................................................................................18
CONCLUSION & RECOMMENDATIONS................................................................................18
Conclusion............................................................................................................................18
Recommendation..................................................................................................................19
CONTEMPROARY METHODS..................................................................................................19
CAPM model........................................................................................................................19
Efficient market hypothesis..................................................................................................19
Economic value added (EVA)..............................................................................................20
REFERENCES..............................................................................................................................21
APPENDIX....................................................................................................................................23
Wolseley’s ratio analysis......................................................................................................23
Booker’s ratio analysis.........................................................................................................24
Wolseley’s vertical analysis of income statement................................................................25
Wolseley’s vertical analysis of balance sheet......................................................................25
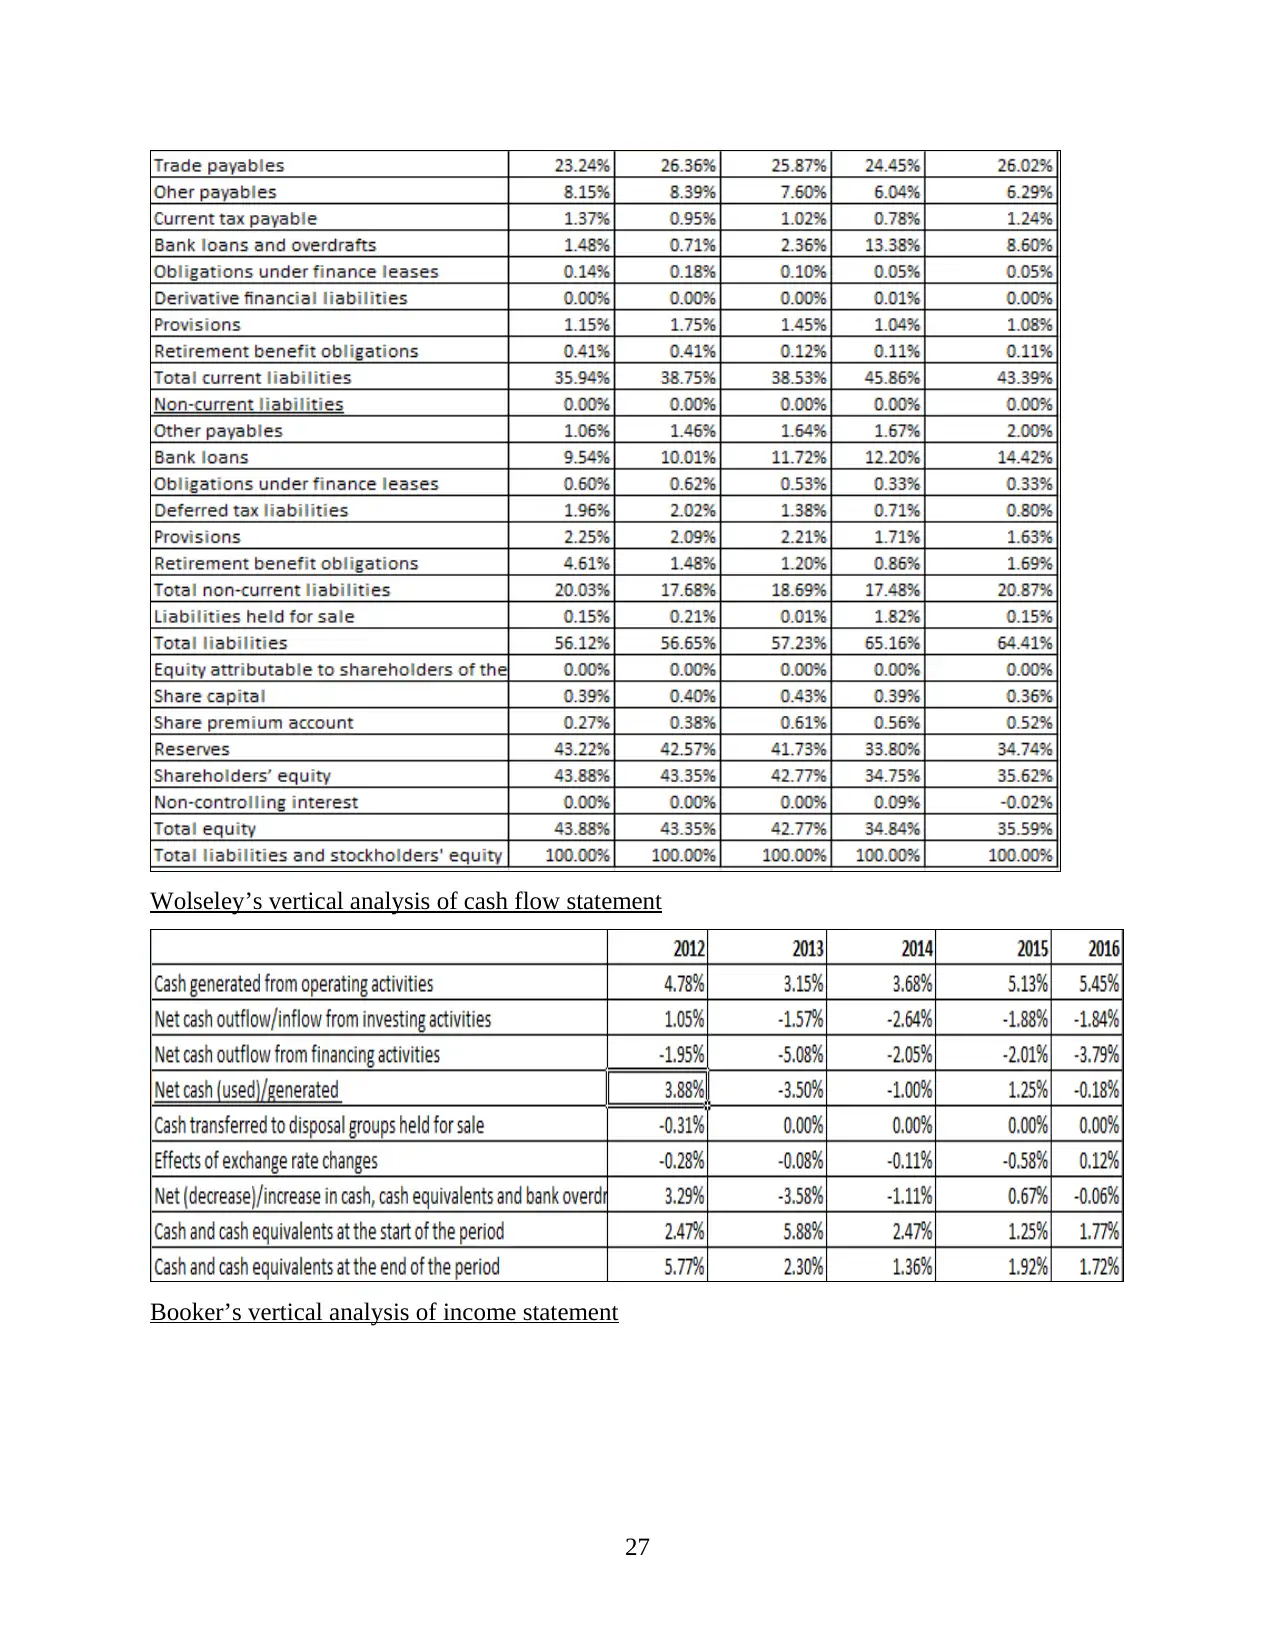
Wolseley’s vertical analysis of cash flow statement............................................................27
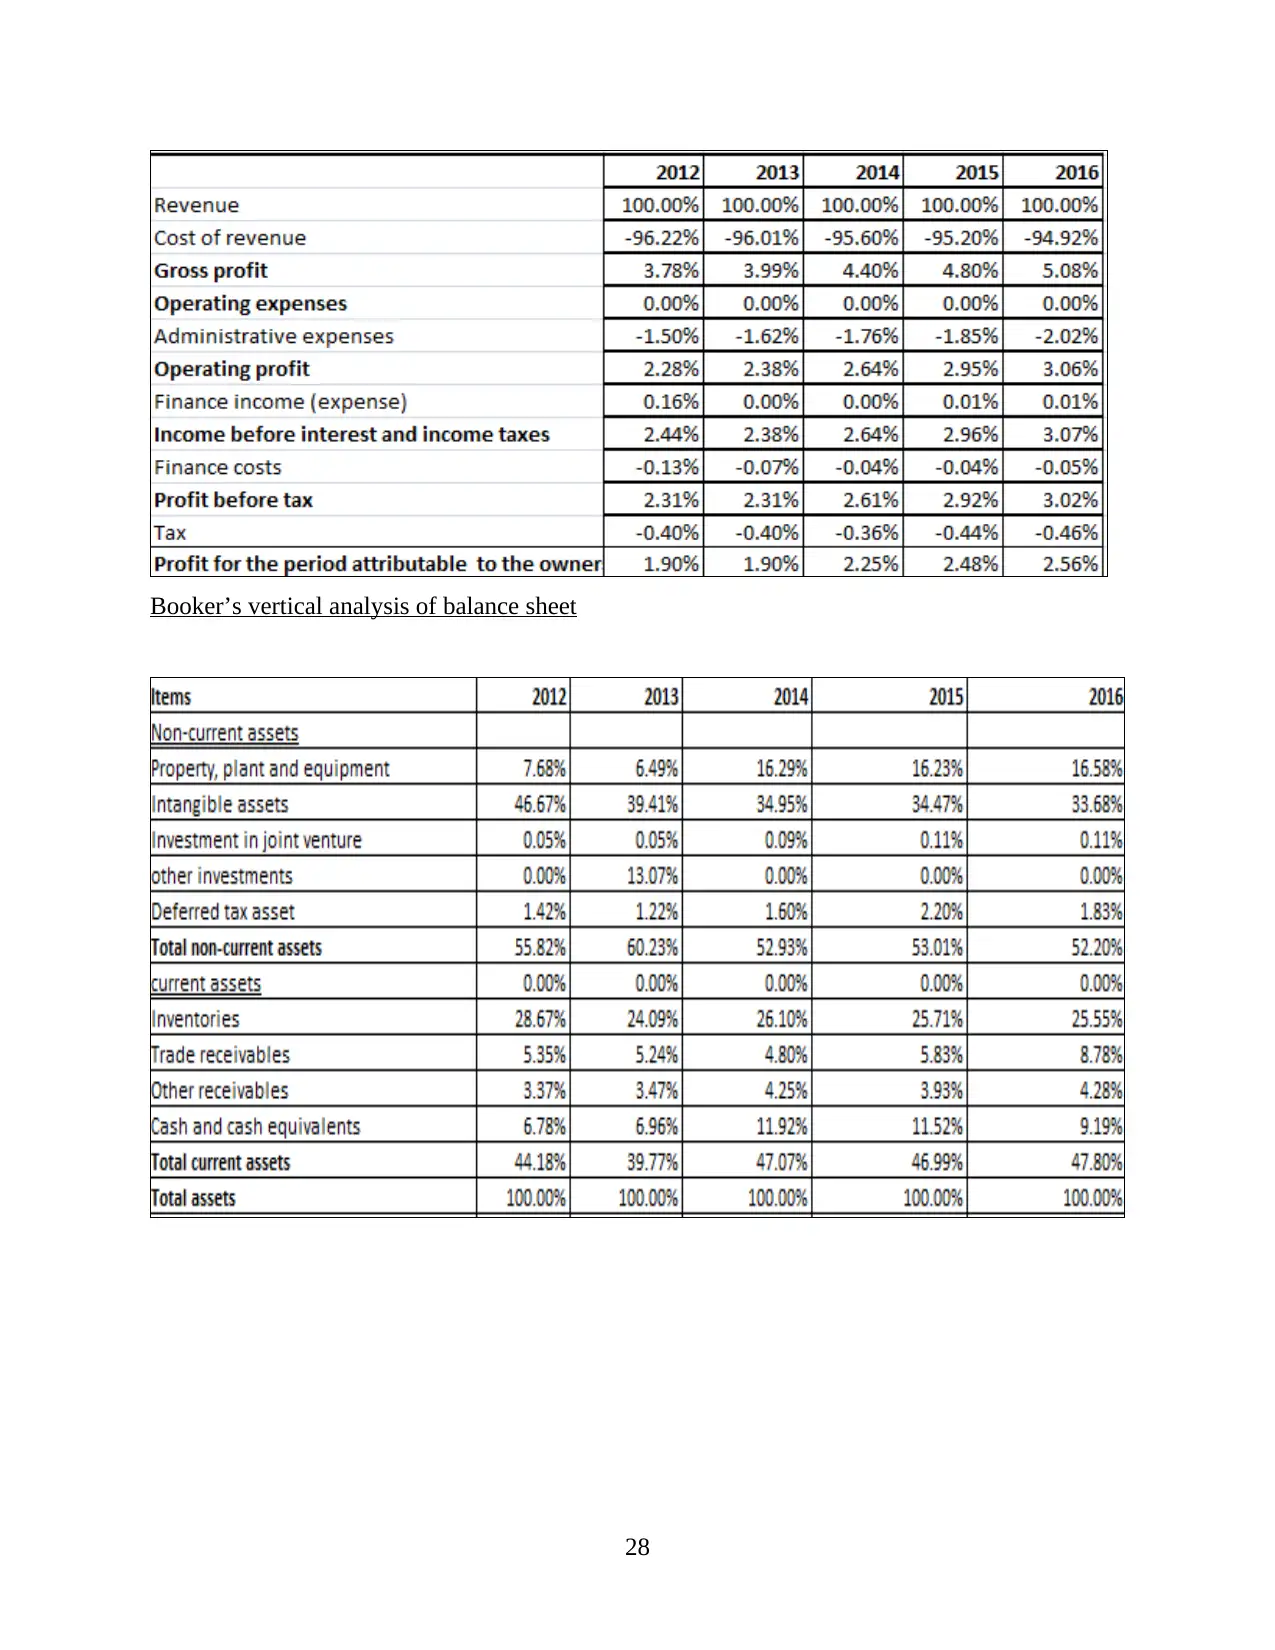
Booker’s vertical analysis of income statement...................................................................27
Booker’s vertical analysis of balance sheet..........................................................................28
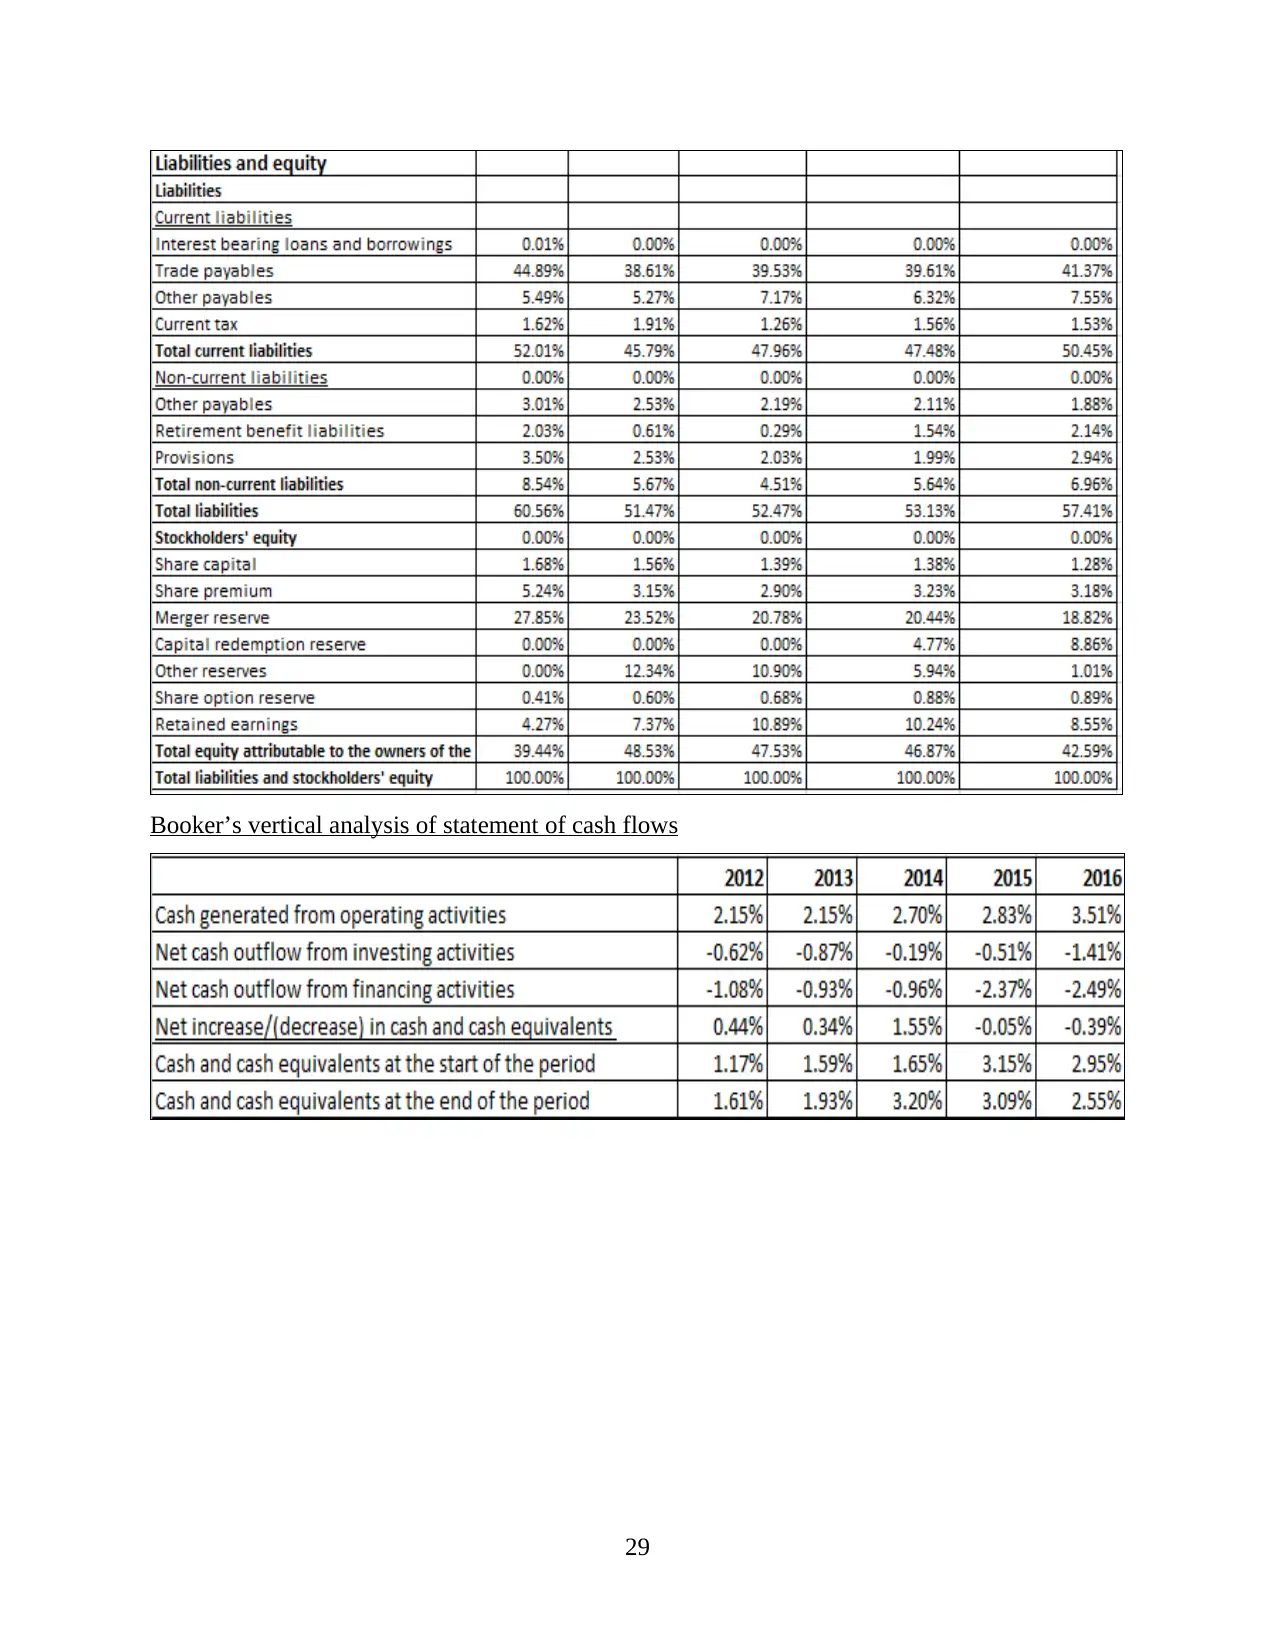
Booker’s vertical analysis of statement of cash flows..........................................................29
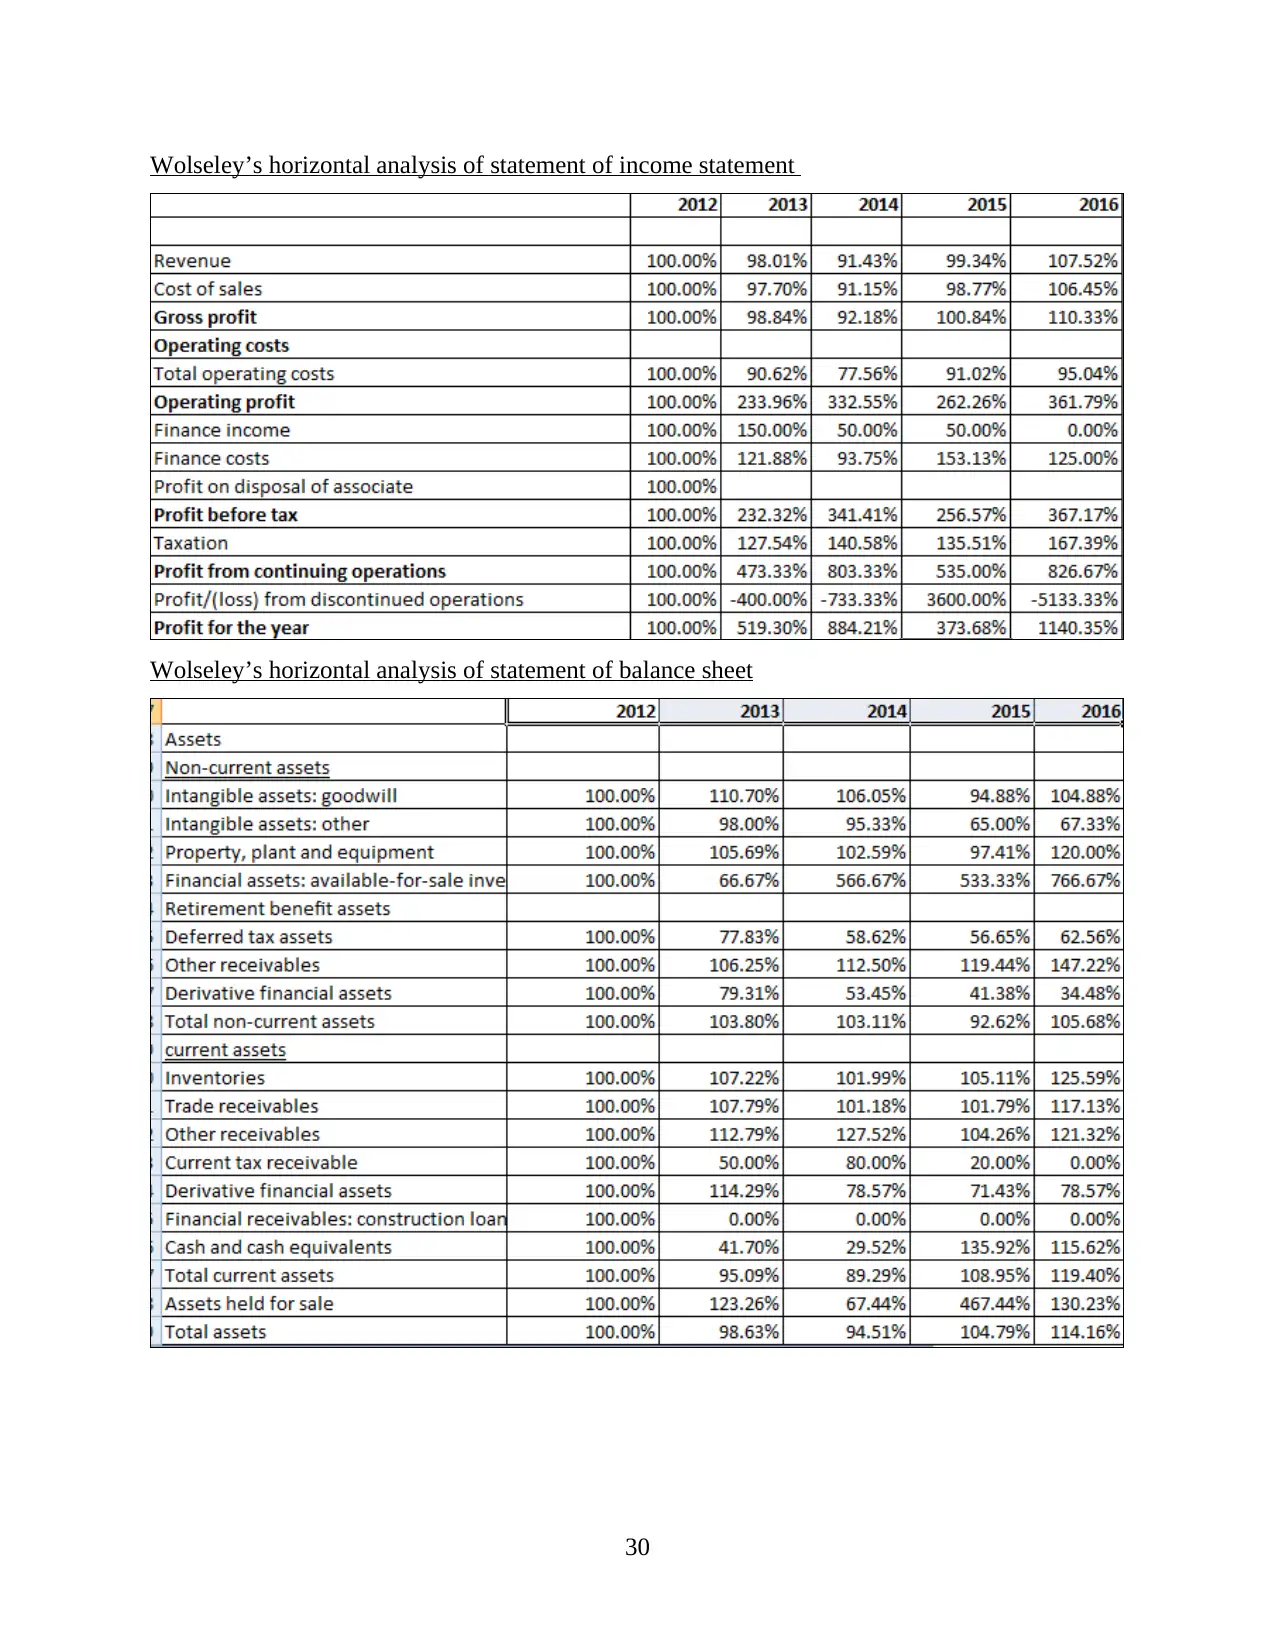
Wolseley’s horizontal analysis of statement of income statement.......................................30
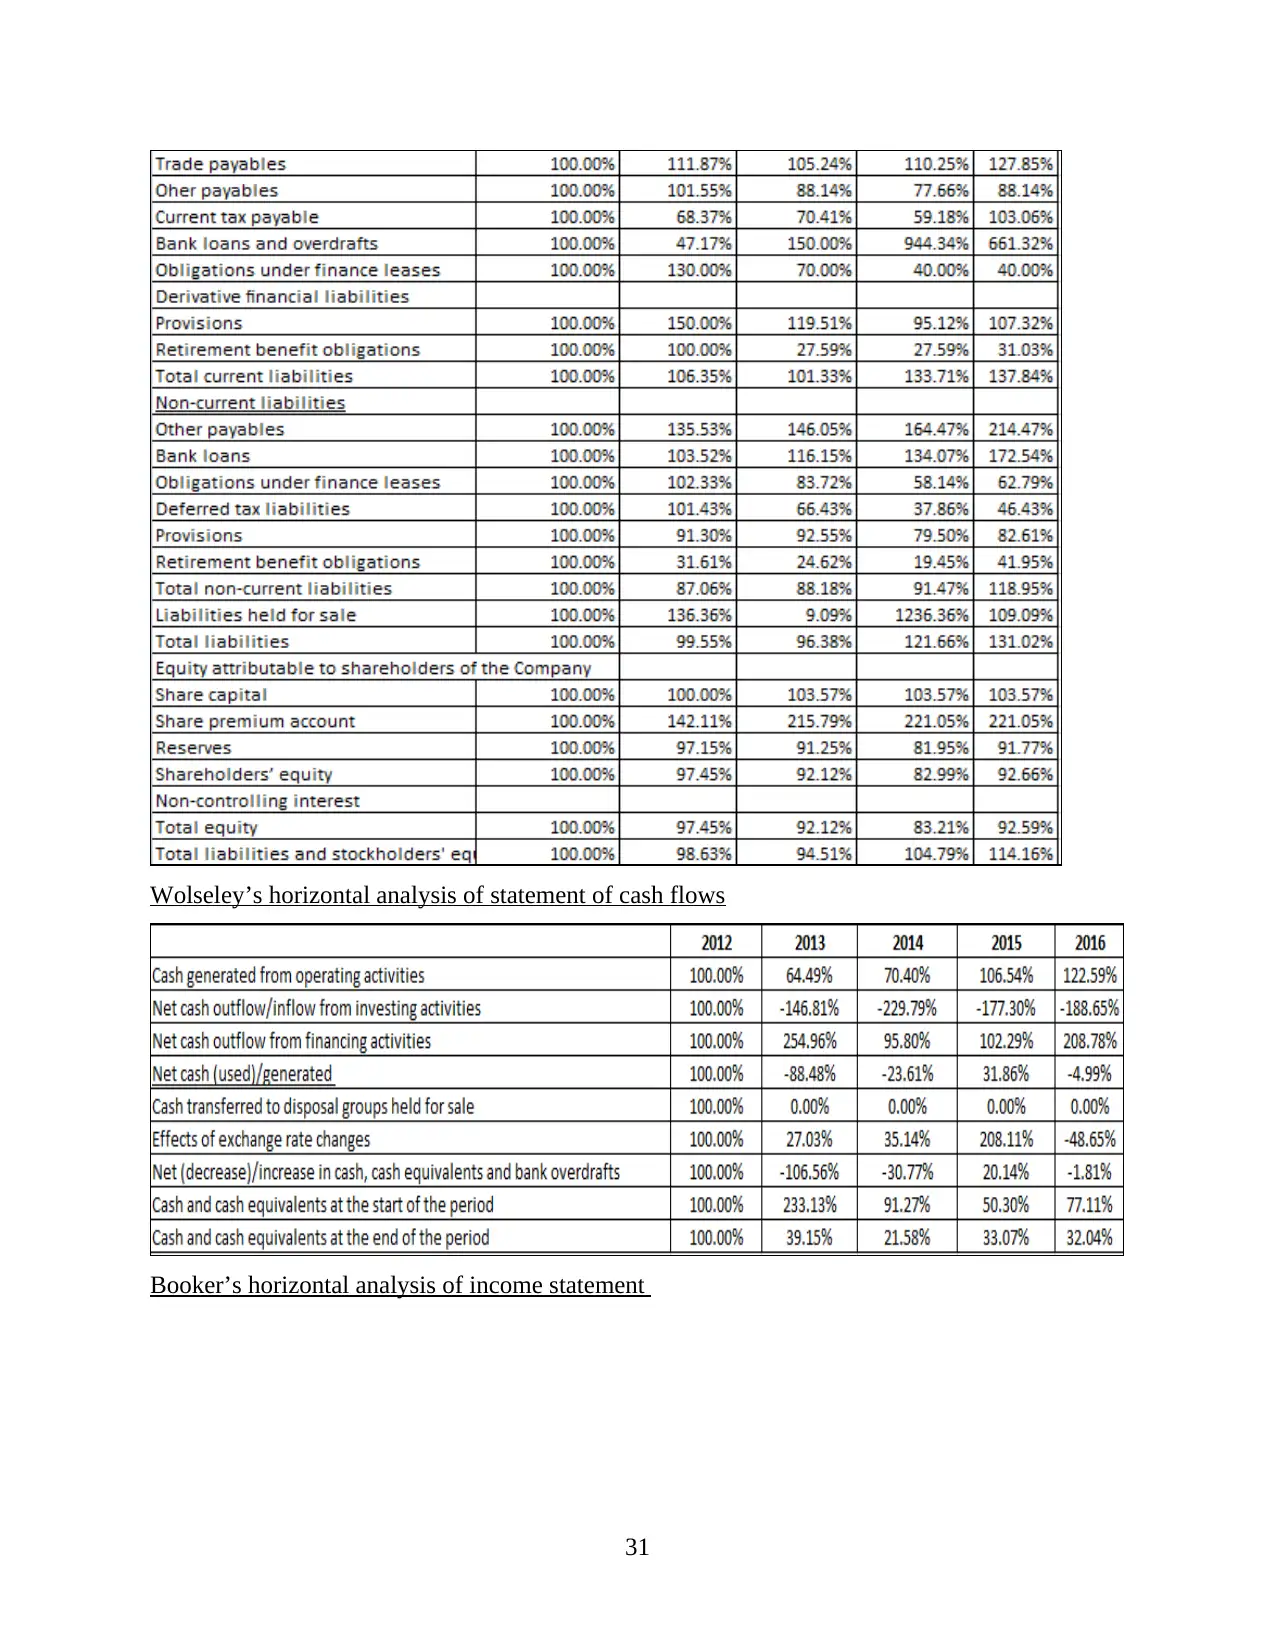
Wolseley’s horizontal analysis of statement of balance sheet..............................................30
Wolseley’s horizontal analysis of statement of cash flows..................................................31
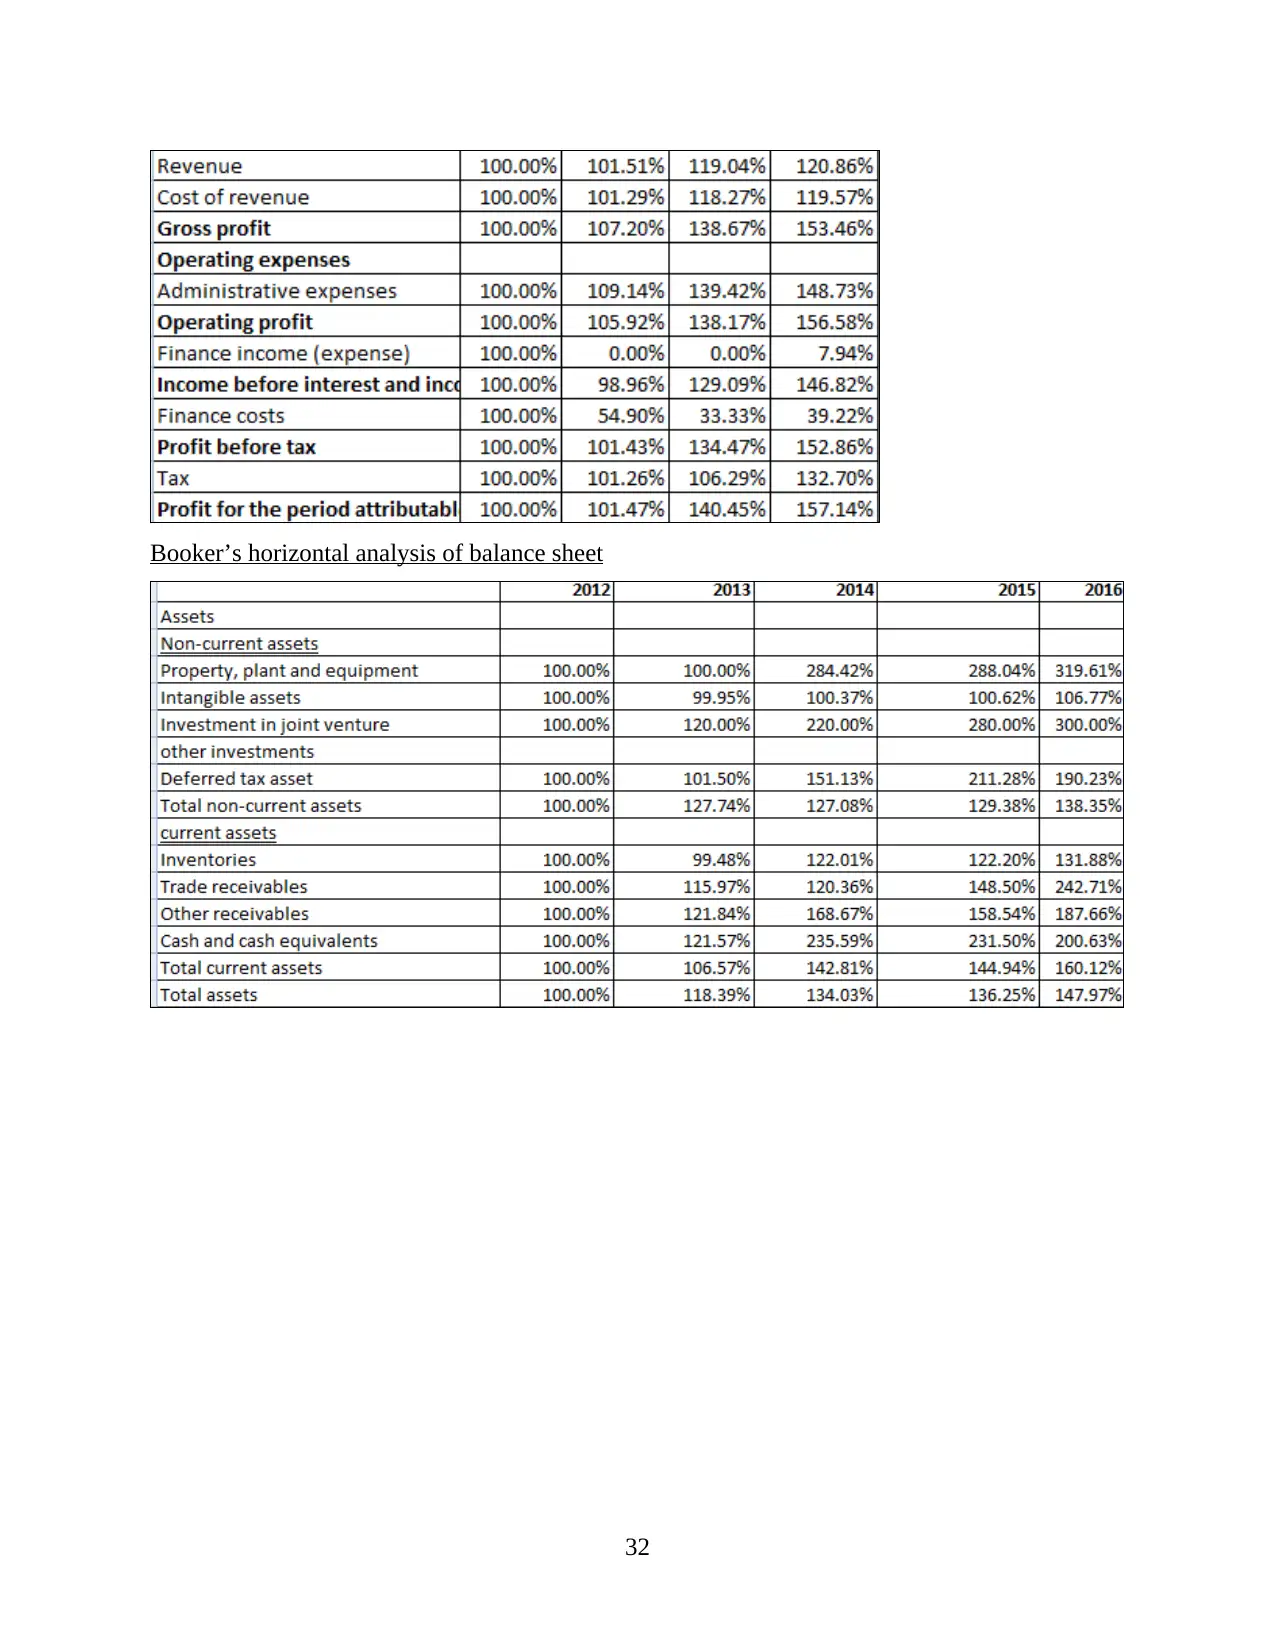
Booker’s horizontal analysis of income statement...............................................................31
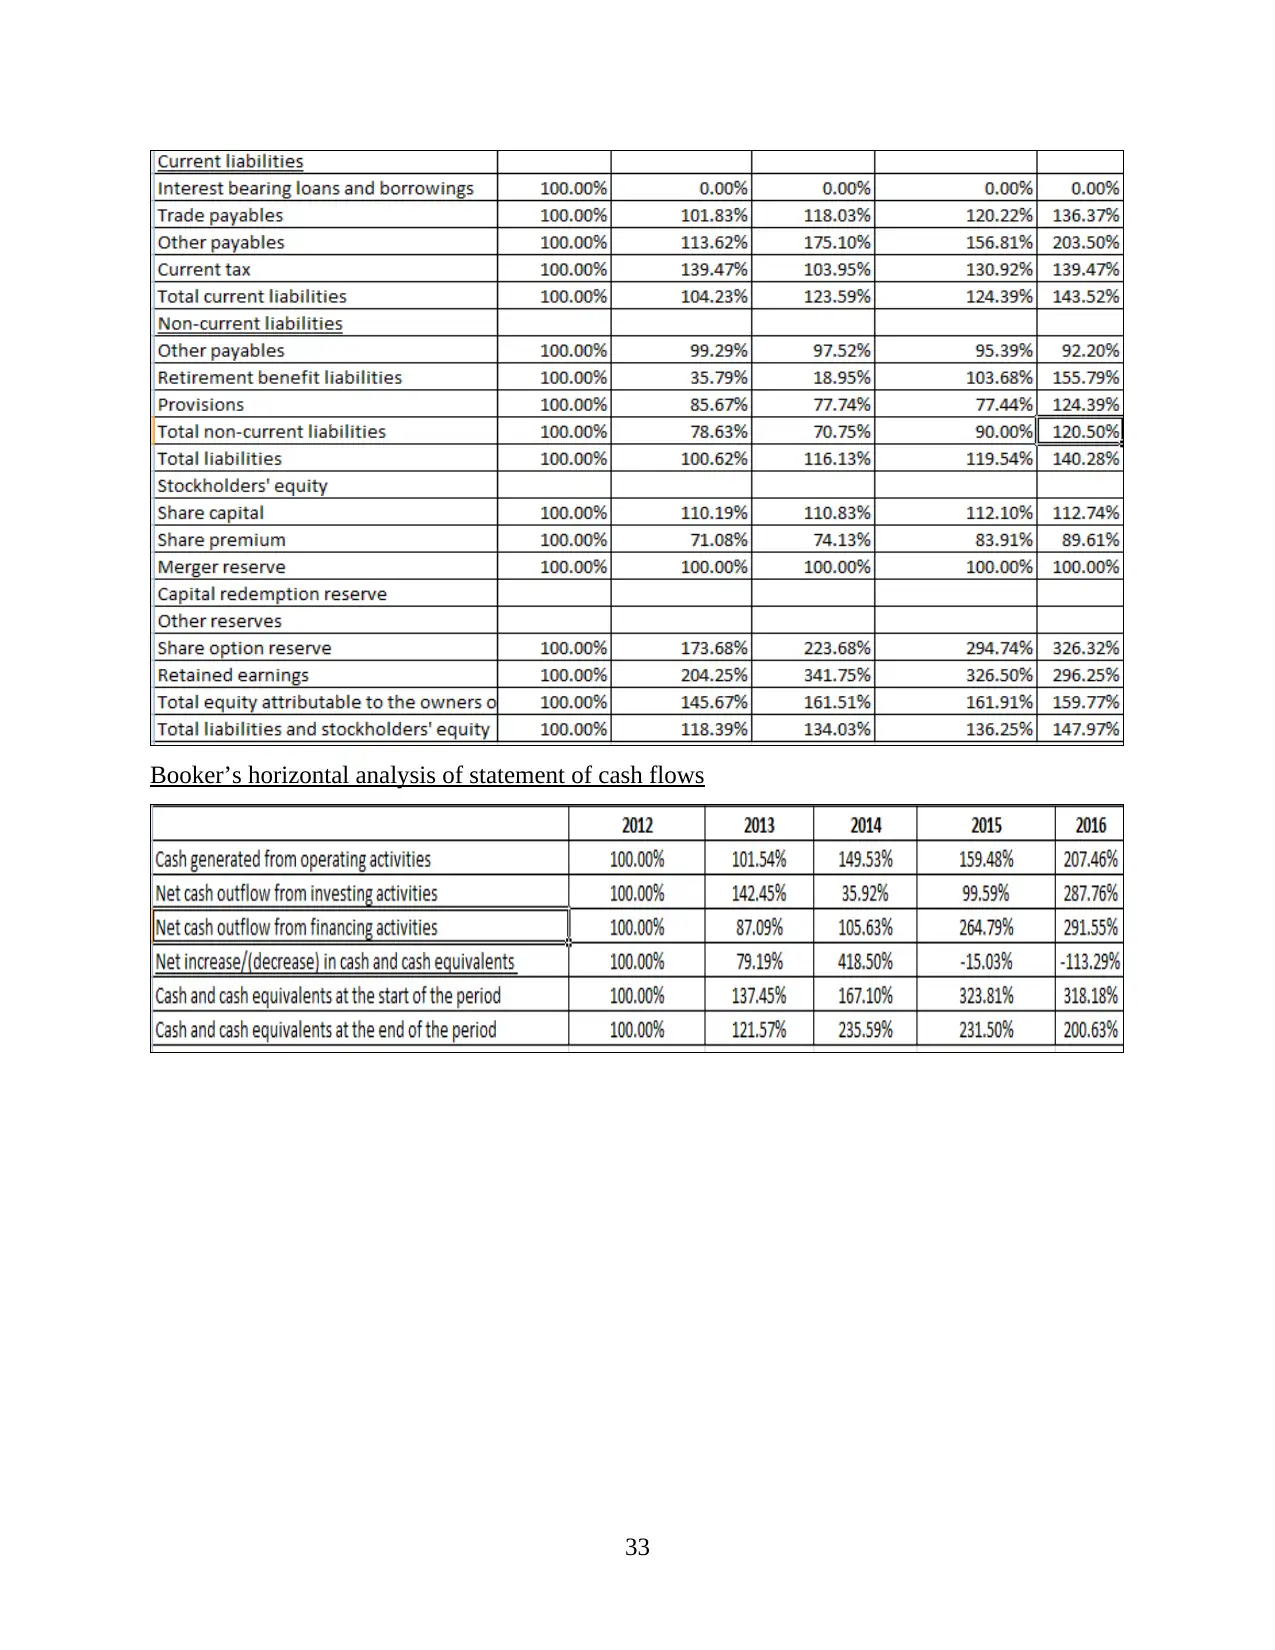
Booker’s horizontal analysis of balance sheet......................................................................32
Booker’s horizontal analysis of statement of cash flows.....................................................33
Wolseley’s vertical analysis of income statement................................................................25
Wolseley’s vertical analysis of balance sheet......................................................................25
Wolseley’s vertical analysis of cash flow statement............................................................27
Booker’s vertical analysis of income statement...................................................................27
Booker’s vertical analysis of balance sheet..........................................................................28
Booker’s vertical analysis of statement of cash flows..........................................................29
Wolseley’s horizontal analysis of statement of income statement.......................................30
Wolseley’s horizontal analysis of statement of balance sheet..............................................30
Wolseley’s horizontal analysis of statement of cash flows..................................................31
Booker’s horizontal analysis of income statement...............................................................31
Booker’s horizontal analysis of balance sheet......................................................................32
Booker’s horizontal analysis of statement of cash flows.....................................................33
INTRODUCTION
Strategic financial analysis and its importance
Strategic financial analysis (SFA) regards to the process of analyzing business financial
performance and thereby makes right decisions at the right time to drive success. There are
number of tools and techniques available to the entrepreneur such as ratio analysis, horizontal
and vertical analysis and many others. SFA is of utmost importance for the manager to determine
and assess their financial difficulties, so that, managers, directors and executives can make
qualitative decisions for accomplishing the defined targets and objectives.
Objectives
The report targeted at analysing the financial position and operational performance of two
existing companies, Wolseley and Booker. The report will make financial analysis of both the
companies by applying ratio analysis and horizontal as well as vertical analysis of all the
necessary financial accounts profitability statement, cash flow statement and balance sheet.
Moreover, it will also analyse the limitations of all the methods. Besides this, contemporary
techniques like Capital Assets pricing Model, Efficient Market Hypothesis and Economic Value
Added will be analysed that how these techniques can assist business to examine and evaluate
their success and operational excellence.
Overview of companies
Booker group is operating in food sector that offers variety of products and services to
buyers including grocers, restaurants and pub etc. Another organization is Wolseley deals in the
construction of buildings.
Methods of analysis
Ratio analysis will be used to determine relationship between various elements of
financial statement. However, horizontal analysis will be used to examine volatility trend over
the years whereas vertical analysis technique will be incorporated to determine the relationship
of each and every element from the revenues and total assets. Besides this, Du-pont model and
segmental reports will be prepared for in-depth analysis of business performance.
RATIO ANALYSIS
Ratio analysis may be defined as a tool which helps in analyzing the financial statements
of the business organization in an effectual way. By this, financial health, performance and
position of the firm can be measured in against to the competitor. Besides this, by evaluating the
1
Secure Best Marks with AI Grader
Need help grading? Try our AI Grader for instant feedback on your assignments.
own performance in against to the competitors business unit can take suitable decision for the
improvement purposs (Xu and et.al., 2014). The ratio analysis includes different types of ratios
by which analyser can interpret about the financial position of company. The different ratios are
such as Profitability, liquidity, efficiency, solvency, gearing etc.
Profitability Ratios
Profitability ratios: This ratio helps in analyzing the profit margin generated by the firm
during the time frame over the expenses (Boer 2011). Hence, by making analysis of such ratio
business unit can take significant action or measure for enhancing the profit level.
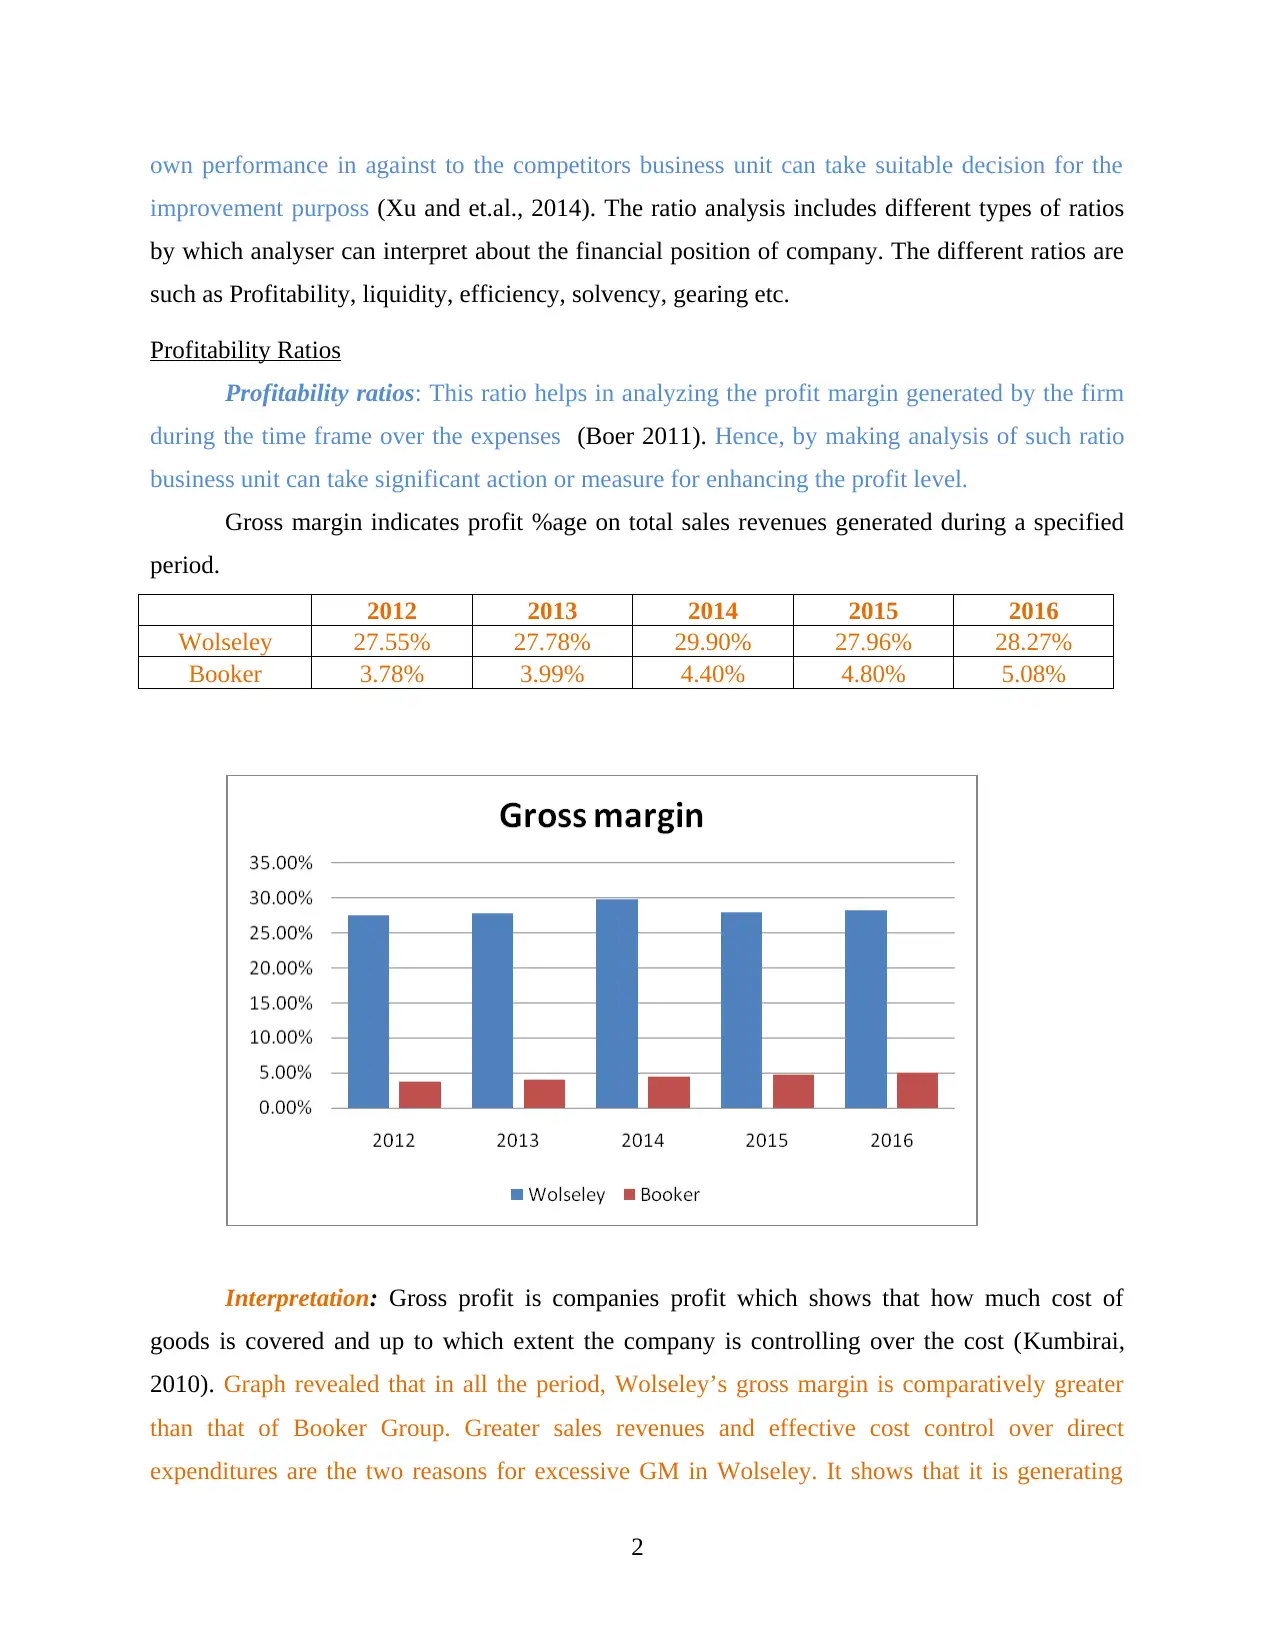
Gross margin indicates profit %age on total sales revenues generated during a specified
period.
2012 2013 2014 2015 2016
Wolseley 27.55% 27.78% 29.90% 27.96% 28.27%
Booker 3.78% 3.99% 4.40% 4.80% 5.08%
Interpretation: Gross profit is companies profit which shows that how much cost of
goods is covered and up to which extent the company is controlling over the cost (Kumbirai,
2010). Graph revealed that in all the period, Wolseley’s gross margin is comparatively greater
than that of Booker Group. Greater sales revenues and effective cost control over direct
expenditures are the two reasons for excessive GM in Wolseley. It shows that it is generating
2
improvement purposs (Xu and et.al., 2014). The ratio analysis includes different types of ratios
by which analyser can interpret about the financial position of company. The different ratios are
such as Profitability, liquidity, efficiency, solvency, gearing etc.
Profitability Ratios
Profitability ratios: This ratio helps in analyzing the profit margin generated by the firm
during the time frame over the expenses (Boer 2011). Hence, by making analysis of such ratio
business unit can take significant action or measure for enhancing the profit level.
Gross margin indicates profit %age on total sales revenues generated during a specified
period.
2012 2013 2014 2015 2016
Wolseley 27.55% 27.78% 29.90% 27.96% 28.27%
Booker 3.78% 3.99% 4.40% 4.80% 5.08%
Interpretation: Gross profit is companies profit which shows that how much cost of
goods is covered and up to which extent the company is controlling over the cost (Kumbirai,
2010). Graph revealed that in all the period, Wolseley’s gross margin is comparatively greater
than that of Booker Group. Greater sales revenues and effective cost control over direct
expenditures are the two reasons for excessive GM in Wolseley. It shows that it is generating
2
enough return on their turnover and performing excellent than Booker. In the year 2016,
Wolseley’s GM is 28.27% whilst in case of Booker, it is only 5.08% represent that first company
is performing better as it is generating higher return through adding a mark-up on cost of sale.
Thus, business unit needs to make effort in relation to enhancing the sales level through the
means of advertisement.
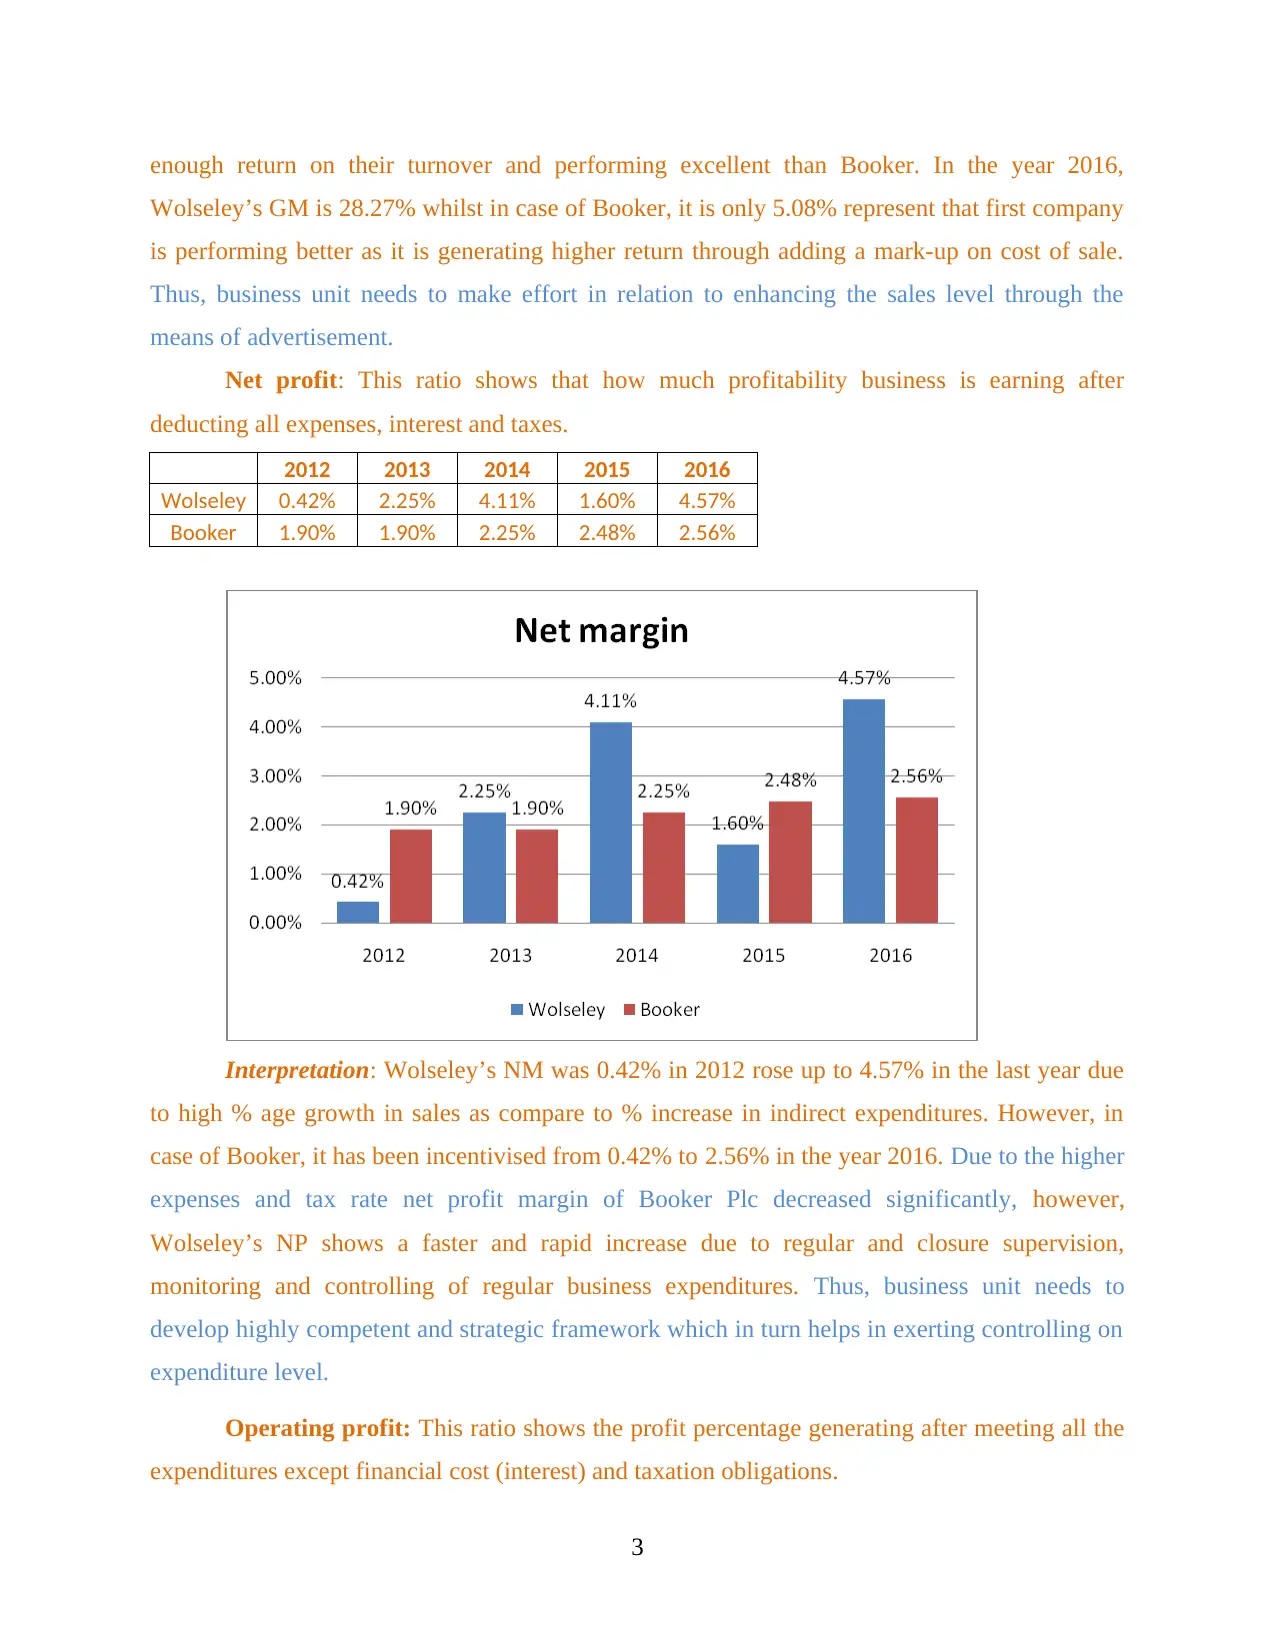
Net profit: This ratio shows that how much profitability business is earning after
deducting all expenses, interest and taxes.
2012 2013 2014 2015 2016
Wolseley 0.42% 2.25% 4.11% 1.60% 4.57%
Booker 1.90% 1.90% 2.25% 2.48% 2.56%
Interpretation: Wolseley’s NM was 0.42% in 2012 rose up to 4.57% in the last year due
to high % age growth in sales as compare to % increase in indirect expenditures. However, in
case of Booker, it has been incentivised from 0.42% to 2.56% in the year 2016. Due to the higher
expenses and tax rate net profit margin of Booker Plc decreased significantly, however,
Wolseley’s NP shows a faster and rapid increase due to regular and closure supervision,
monitoring and controlling of regular business expenditures. Thus, business unit needs to
develop highly competent and strategic framework which in turn helps in exerting controlling on
expenditure level.
Operating profit: This ratio shows the profit percentage generating after meeting all the
expenditures except financial cost (interest) and taxation obligations.
3
Wolseley’s GM is 28.27% whilst in case of Booker, it is only 5.08% represent that first company
is performing better as it is generating higher return through adding a mark-up on cost of sale.
Thus, business unit needs to make effort in relation to enhancing the sales level through the
means of advertisement.
Net profit: This ratio shows that how much profitability business is earning after
deducting all expenses, interest and taxes.
2012 2013 2014 2015 2016
Wolseley 0.42% 2.25% 4.11% 1.60% 4.57%
Booker 1.90% 1.90% 2.25% 2.48% 2.56%
Interpretation: Wolseley’s NM was 0.42% in 2012 rose up to 4.57% in the last year due
to high % age growth in sales as compare to % increase in indirect expenditures. However, in
case of Booker, it has been incentivised from 0.42% to 2.56% in the year 2016. Due to the higher
expenses and tax rate net profit margin of Booker Plc decreased significantly, however,
Wolseley’s NP shows a faster and rapid increase due to regular and closure supervision,
monitoring and controlling of regular business expenditures. Thus, business unit needs to
develop highly competent and strategic framework which in turn helps in exerting controlling on
expenditure level.
Operating profit: This ratio shows the profit percentage generating after meeting all the
expenditures except financial cost (interest) and taxation obligations.
3
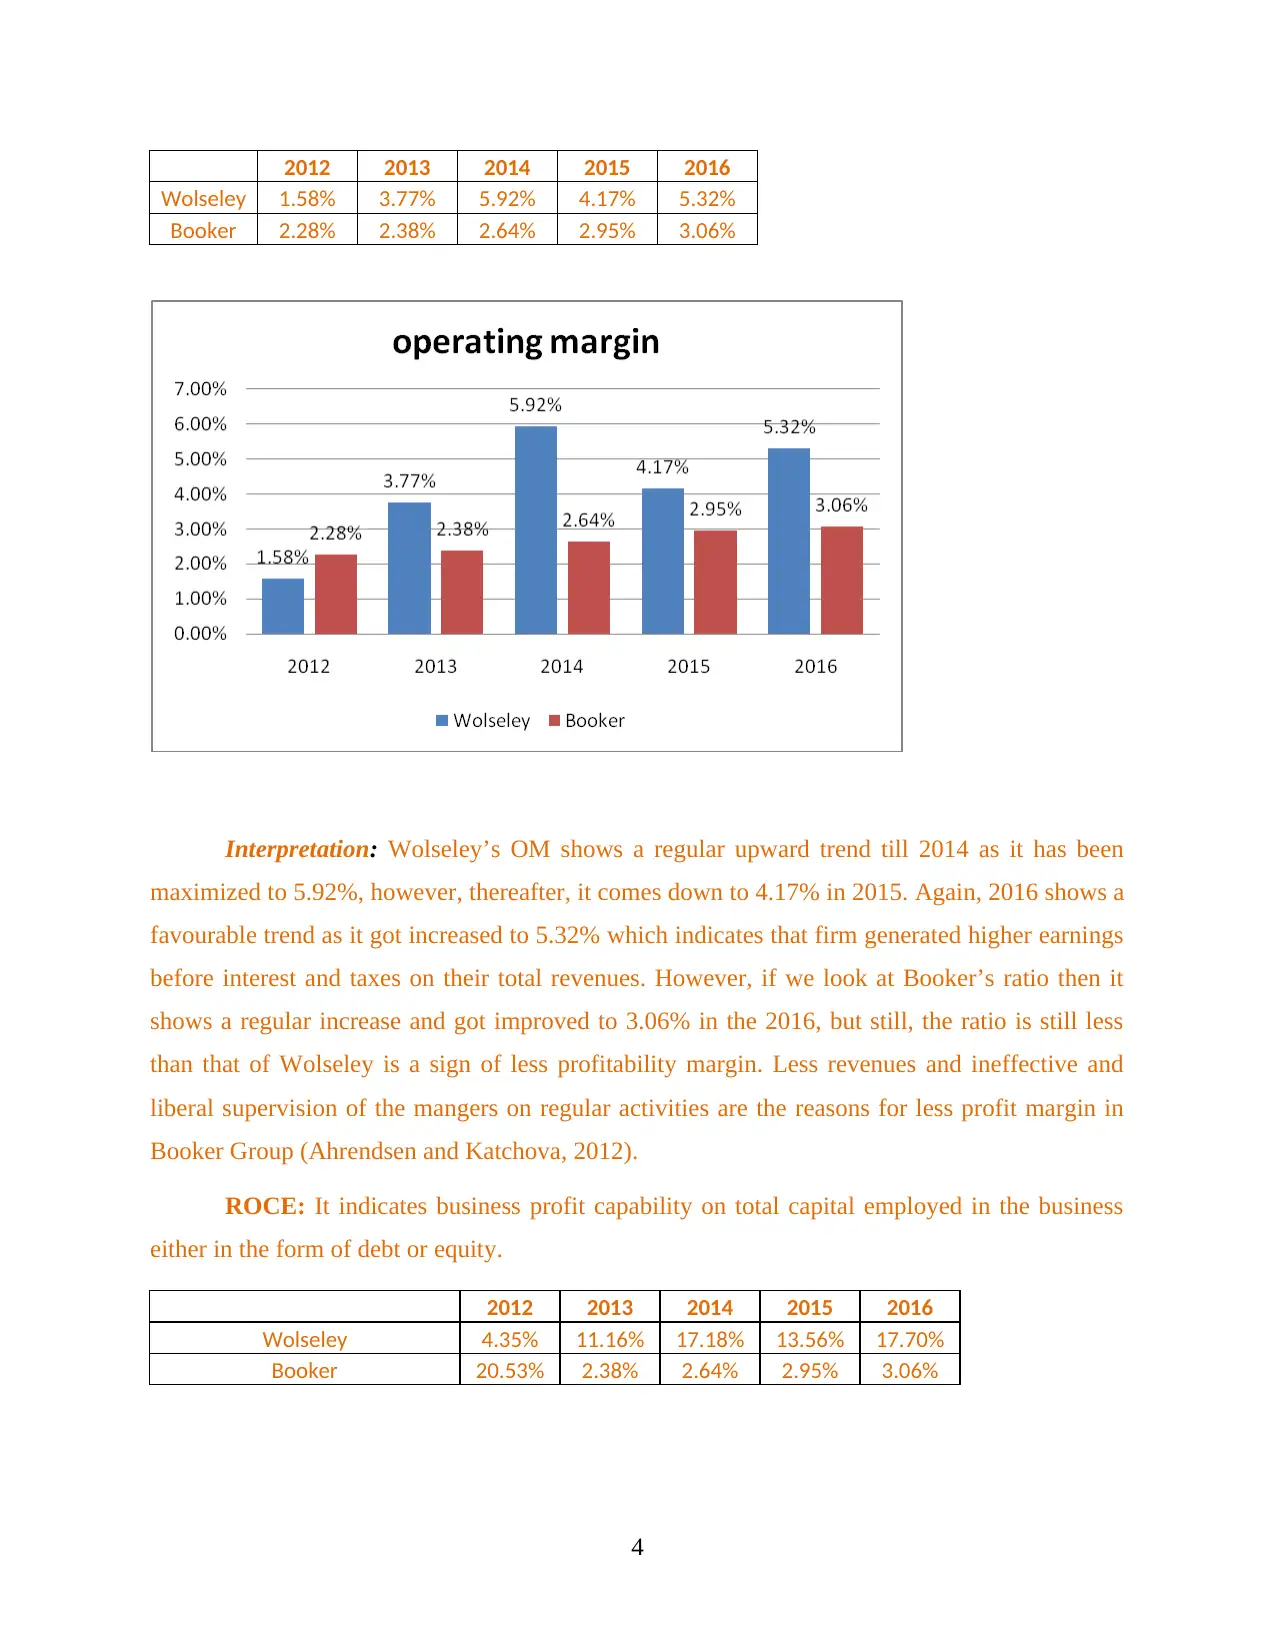
2012 2013 2014 2015 2016
Wolseley 1.58% 3.77% 5.92% 4.17% 5.32%
Booker 2.28% 2.38% 2.64% 2.95% 3.06%
Interpretation: Wolseley’s OM shows a regular upward trend till 2014 as it has been
maximized to 5.92%, however, thereafter, it comes down to 4.17% in 2015. Again, 2016 shows a
favourable trend as it got increased to 5.32% which indicates that firm generated higher earnings
before interest and taxes on their total revenues. However, if we look at Booker’s ratio then it
shows a regular increase and got improved to 3.06% in the 2016, but still, the ratio is still less
than that of Wolseley is a sign of less profitability margin. Less revenues and ineffective and
liberal supervision of the mangers on regular activities are the reasons for less profit margin in
Booker Group (Ahrendsen and Katchova, 2012).
ROCE: It indicates business profit capability on total capital employed in the business
either in the form of debt or equity.
2012 2013 2014 2015 2016
Wolseley 4.35% 11.16% 17.18% 13.56% 17.70%
Booker 20.53% 2.38% 2.64% 2.95% 3.06%
4
Paraphrase This Document
Need a fresh take? Get an instant paraphrase of this document with our AI Paraphraser
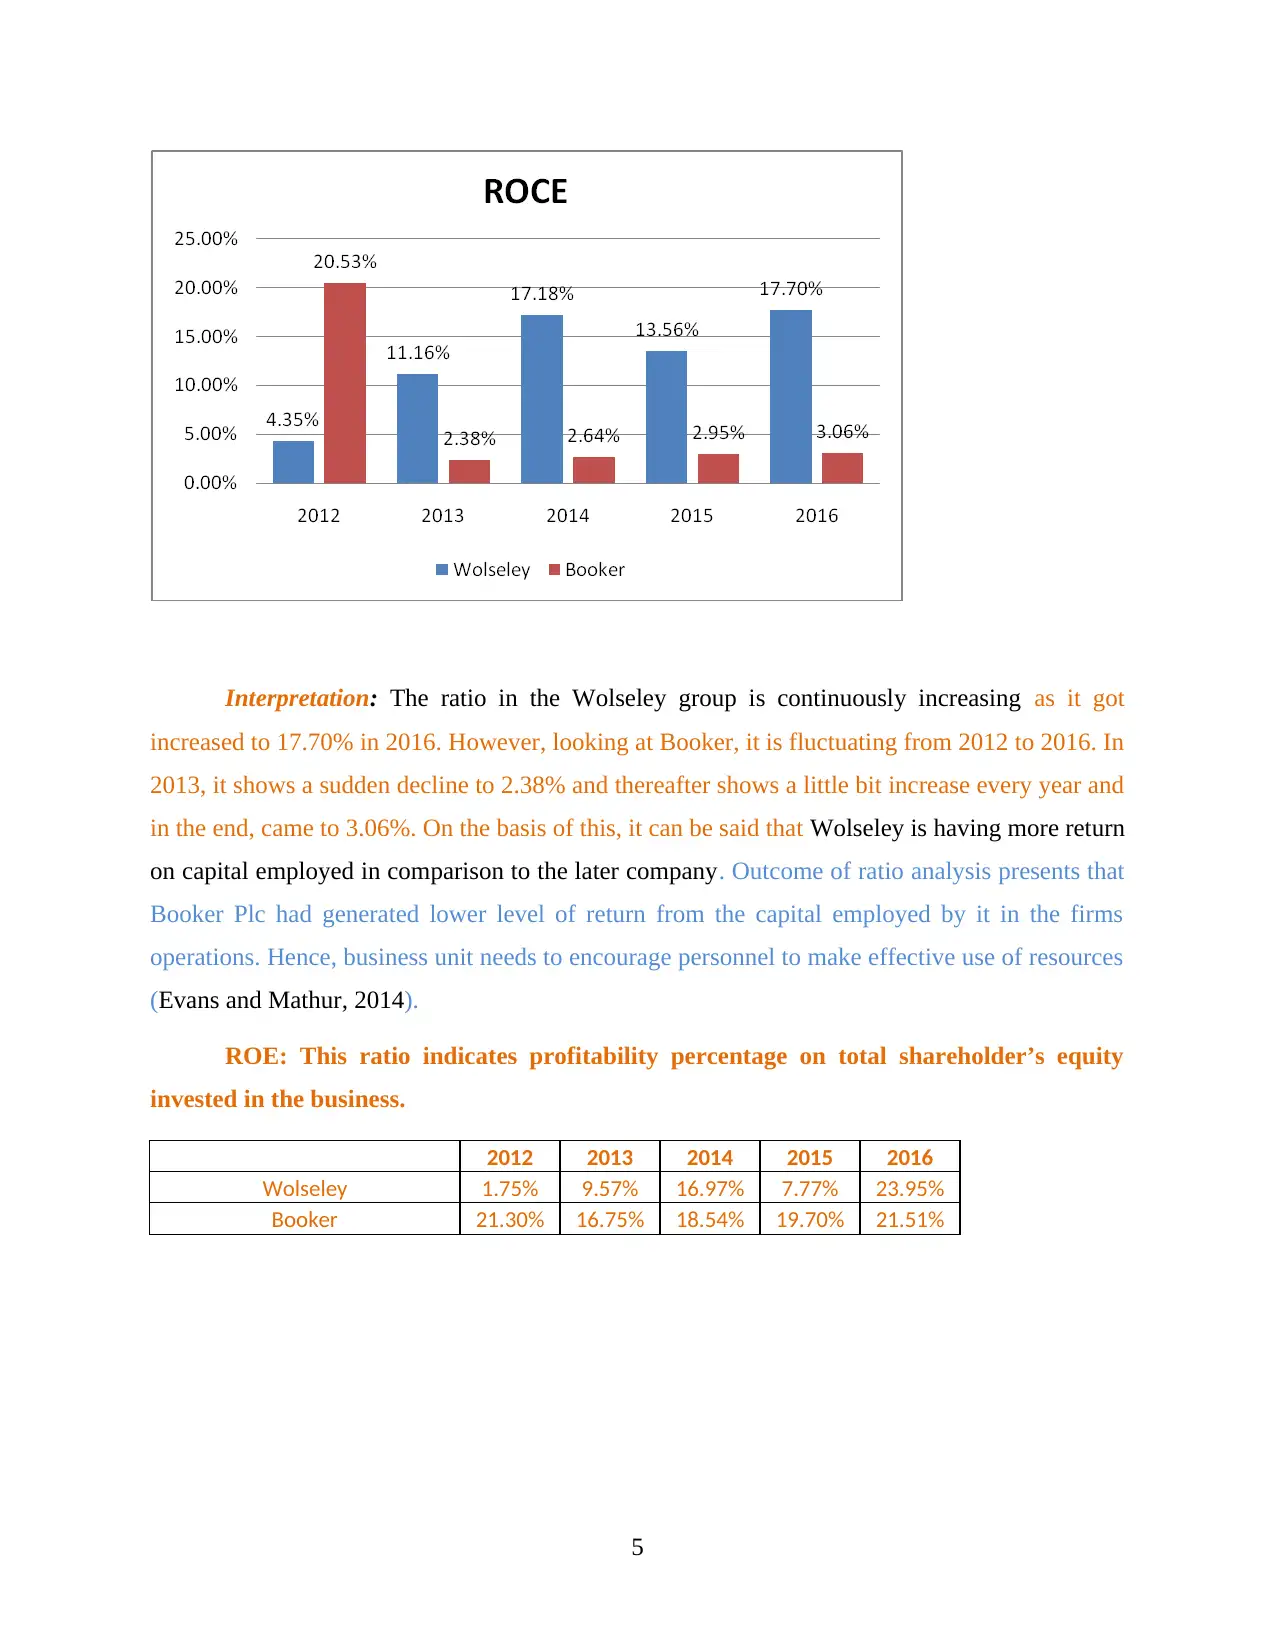
Interpretation: The ratio in the Wolseley group is continuously increasing as it got
increased to 17.70% in 2016. However, looking at Booker, it is fluctuating from 2012 to 2016. In
2013, it shows a sudden decline to 2.38% and thereafter shows a little bit increase every year and
in the end, came to 3.06%. On the basis of this, it can be said that Wolseley is having more return
on capital employed in comparison to the later company. Outcome of ratio analysis presents that
Booker Plc had generated lower level of return from the capital employed by it in the firms
operations. Hence, business unit needs to encourage personnel to make effective use of resources
(Evans and Mathur, 2014).
ROE: This ratio indicates profitability percentage on total shareholder’s equity
invested in the business.
2012 2013 2014 2015 2016
Wolseley 1.75% 9.57% 16.97% 7.77% 23.95%
Booker 21.30% 16.75% 18.54% 19.70% 21.51%
5
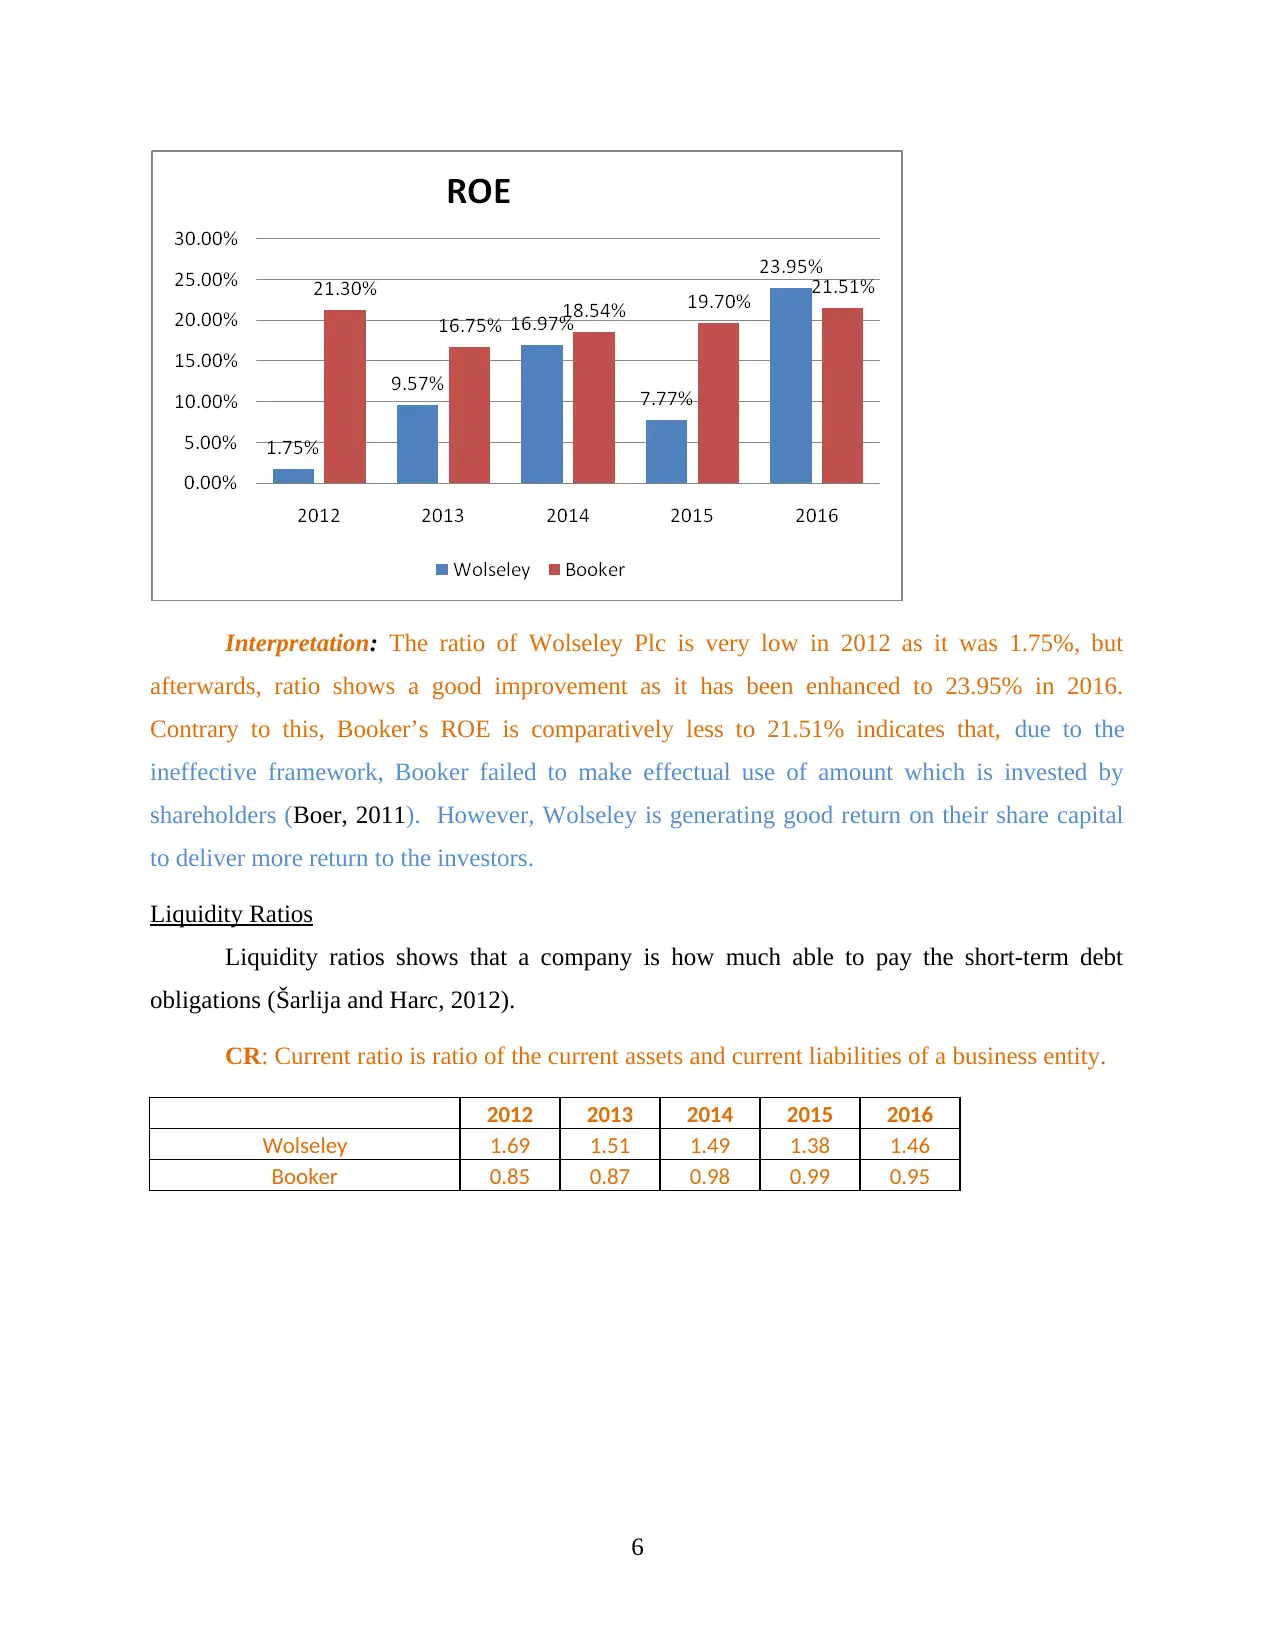
Interpretation: The ratio of Wolseley Plc is very low in 2012 as it was 1.75%, but
afterwards, ratio shows a good improvement as it has been enhanced to 23.95% in 2016.
Contrary to this, Booker’s ROE is comparatively less to 21.51% indicates that, due to the
ineffective framework, Booker failed to make effectual use of amount which is invested by
shareholders (Boer, 2011). However, Wolseley is generating good return on their share capital
to deliver more return to the investors.
Liquidity Ratios
Liquidity ratios shows that a company is how much able to pay the short-term debt
obligations (Šarlija and Harc, 2012).
CR: Current ratio is ratio of the current assets and current liabilities of a business entity.
2012 2013 2014 2015 2016
Wolseley 1.69 1.51 1.49 1.38 1.46
Booker 0.85 0.87 0.98 0.99 0.95
6
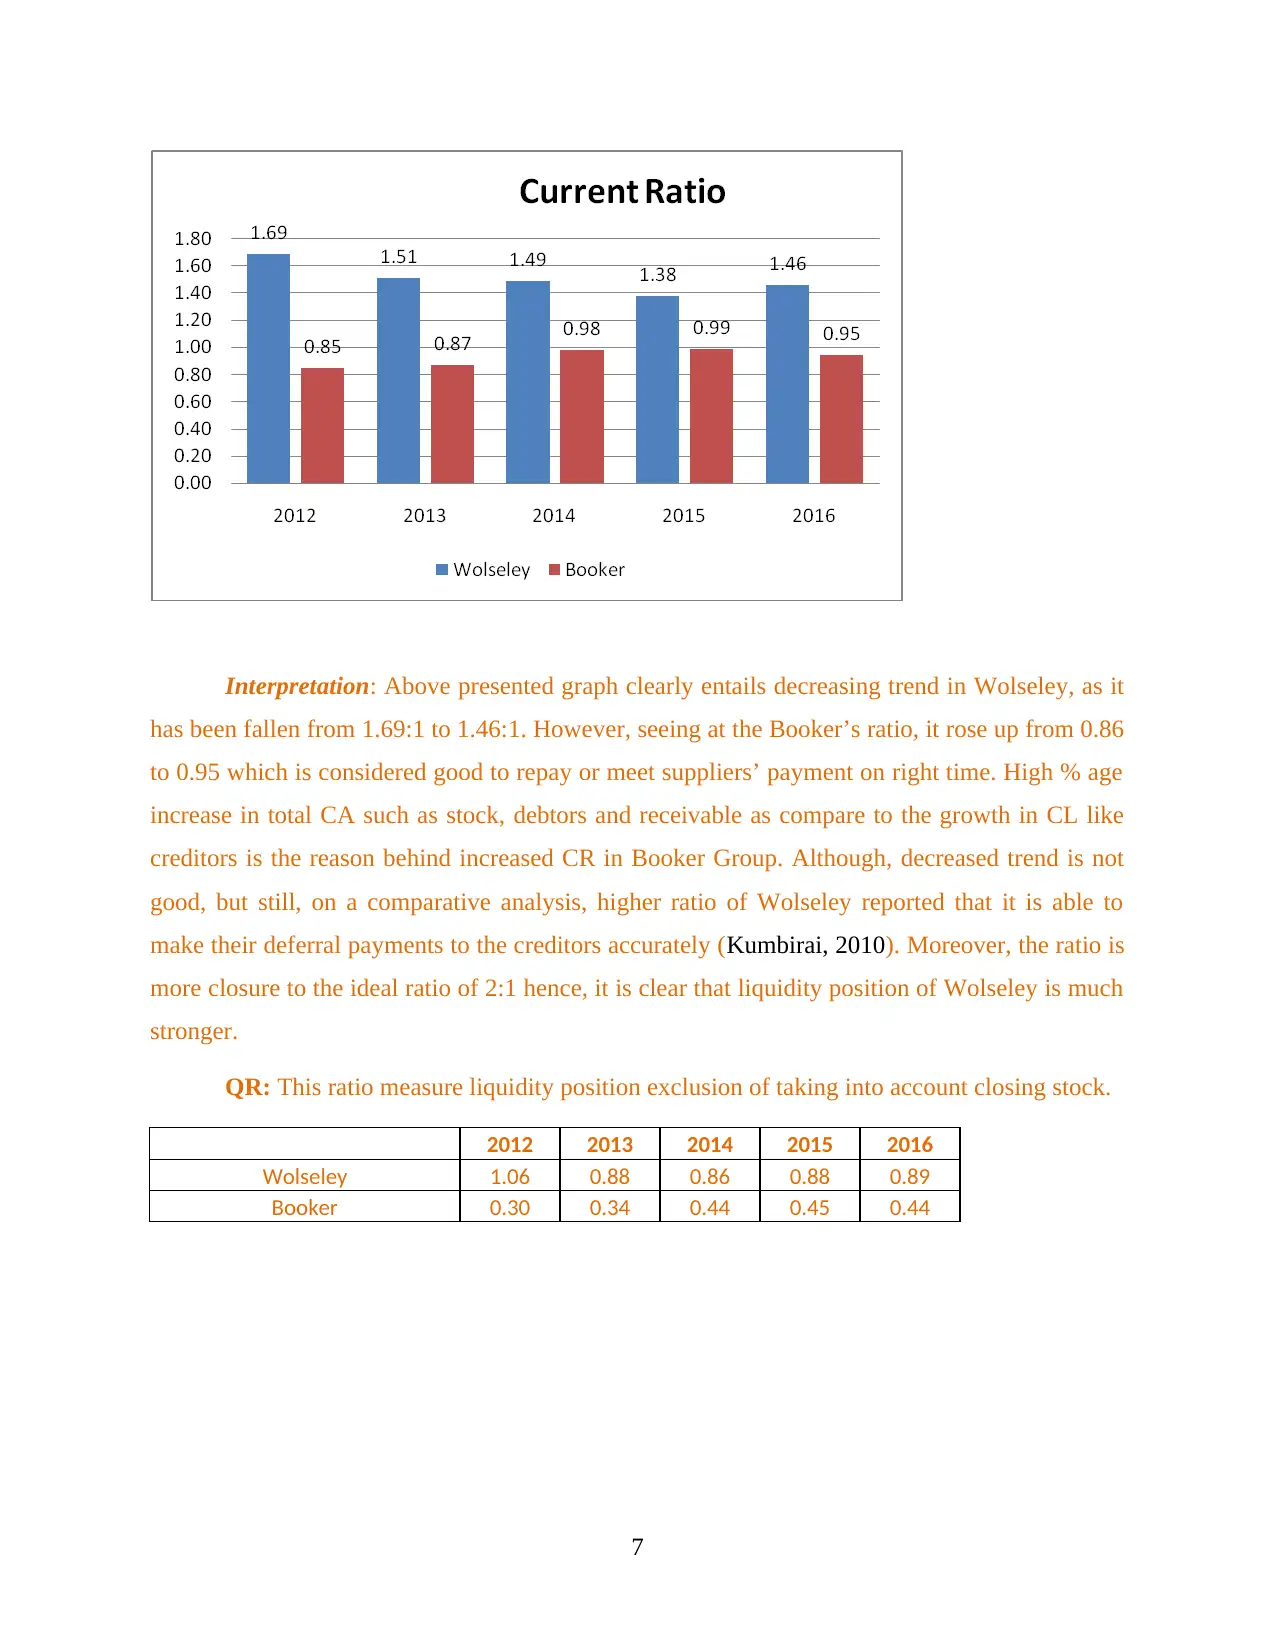
Interpretation: Above presented graph clearly entails decreasing trend in Wolseley, as it
has been fallen from 1.69:1 to 1.46:1. However, seeing at the Booker’s ratio, it rose up from 0.86
to 0.95 which is considered good to repay or meet suppliers’ payment on right time. High % age
increase in total CA such as stock, debtors and receivable as compare to the growth in CL like
creditors is the reason behind increased CR in Booker Group. Although, decreased trend is not
good, but still, on a comparative analysis, higher ratio of Wolseley reported that it is able to
make their deferral payments to the creditors accurately (Kumbirai, 2010). Moreover, the ratio is
more closure to the ideal ratio of 2:1 hence, it is clear that liquidity position of Wolseley is much
stronger.
QR: This ratio measure liquidity position exclusion of taking into account closing stock.
2012 2013 2014 2015 2016
Wolseley 1.06 0.88 0.86 0.88 0.89
Booker 0.30 0.34 0.44 0.45 0.44
7
Secure Best Marks with AI Grader
Need help grading? Try our AI Grader for instant feedback on your assignments.
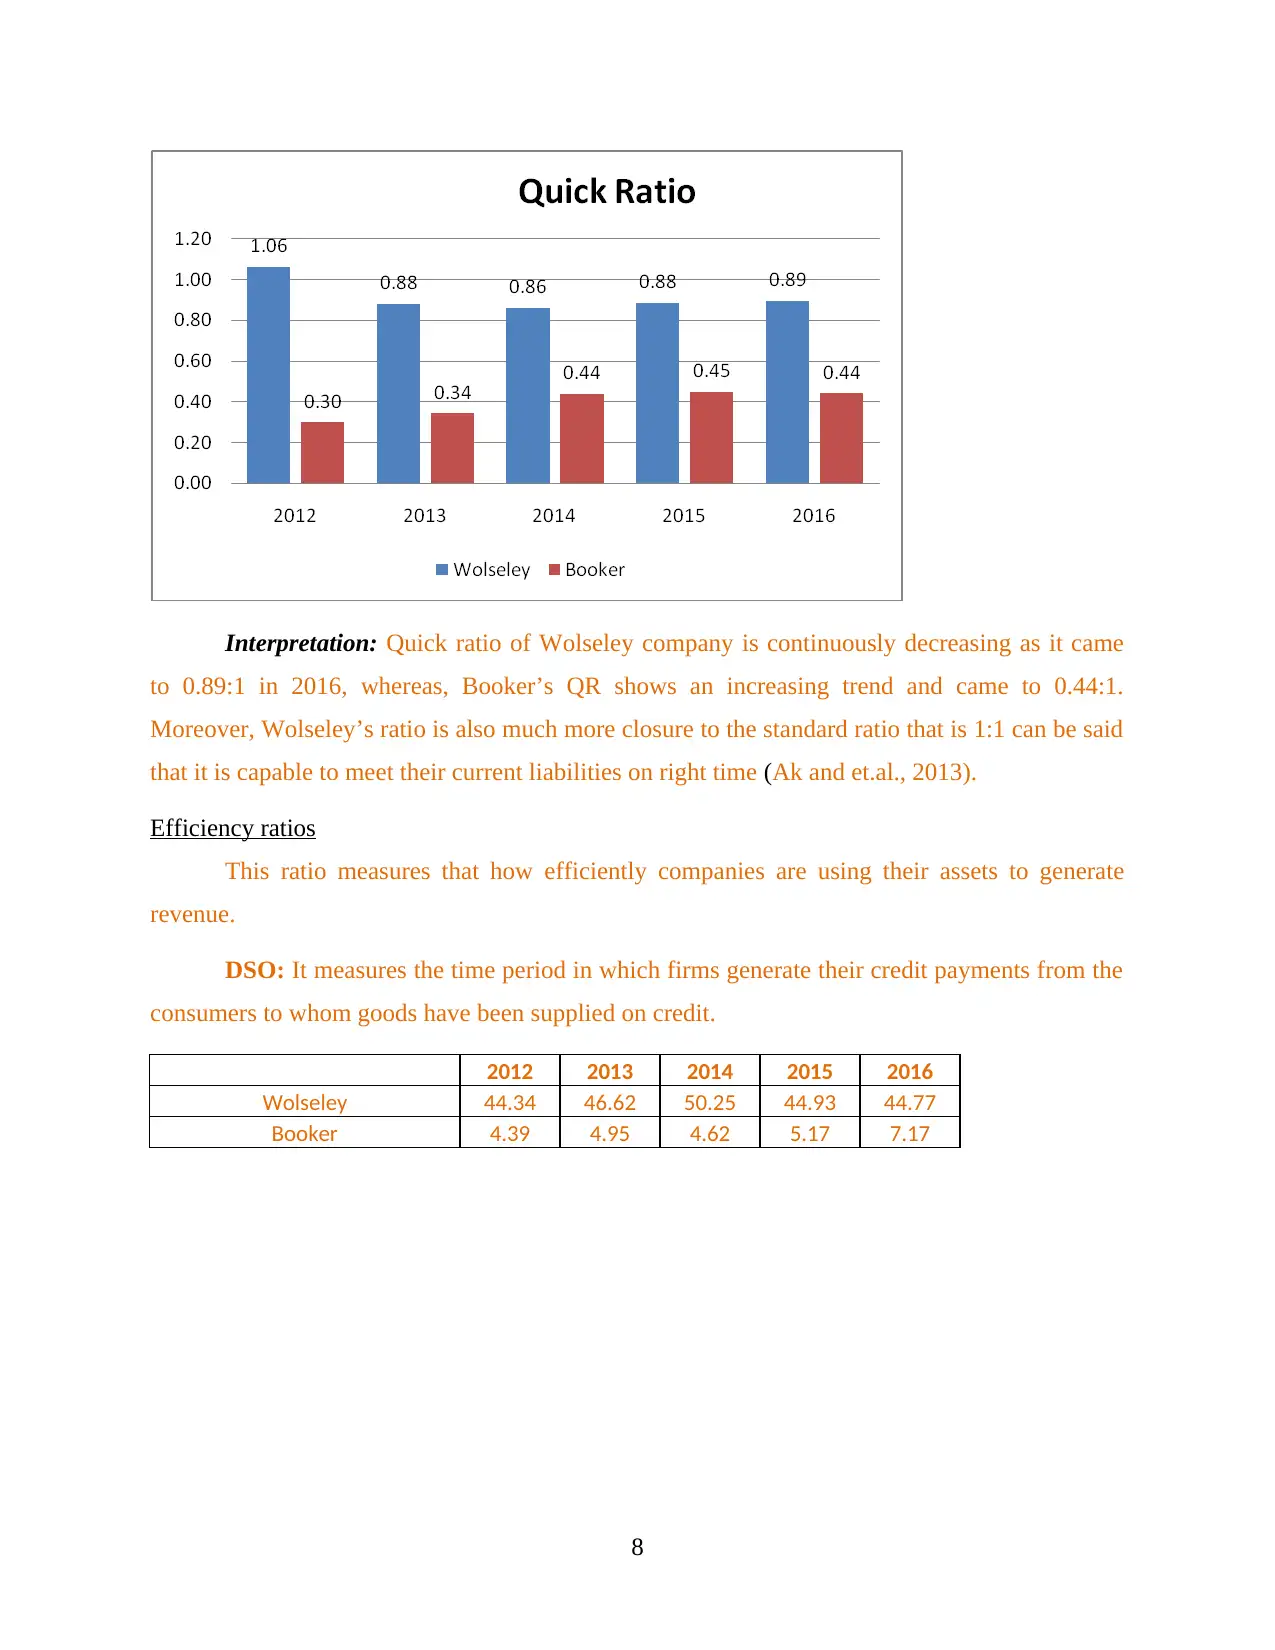
Interpretation: Quick ratio of Wolseley company is continuously decreasing as it came
to 0.89:1 in 2016, whereas, Booker’s QR shows an increasing trend and came to 0.44:1.
Moreover, Wolseley’s ratio is also much more closure to the standard ratio that is 1:1 can be said
that it is capable to meet their current liabilities on right time (Ak and et.al., 2013).
Efficiency ratios
This ratio measures that how efficiently companies are using their assets to generate
revenue.
DSO: It measures the time period in which firms generate their credit payments from the
consumers to whom goods have been supplied on credit.
2012 2013 2014 2015 2016
Wolseley 44.34 46.62 50.25 44.93 44.77
Booker 4.39 4.95 4.62 5.17 7.17
8
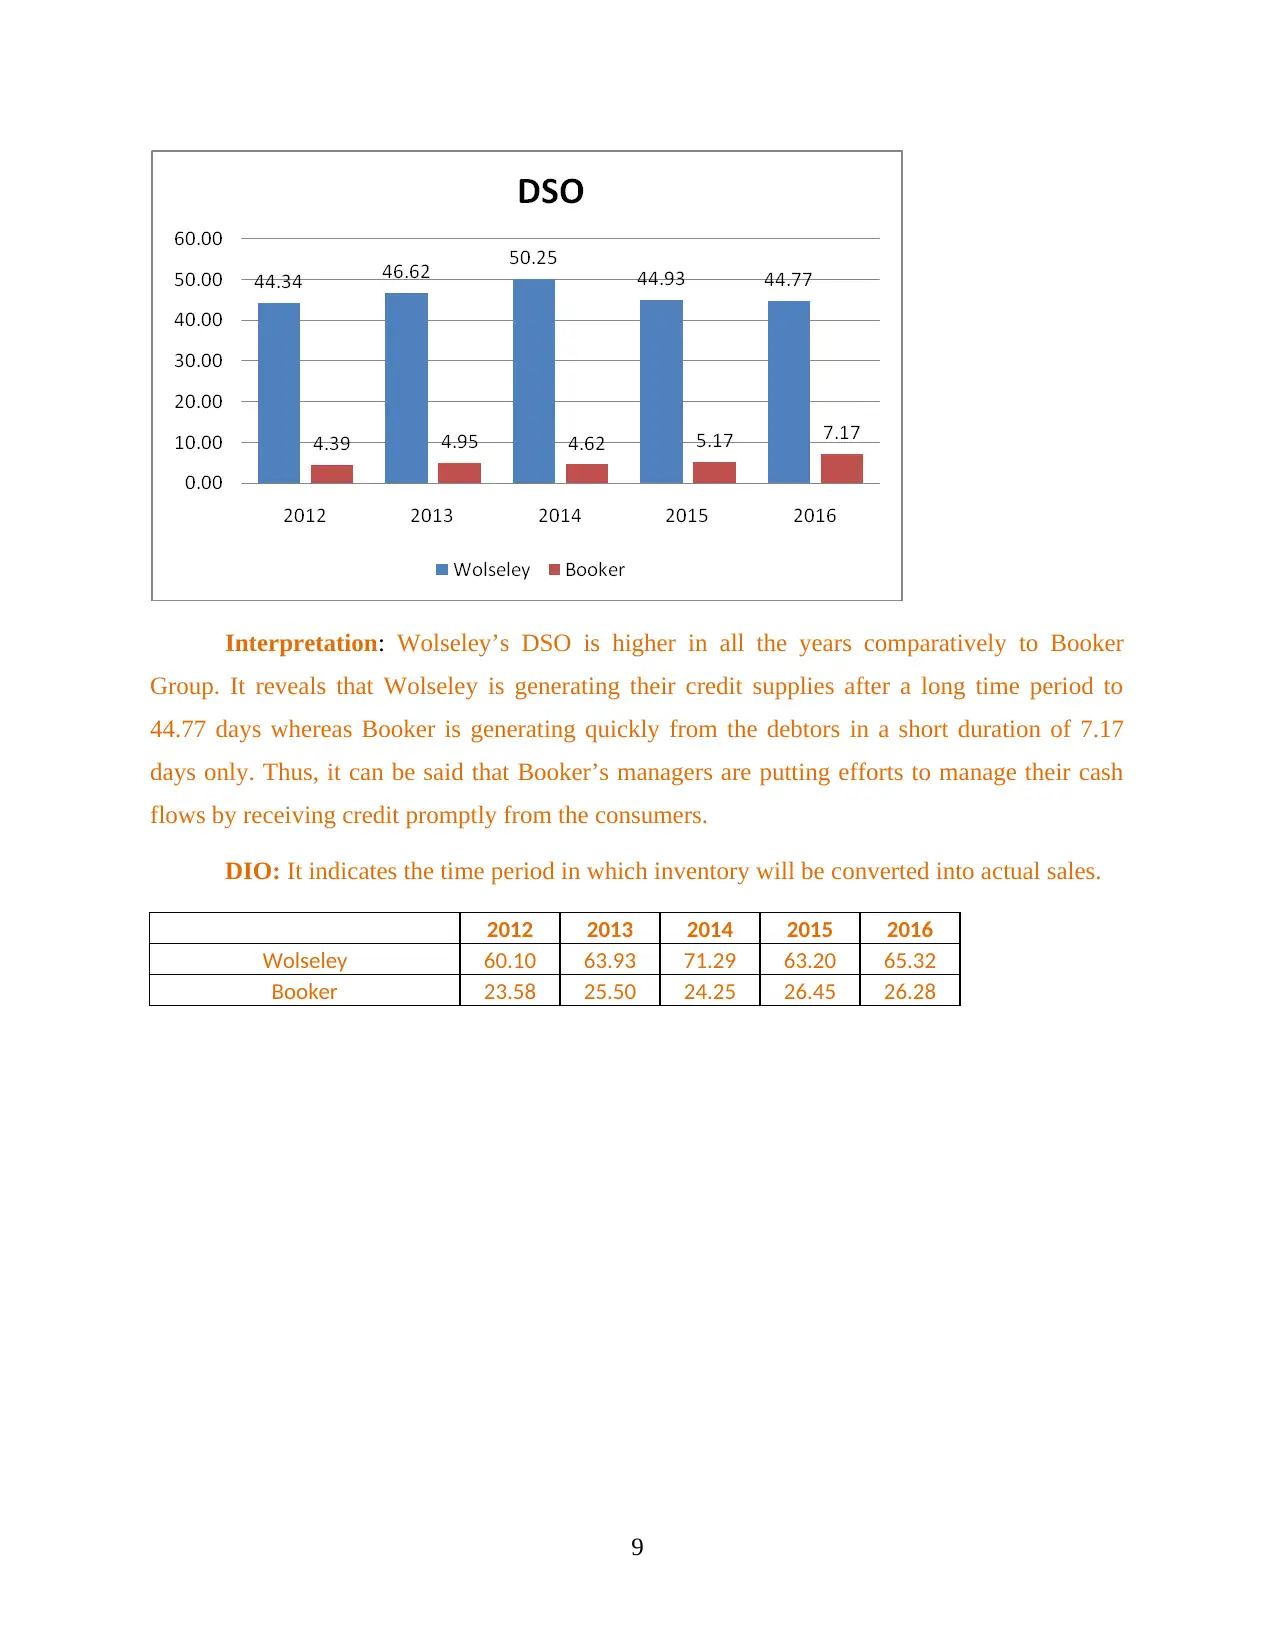
Interpretation: Wolseley’s DSO is higher in all the years comparatively to Booker
Group. It reveals that Wolseley is generating their credit supplies after a long time period to
44.77 days whereas Booker is generating quickly from the debtors in a short duration of 7.17
days only. Thus, it can be said that Booker’s managers are putting efforts to manage their cash
flows by receiving credit promptly from the consumers.
DIO: It indicates the time period in which inventory will be converted into actual sales.
2012 2013 2014 2015 2016
Wolseley 60.10 63.93 71.29 63.20 65.32
Booker 23.58 25.50 24.25 26.45 26.28
9
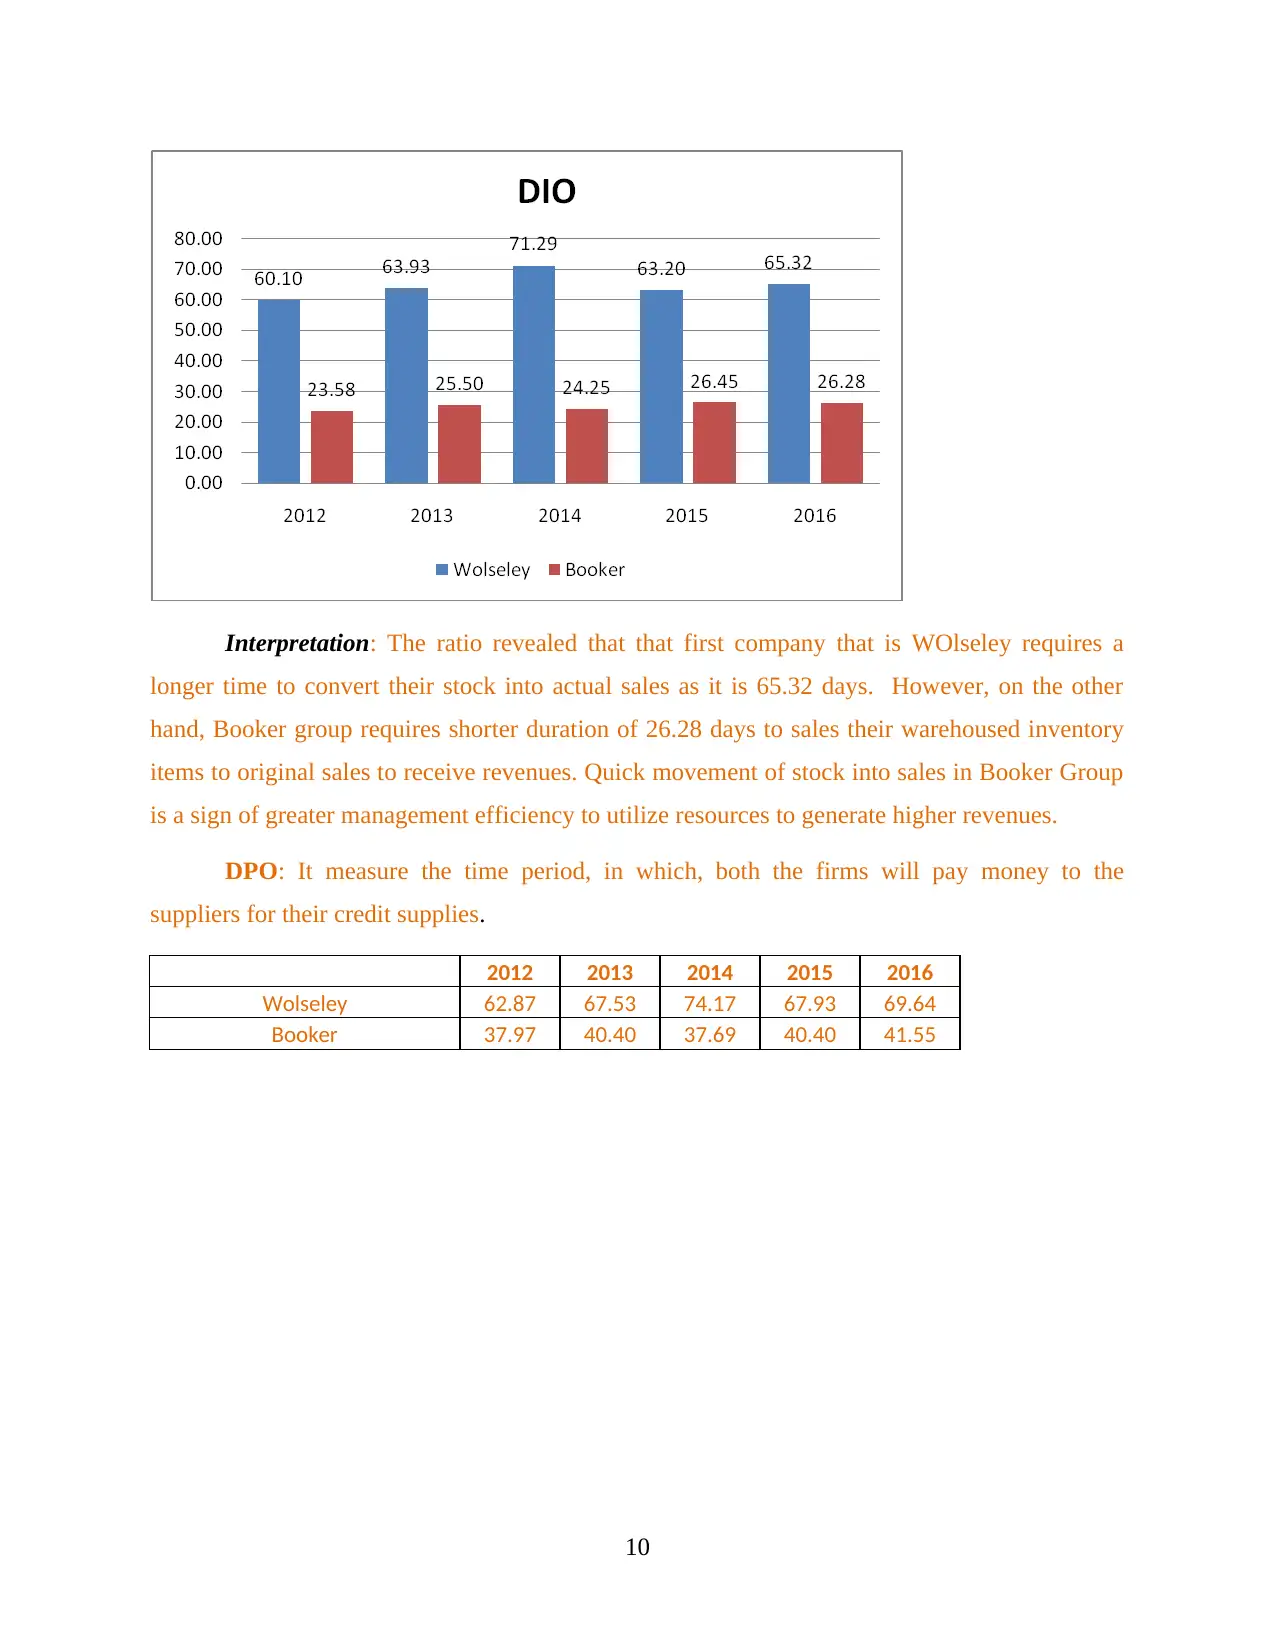
Interpretation: The ratio revealed that that first company that is WOlseley requires a
longer time to convert their stock into actual sales as it is 65.32 days. However, on the other
hand, Booker group requires shorter duration of 26.28 days to sales their warehoused inventory
items to original sales to receive revenues. Quick movement of stock into sales in Booker Group
is a sign of greater management efficiency to utilize resources to generate higher revenues.
DPO: It measure the time period, in which, both the firms will pay money to the
suppliers for their credit supplies.
2012 2013 2014 2015 2016
Wolseley 62.87 67.53 74.17 67.93 69.64
Booker 37.97 40.40 37.69 40.40 41.55
10
Paraphrase This Document
Need a fresh take? Get an instant paraphrase of this document with our AI Paraphraser
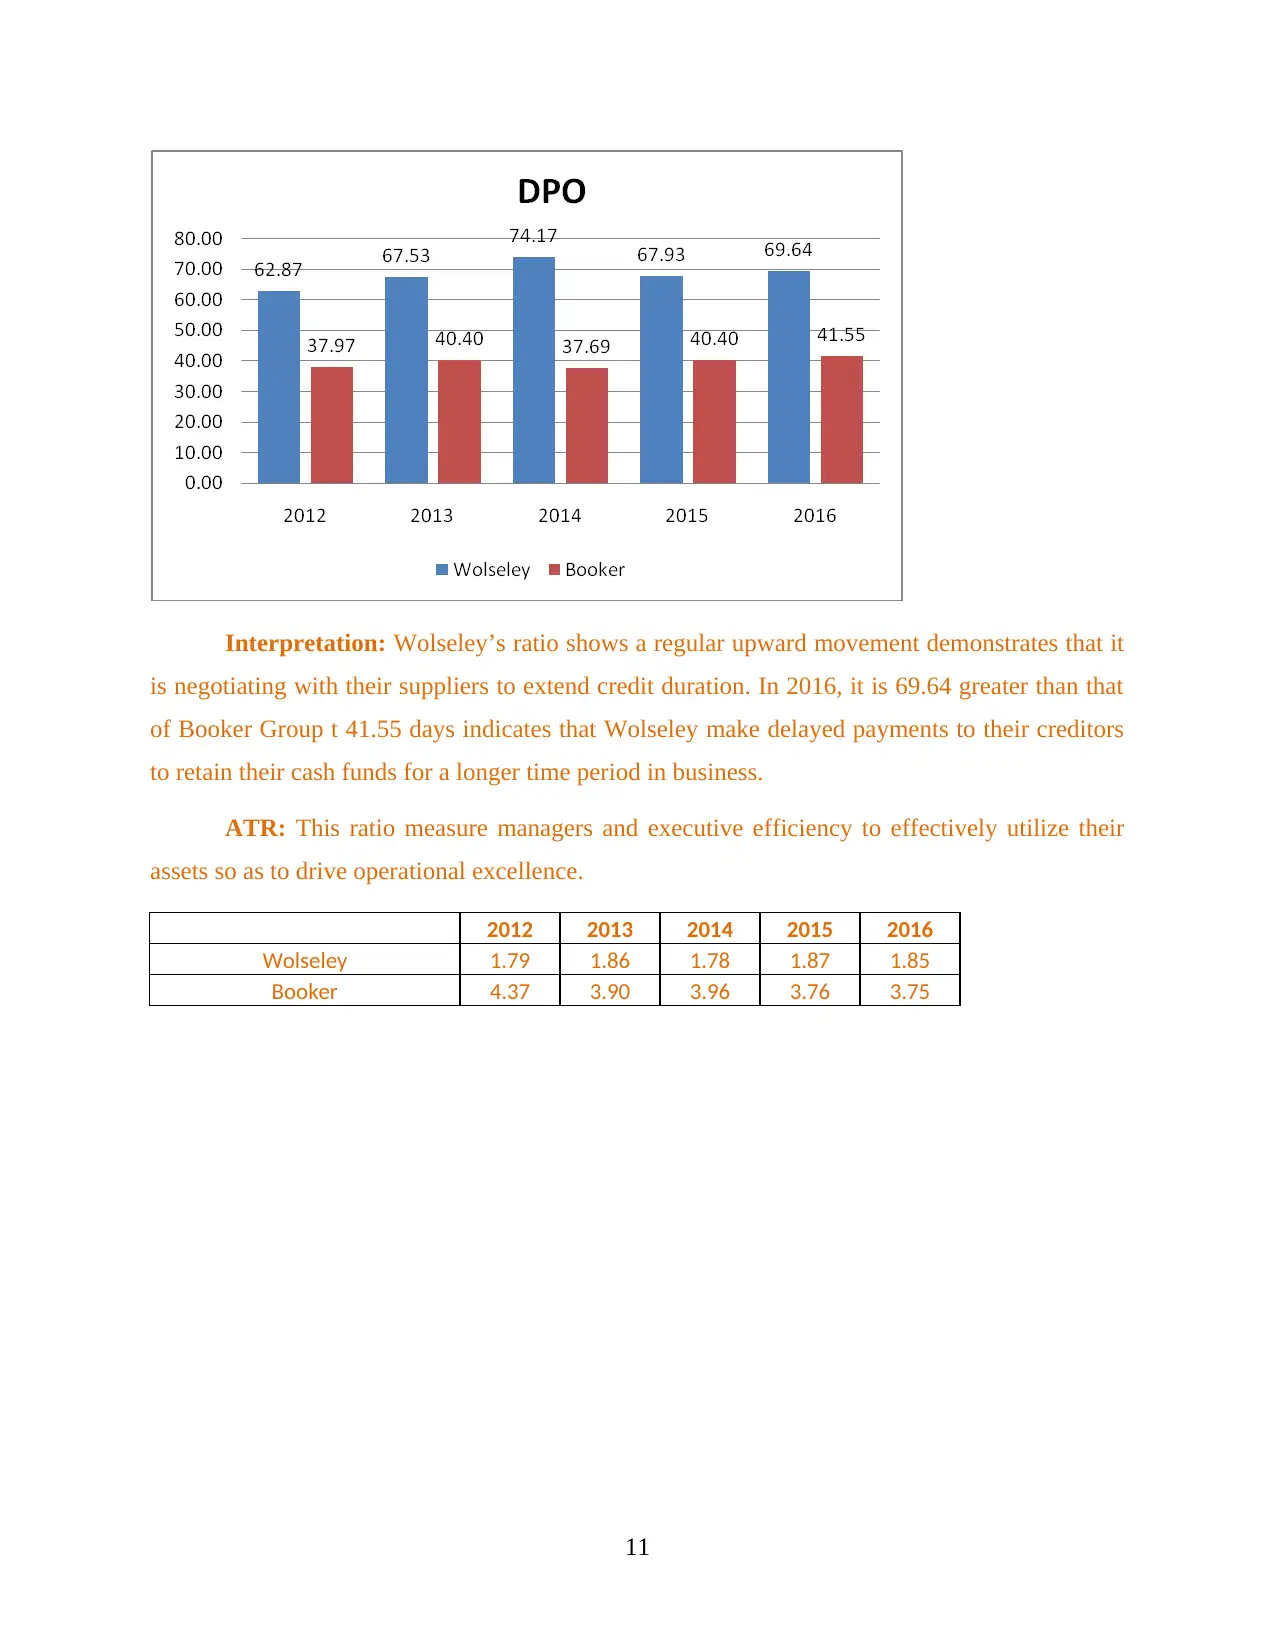
Interpretation: Wolseley’s ratio shows a regular upward movement demonstrates that it
is negotiating with their suppliers to extend credit duration. In 2016, it is 69.64 greater than that
of Booker Group t 41.55 days indicates that Wolseley make delayed payments to their creditors
to retain their cash funds for a longer time period in business.
ATR: This ratio measure managers and executive efficiency to effectively utilize their
assets so as to drive operational excellence.
2012 2013 2014 2015 2016
Wolseley 1.79 1.86 1.78 1.87 1.85
Booker 4.37 3.90 3.96 3.76 3.75
11
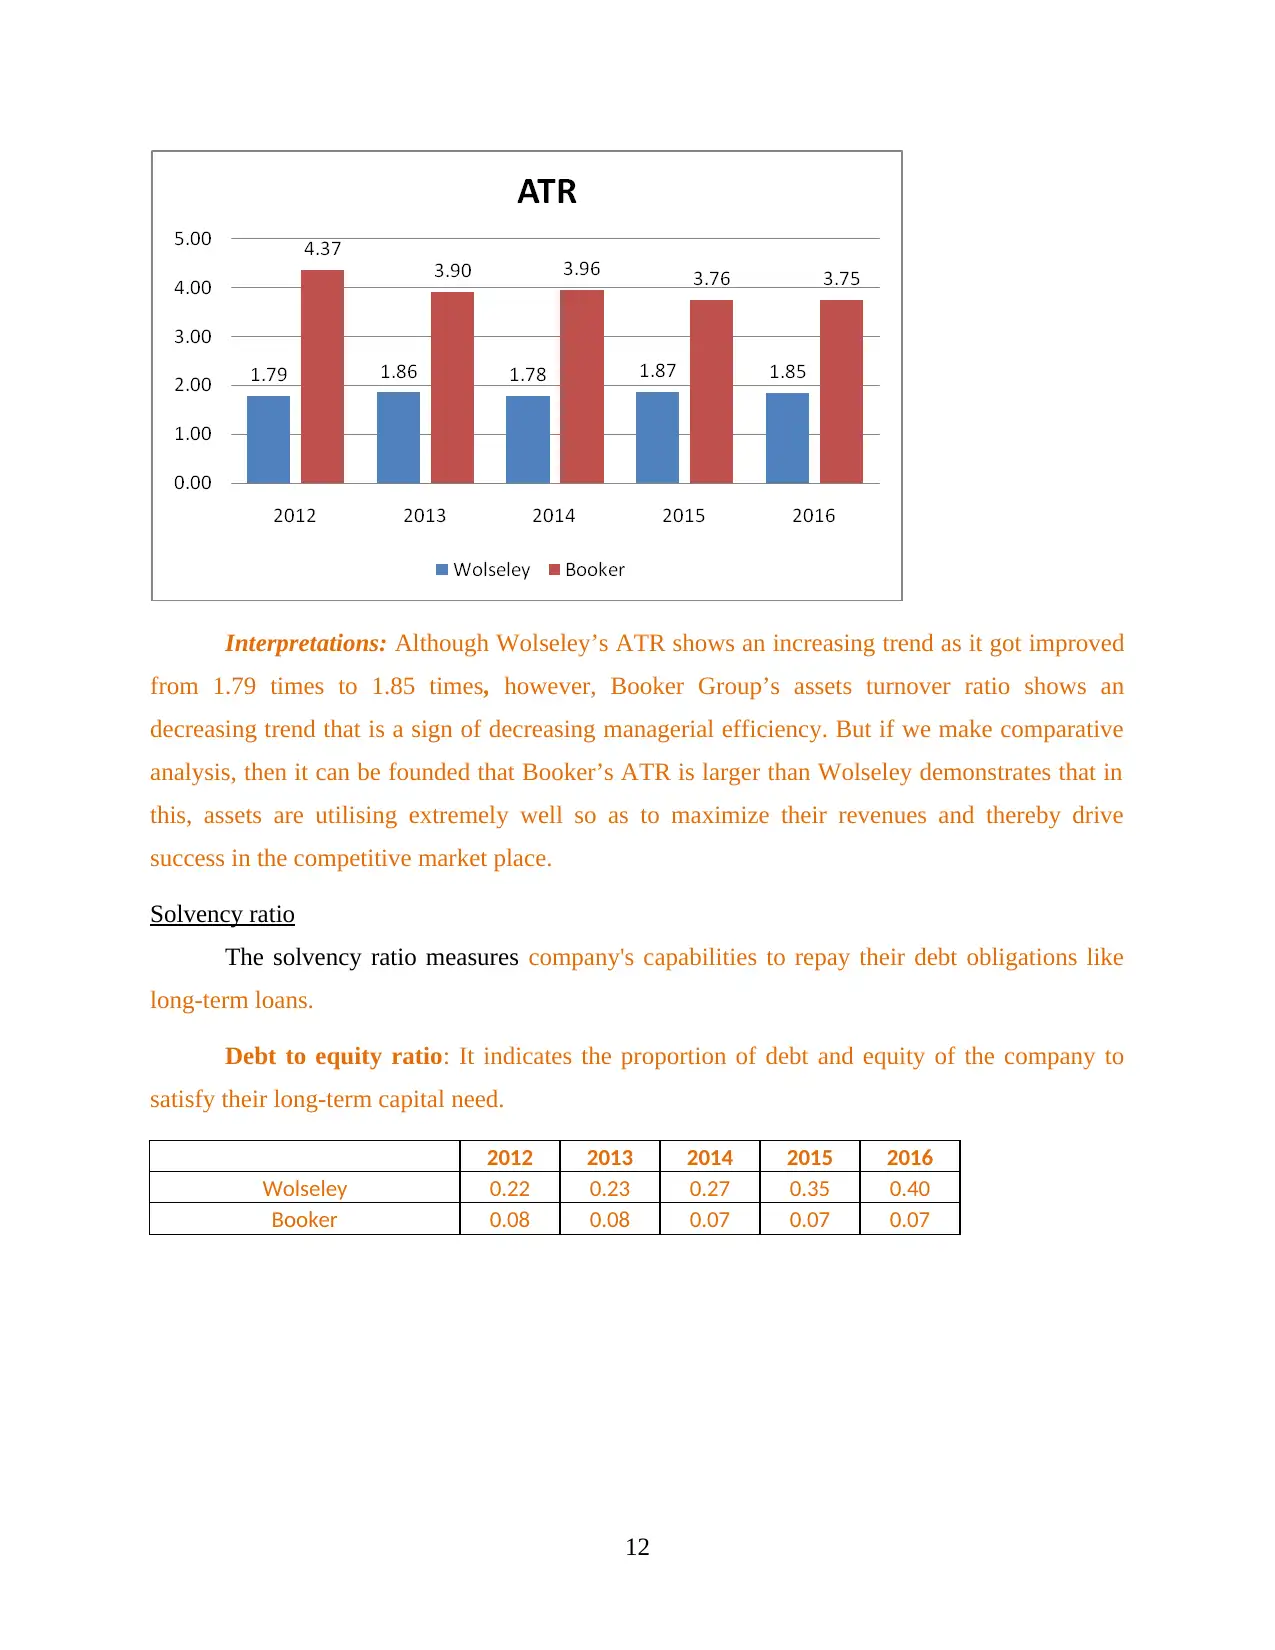
Interpretations: Although Wolseley’s ATR shows an increasing trend as it got improved
from 1.79 times to 1.85 times, however, Booker Group’s assets turnover ratio shows an
decreasing trend that is a sign of decreasing managerial efficiency. But if we make comparative
analysis, then it can be founded that Booker’s ATR is larger than Wolseley demonstrates that in
this, assets are utilising extremely well so as to maximize their revenues and thereby drive
success in the competitive market place.
Solvency ratio
The solvency ratio measures company's capabilities to repay their debt obligations like
long-term loans.
Debt to equity ratio: It indicates the proportion of debt and equity of the company to
satisfy their long-term capital need.
2012 2013 2014 2015 2016
Wolseley 0.22 0.23 0.27 0.35 0.40
Booker 0.08 0.08 0.07 0.07 0.07
12
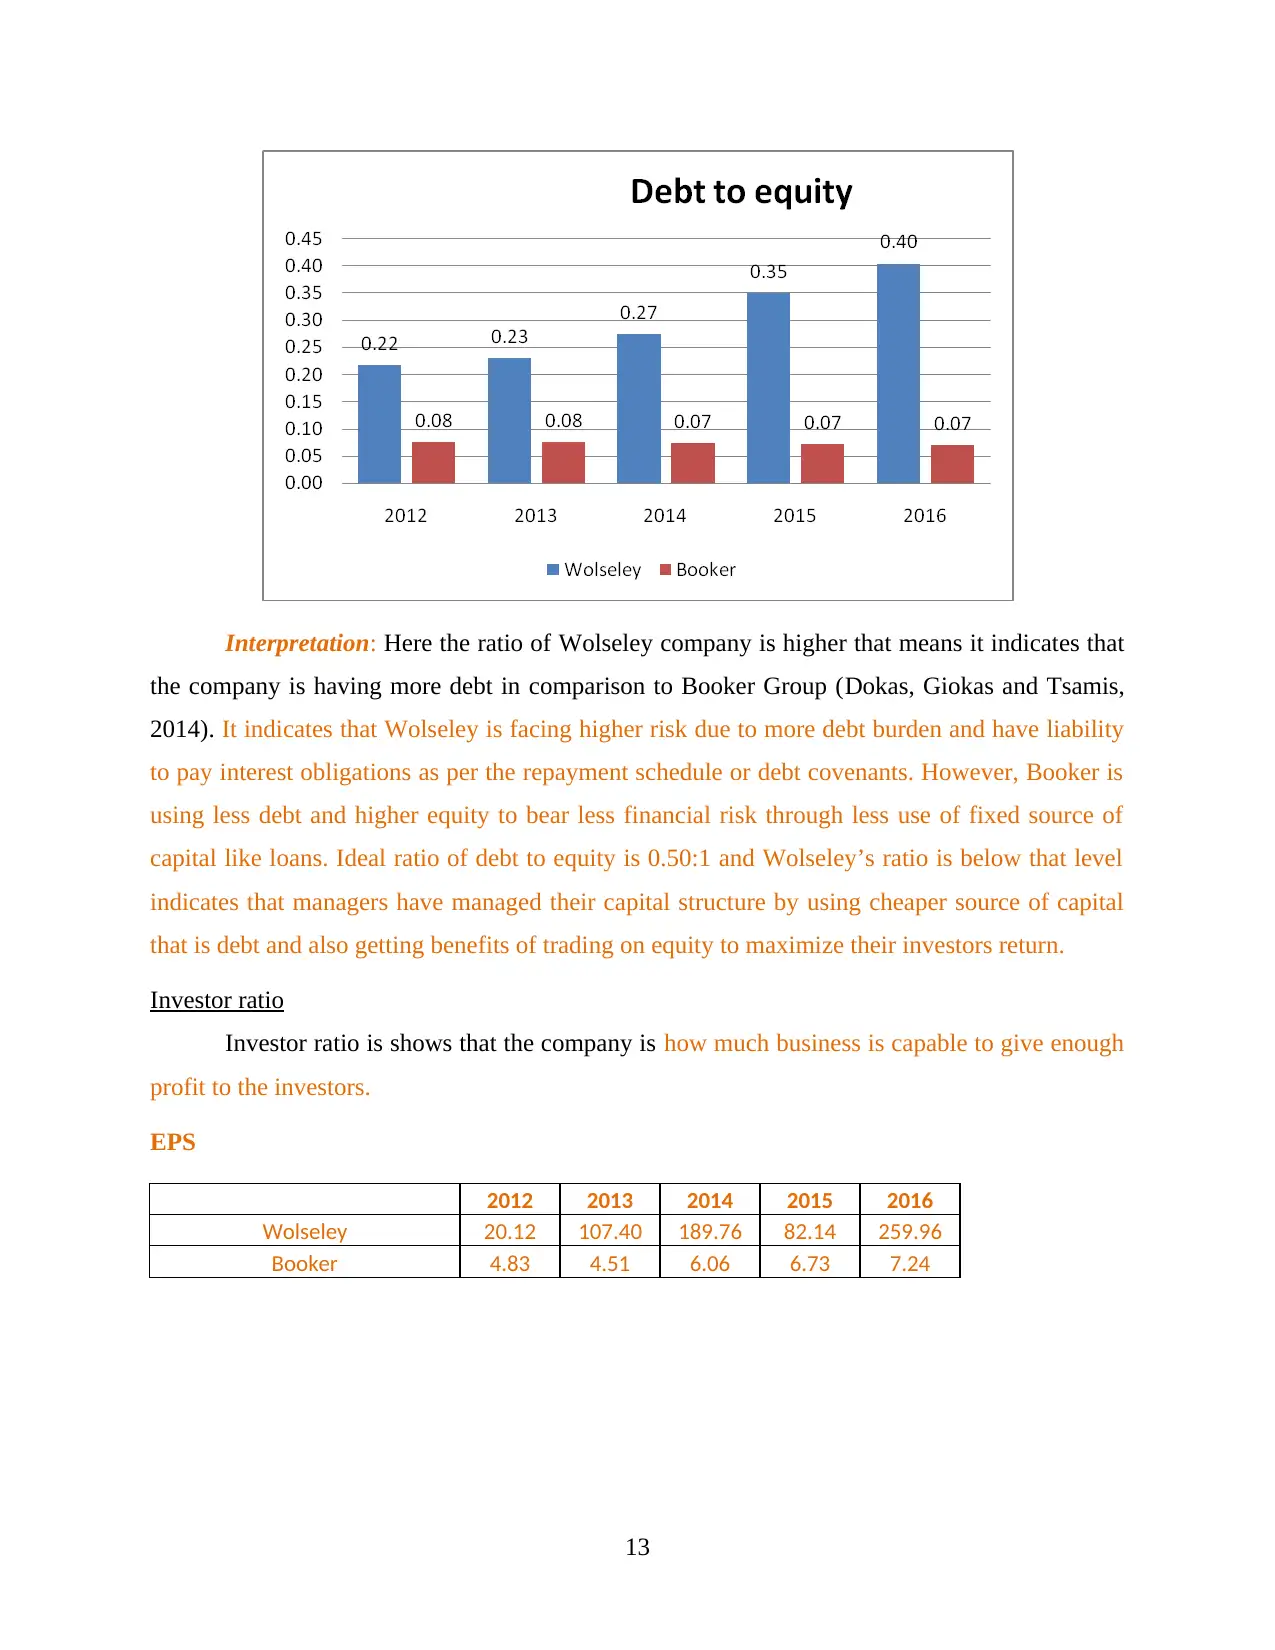
Interpretation: Here the ratio of Wolseley company is higher that means it indicates that
the company is having more debt in comparison to Booker Group (Dokas, Giokas and Tsamis,
2014). It indicates that Wolseley is facing higher risk due to more debt burden and have liability
to pay interest obligations as per the repayment schedule or debt covenants. However, Booker is
using less debt and higher equity to bear less financial risk through less use of fixed source of
capital like loans. Ideal ratio of debt to equity is 0.50:1 and Wolseley’s ratio is below that level
indicates that managers have managed their capital structure by using cheaper source of capital
that is debt and also getting benefits of trading on equity to maximize their investors return.
Investor ratio
Investor ratio is shows that the company is how much business is capable to give enough
profit to the investors.
EPS
2012 2013 2014 2015 2016
Wolseley 20.12 107.40 189.76 82.14 259.96
Booker 4.83 4.51 6.06 6.73 7.24
13
Secure Best Marks with AI Grader
Need help grading? Try our AI Grader for instant feedback on your assignments.
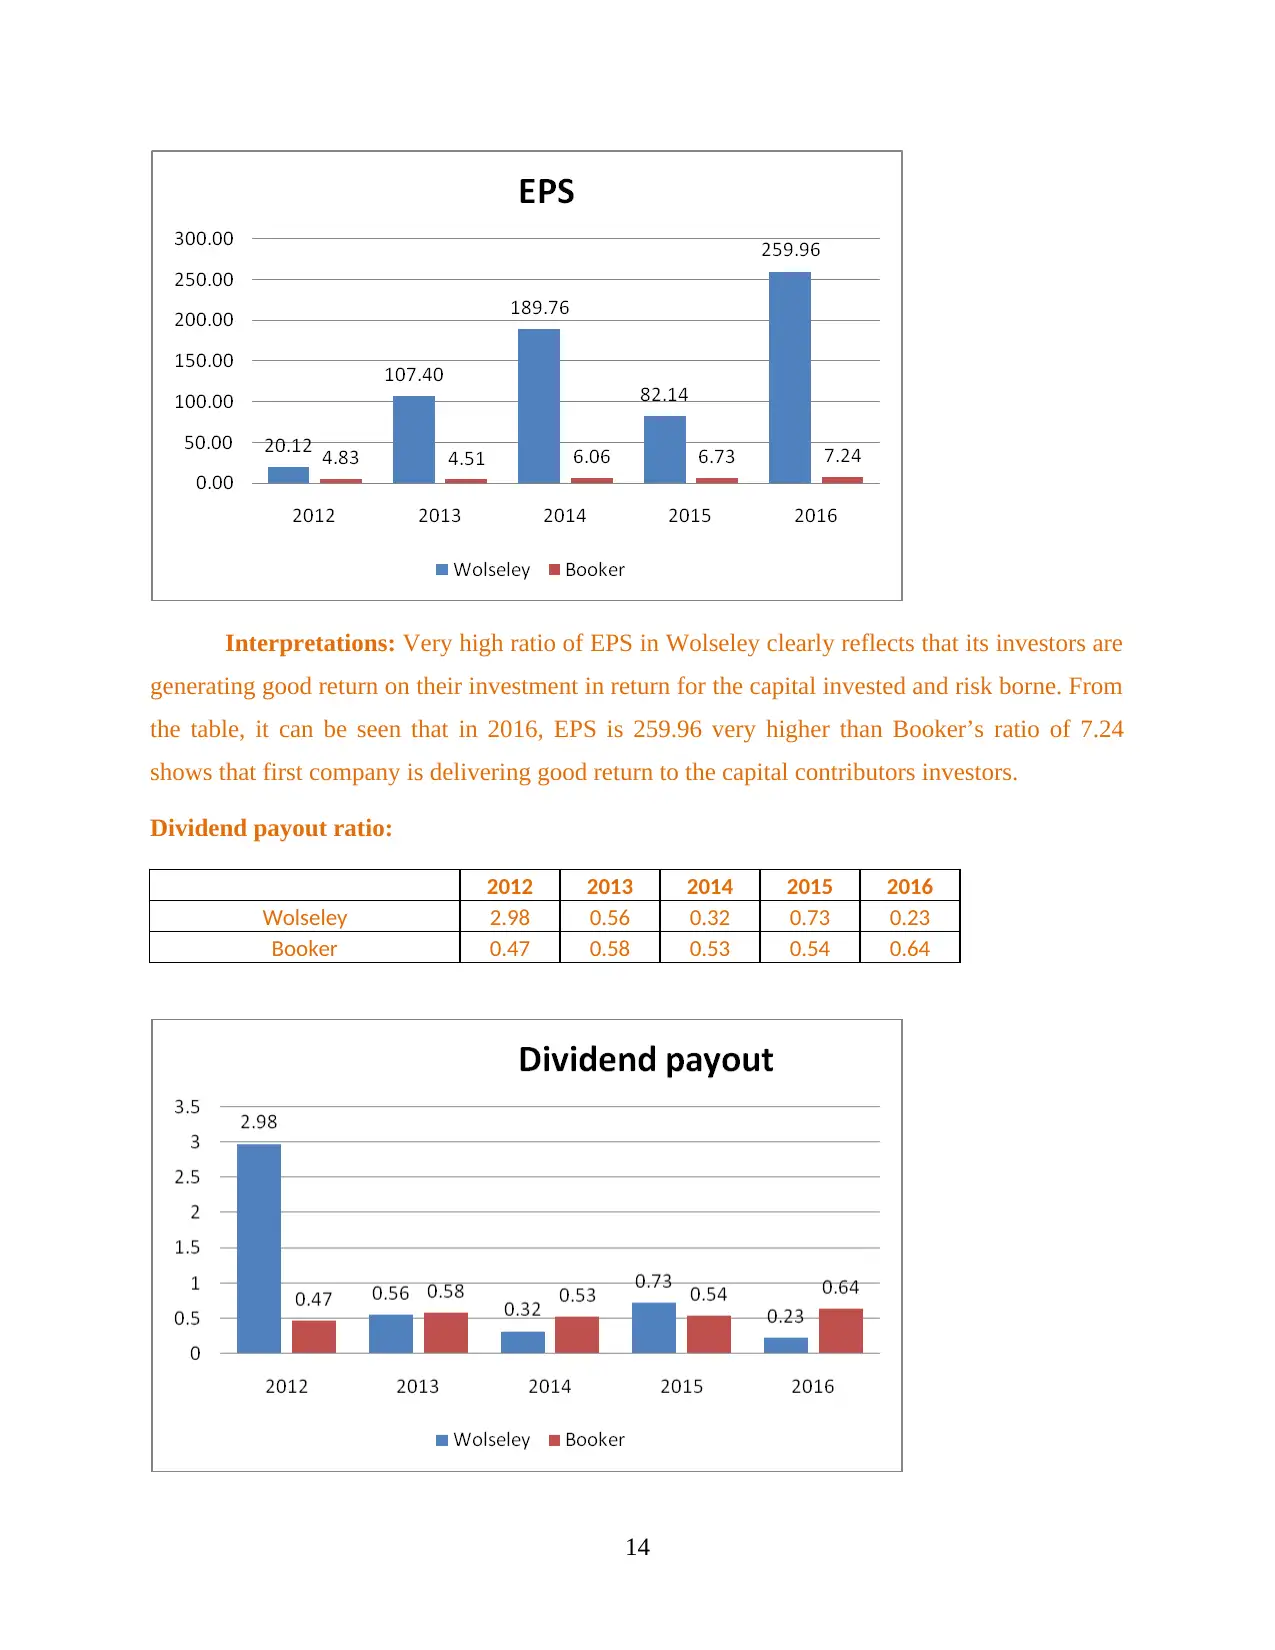
Interpretations: Very high ratio of EPS in Wolseley clearly reflects that its investors are
generating good return on their investment in return for the capital invested and risk borne. From
the table, it can be seen that in 2016, EPS is 259.96 very higher than Booker’s ratio of 7.24
shows that first company is delivering good return to the capital contributors investors.
Dividend payout ratio:
2012 2013 2014 2015 2016
Wolseley 2.98 0.56 0.32 0.73 0.23
Booker 0.47 0.58 0.53 0.54 0.64
14
Interpretations: It shows a volatile and fluctuationg trend due to changing EPS and
DPS. In the year 2016, Wolseley’s ratio is 0.23 however, Booker’s ratio is 0.64 comparatively
greater shows that it is making higher payments as dividend out of net earning generated through
operations.
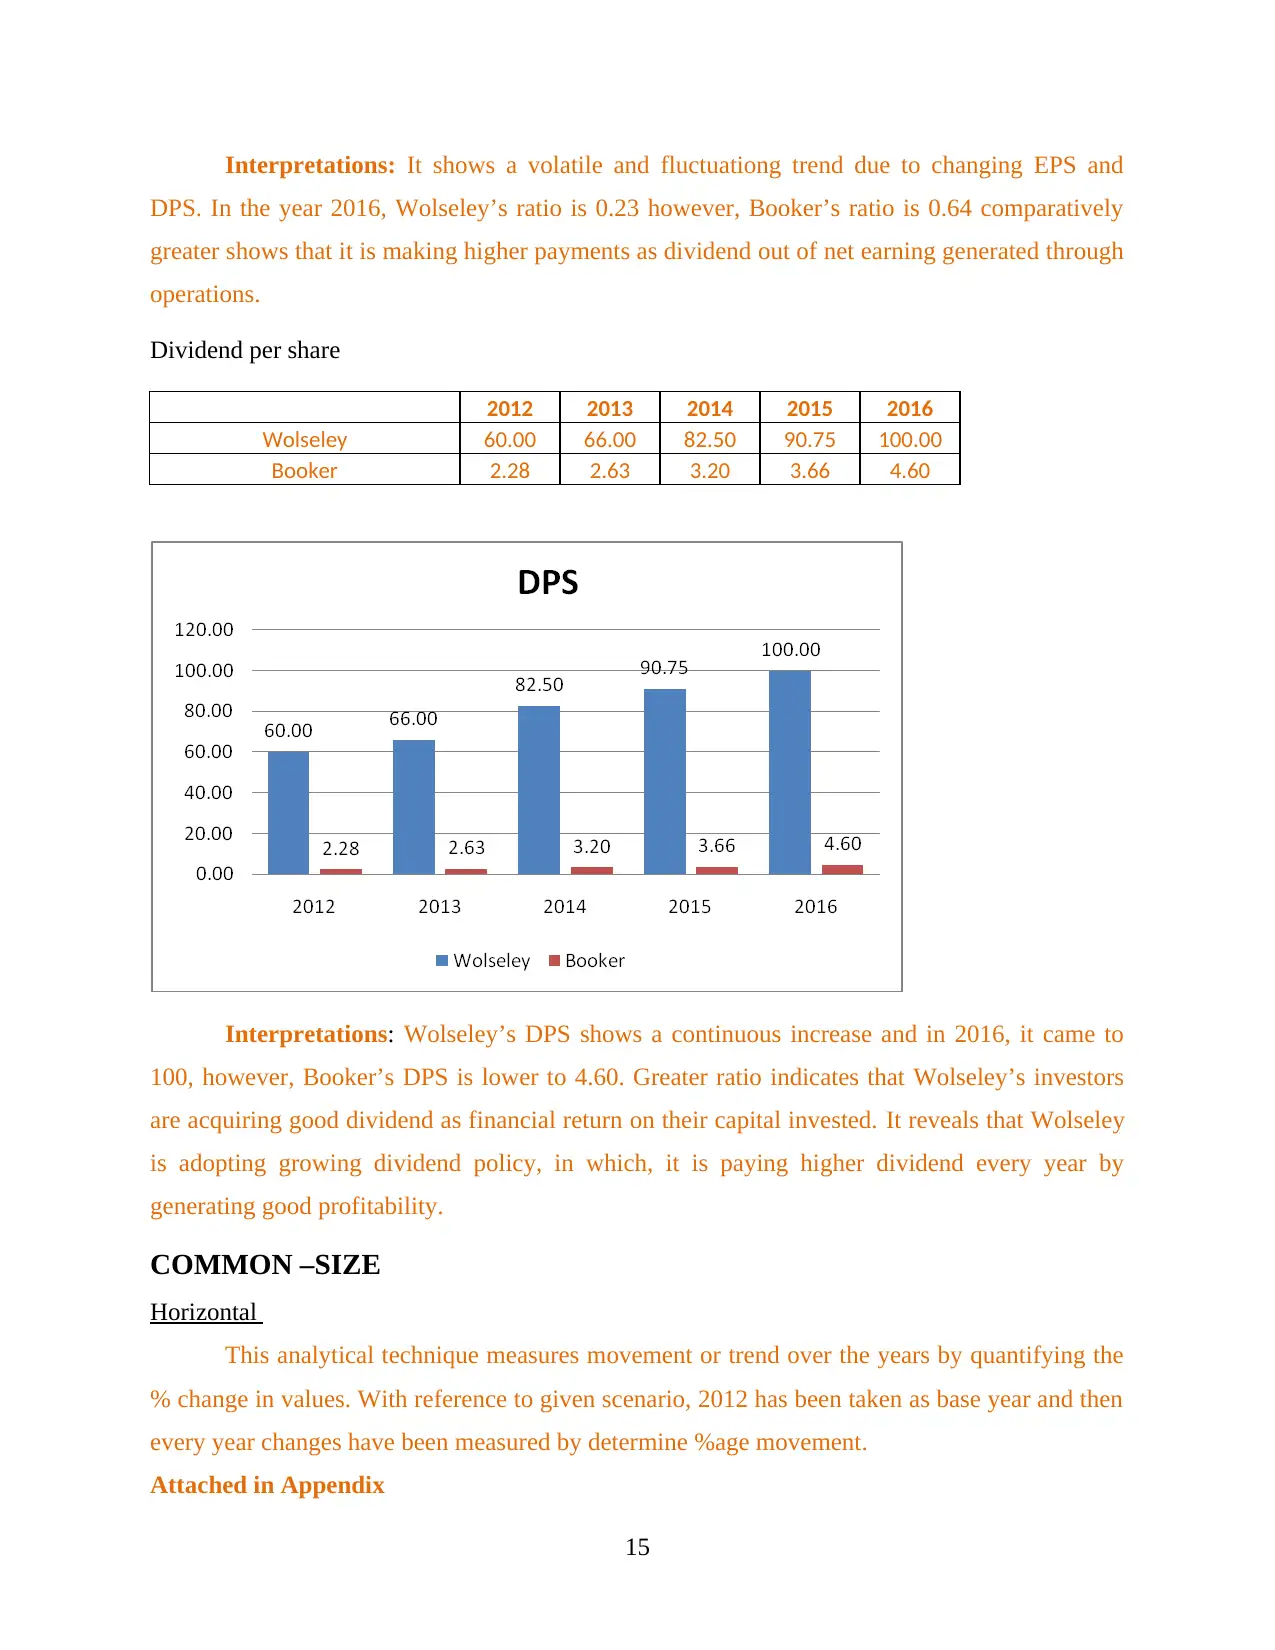
Dividend per share
2012 2013 2014 2015 2016
Wolseley 60.00 66.00 82.50 90.75 100.00
Booker 2.28 2.63 3.20 3.66 4.60
Interpretations: Wolseley’s DPS shows a continuous increase and in 2016, it came to
100, however, Booker’s DPS is lower to 4.60. Greater ratio indicates that Wolseley’s investors
are acquiring good dividend as financial return on their capital invested. It reveals that Wolseley
is adopting growing dividend policy, in which, it is paying higher dividend every year by
generating good profitability.
COMMON –SIZE
Horizontal
This analytical technique measures movement or trend over the years by quantifying the
% change in values. With reference to given scenario, 2012 has been taken as base year and then
every year changes have been measured by determine %age movement.
Attached in Appendix
15
DPS. In the year 2016, Wolseley’s ratio is 0.23 however, Booker’s ratio is 0.64 comparatively
greater shows that it is making higher payments as dividend out of net earning generated through
operations.
Dividend per share
2012 2013 2014 2015 2016
Wolseley 60.00 66.00 82.50 90.75 100.00
Booker 2.28 2.63 3.20 3.66 4.60
Interpretations: Wolseley’s DPS shows a continuous increase and in 2016, it came to
100, however, Booker’s DPS is lower to 4.60. Greater ratio indicates that Wolseley’s investors
are acquiring good dividend as financial return on their capital invested. It reveals that Wolseley
is adopting growing dividend policy, in which, it is paying higher dividend every year by
generating good profitability.
COMMON –SIZE
Horizontal
This analytical technique measures movement or trend over the years by quantifying the
% change in values. With reference to given scenario, 2012 has been taken as base year and then
every year changes have been measured by determine %age movement.
Attached in Appendix
15
Wolseley’s analysis revealed positive trend in sales after 2014 as its % rose up by
91.43%, 99.34% and 107.52% respectively. Similarly, Booker’s turnover also got improved
continuously and in end, it came to 120.86%. However, on the other side, %age increase in net
profit got improved to 157.14% whereas in Wolseley, it is 1140.35% in comparison to the profit
of 2012 worth 57.
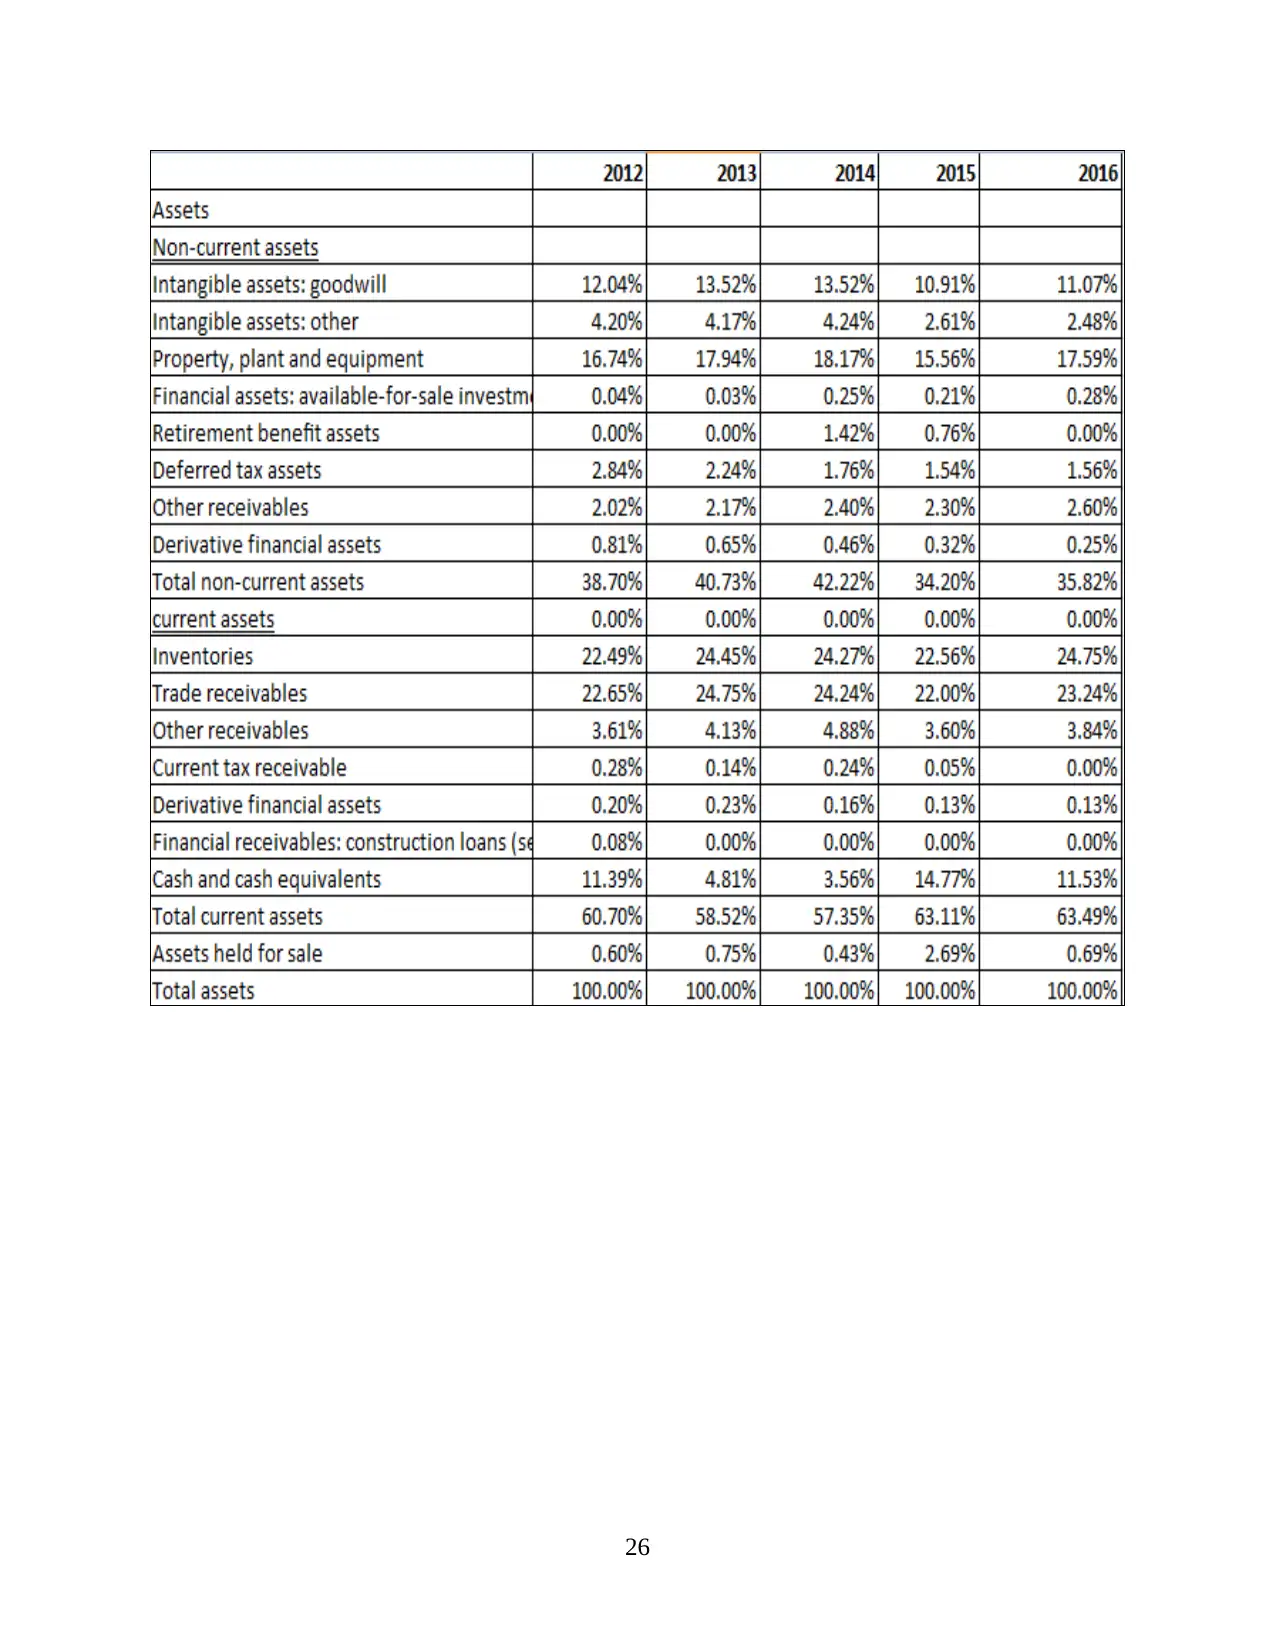
Vertical analysis
In profitability statement, sales revenues has been considered as base, however, in
balance sheet, total assets and liabilities has been taken base element and all the other element’s
% age has been compared on this base element.
Attached in Appendix
In 2016, Wolseley’s COGS % on sales got decreased from 72.45% to 71.73% whereas
Booker’s COGS %age has been fallen from 96.22% to 94.92%. Furthermore, its total operating
cost dropped down to 22.95% whilst Booker’s administrative cost gone improved from 1.50% to
2.02%.
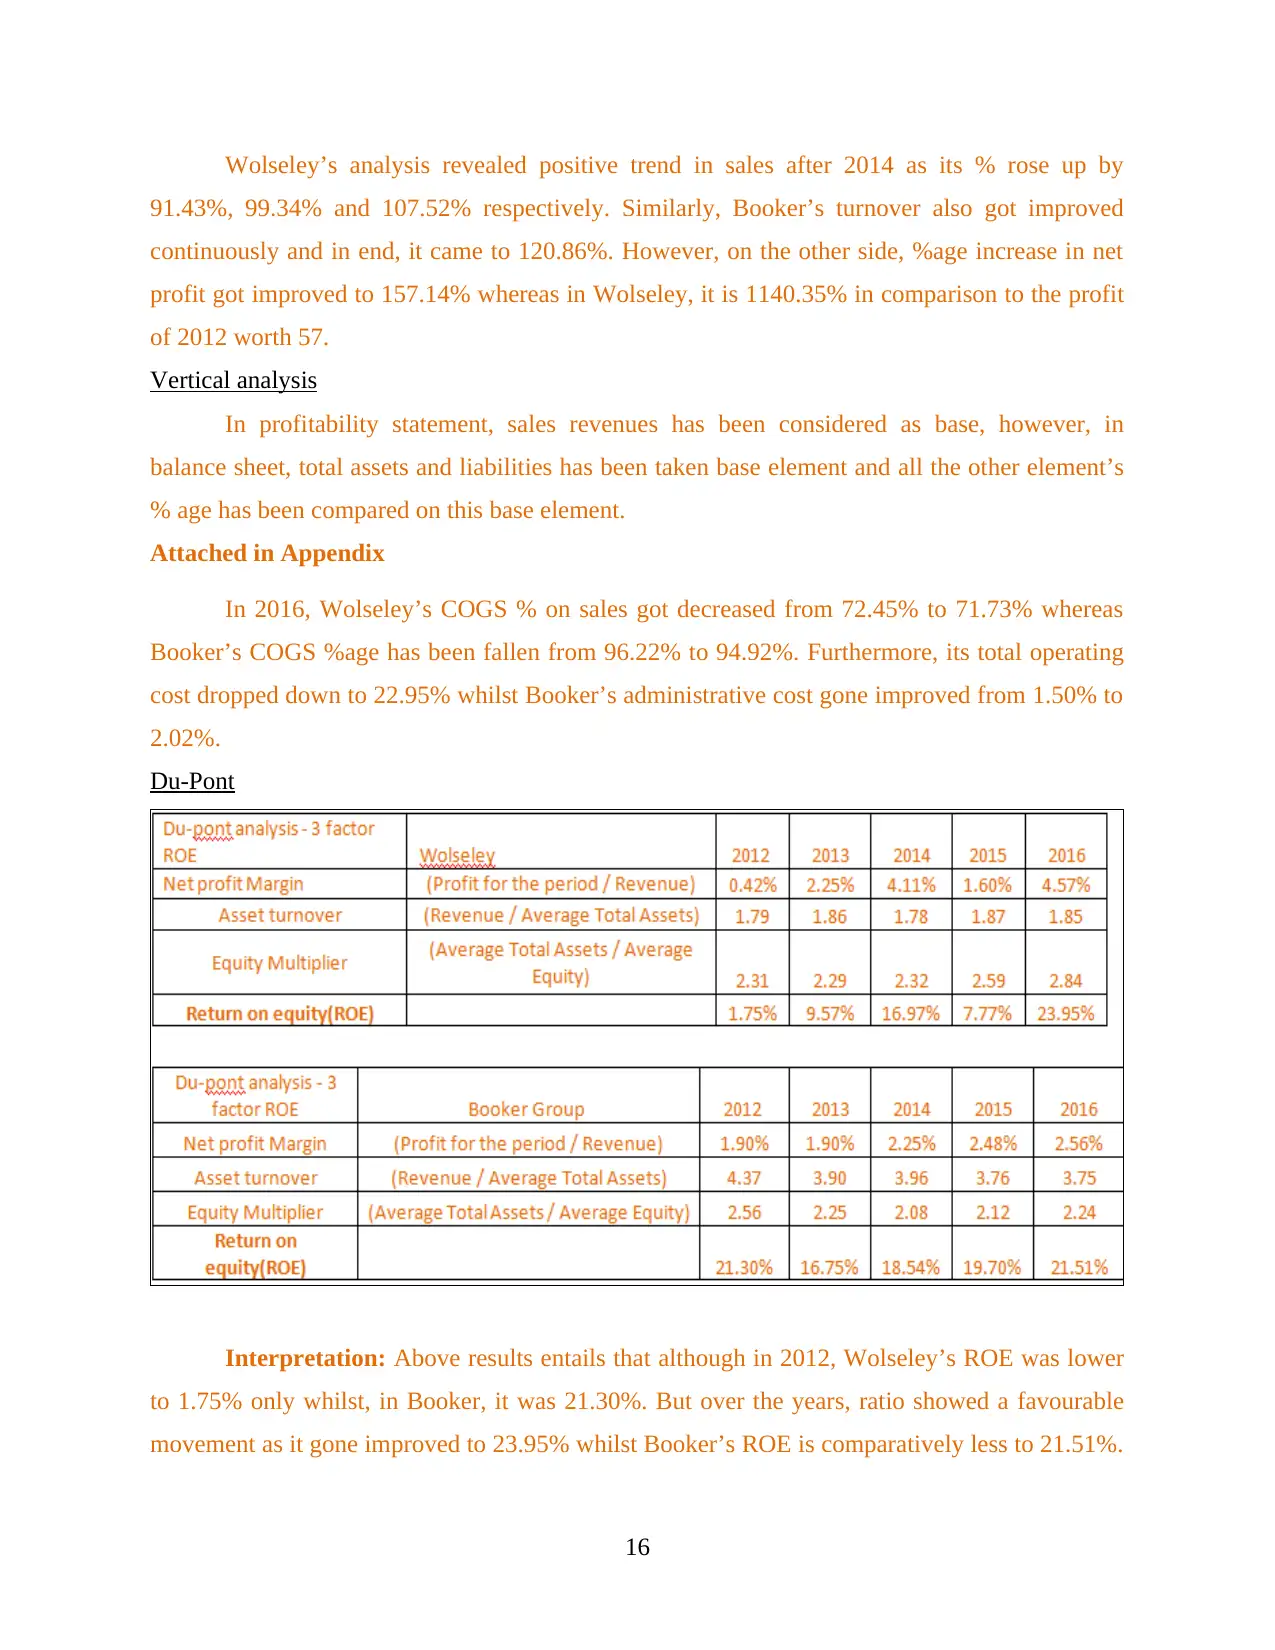
Du-Pont
Interpretation: Above results entails that although in 2012, Wolseley’s ROE was lower
to 1.75% only whilst, in Booker, it was 21.30%. But over the years, ratio showed a favourable
movement as it gone improved to 23.95% whilst Booker’s ROE is comparatively less to 21.51%.
16
91.43%, 99.34% and 107.52% respectively. Similarly, Booker’s turnover also got improved
continuously and in end, it came to 120.86%. However, on the other side, %age increase in net
profit got improved to 157.14% whereas in Wolseley, it is 1140.35% in comparison to the profit
of 2012 worth 57.
Vertical analysis
In profitability statement, sales revenues has been considered as base, however, in
balance sheet, total assets and liabilities has been taken base element and all the other element’s
% age has been compared on this base element.
Attached in Appendix
In 2016, Wolseley’s COGS % on sales got decreased from 72.45% to 71.73% whereas
Booker’s COGS %age has been fallen from 96.22% to 94.92%. Furthermore, its total operating
cost dropped down to 22.95% whilst Booker’s administrative cost gone improved from 1.50% to
2.02%.
Du-Pont
Interpretation: Above results entails that although in 2012, Wolseley’s ROE was lower
to 1.75% only whilst, in Booker, it was 21.30%. But over the years, ratio showed a favourable
movement as it gone improved to 23.95% whilst Booker’s ROE is comparatively less to 21.51%.
16
Paraphrase This Document
Need a fresh take? Get an instant paraphrase of this document with our AI Paraphraser
Thus, data clearly reveals that Wolseley’s satisfied its investors by generating greater yield or net
earnings on their equity capital invested in the business.
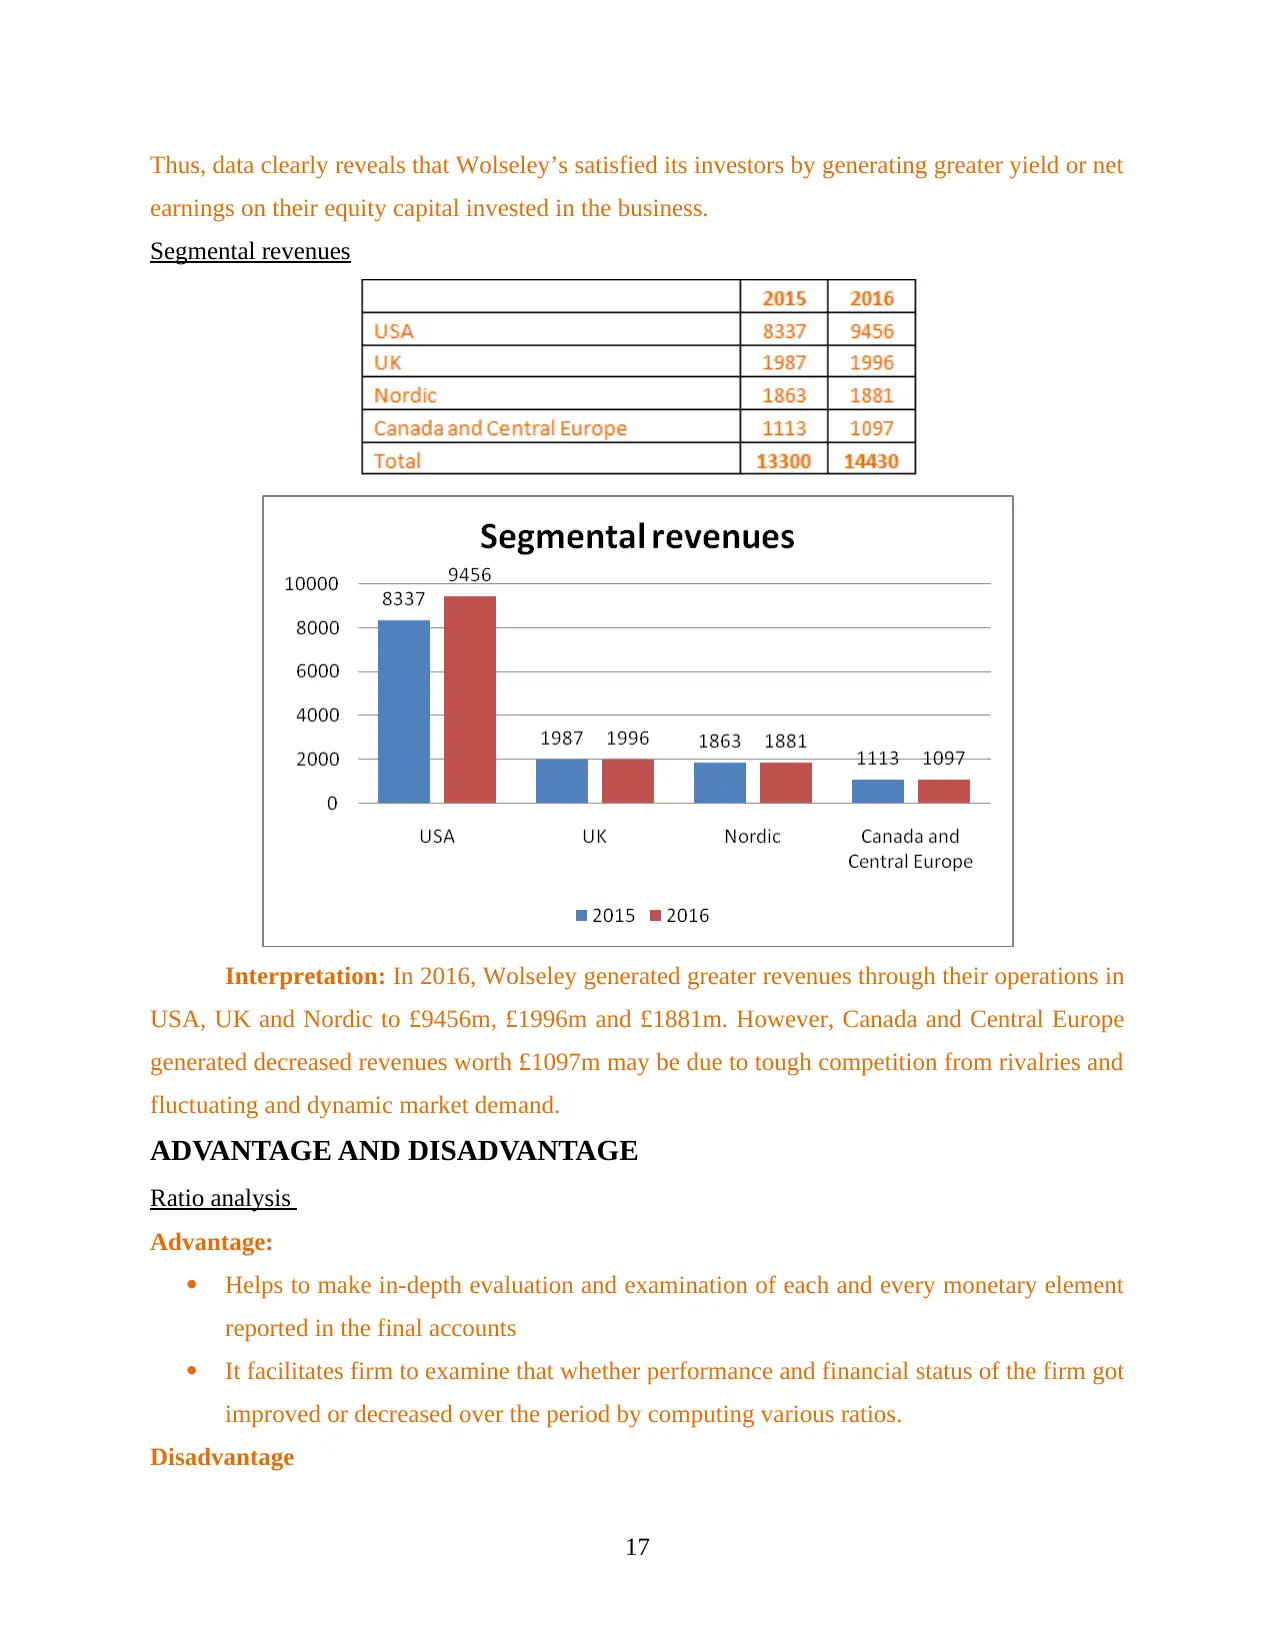
Segmental revenues
Interpretation: In 2016, Wolseley generated greater revenues through their operations in
USA, UK and Nordic to £9456m, £1996m and £1881m. However, Canada and Central Europe
generated decreased revenues worth £1097m may be due to tough competition from rivalries and
fluctuating and dynamic market demand.
ADVANTAGE AND DISADVANTAGE
Ratio analysis
Advantage:
Helps to make in-depth evaluation and examination of each and every monetary element
reported in the final accounts
It facilitates firm to examine that whether performance and financial status of the firm got
improved or decreased over the period by computing various ratios.
Disadvantage
17
earnings on their equity capital invested in the business.
Segmental revenues
Interpretation: In 2016, Wolseley generated greater revenues through their operations in
USA, UK and Nordic to £9456m, £1996m and £1881m. However, Canada and Central Europe
generated decreased revenues worth £1097m may be due to tough competition from rivalries and
fluctuating and dynamic market demand.
ADVANTAGE AND DISADVANTAGE
Ratio analysis
Advantage:
Helps to make in-depth evaluation and examination of each and every monetary element
reported in the final accounts
It facilitates firm to examine that whether performance and financial status of the firm got
improved or decreased over the period by computing various ratios.
Disadvantage
17
Ignore qualitative elements like consumer satisfaction, market reputation, product
portfolio and so on.
Results are based on reported figures in the final accounts which may be incorrect and
leads to make wrong decisions.
Avoid accounting policies, conventions, rules and regulations which might me vary from
year to year.
Does not consider market movement like inflation, technological upgradation, change in
legislations and regulatory framework.
Du-Pont
Advantage:
Take into consideration three important factors that are net profit margin, assets utilizing
efficiency and leverage that helps to make better decisions (Hanushek and Rivkin, 2010).
Disadvantage:
Misleading data in the financial statement may distort or adversely affect the usefulness
of results.
Change in accounting rules and policies are also not considered which may bring changes
in the ratios for ROE computation (Patton and Timmermann, 2010).
Segmental
Advantage:
Separation of total sales revenues into different sub-components according to business
operations gives assistance to make suitable business decisions to maximize overall
performance.
Disadvantage:
Data manipulation in the reporting structure and non-adhering with the accounting rules
may results in taking harmful decisions (Kamoto, 2014).
CONCLUSION & RECOMMENDATIONS
Conclusion
The analysis conducted above bring the fact into consideration that Wolseley is
performing excellent as compare to Booker Group as it is generating more return. Moreover, it is
not suffering cash problems and liquidity crunch as its liquidity position is good. Due to greater
return, this company is also delivering better yield to the investors in return for their risk
18
undertaken by investing their own money. Besides this, solvency position is also sound as it
maintained the effective mix of debt and equity. However, efficiency analysis identified
managerial inefficiency as assets are not using optimally.
Recommendation
Booker Group must make several policies and decisions in order to stronger their revenue
stream and also must apply cost control mechanism so as to maximize profitability.
Closure and regular managerial monitoring and supervisions is also a better way to
curtain unnecessary spending and encourage saving.
Market expansion, new product, innovative technologies etc. can be used to enhance
performance.
Increase in CA and decrease in CL will also enable firm to strengthen their
creditworthiness to make their deferral payments on right time.
CONTEMPROARY METHODS
CAPM model
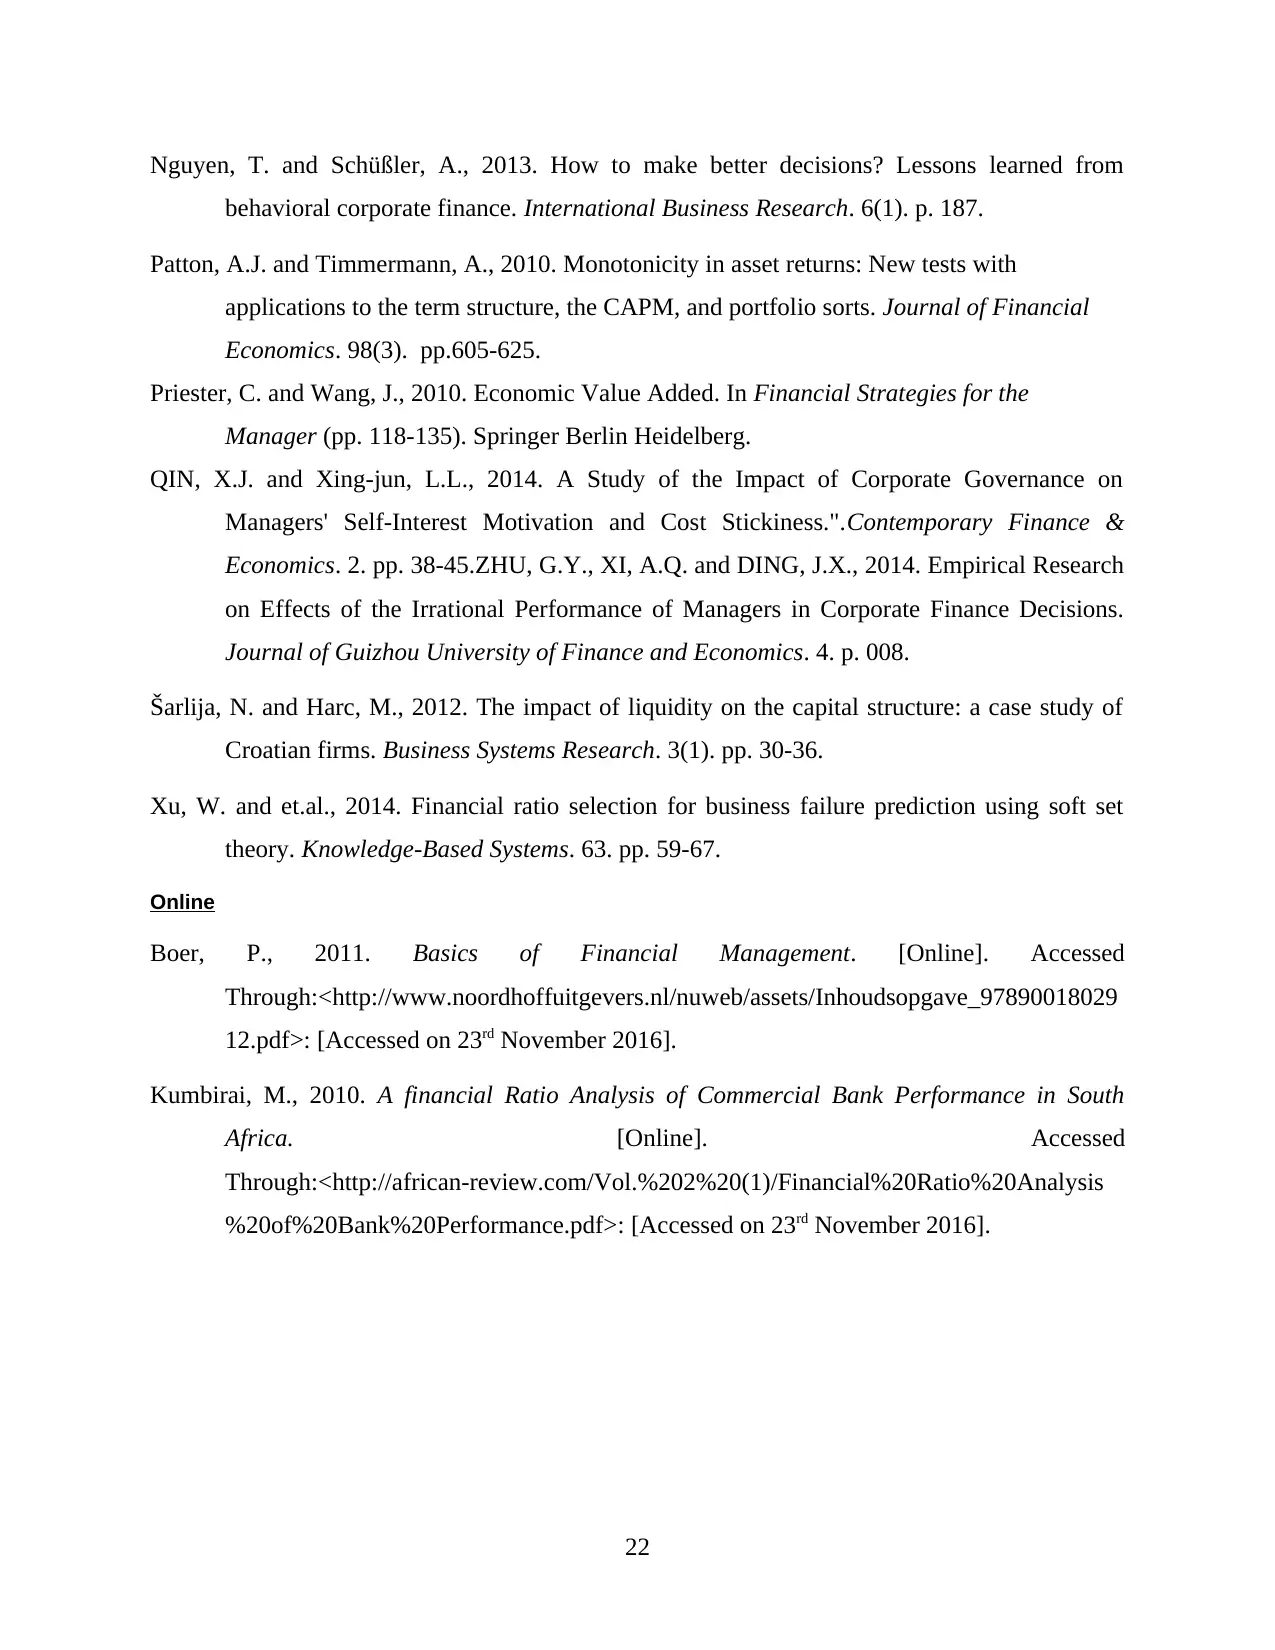
This model is generally used to assess the relationship between and risk and return by
creating portfolio of assets. However, this model reflects information related to risk free rate of
return and beta which is considered as market risk. This shows that if beta of assets is 1 then total
risk associated with portfolio will be equivalent to market risk (Barberis, Greenwood, Jin and
Shleifer, 2015).
Efficient market hypothesis
This is another important concept related to investment which detail regarding the return
generated by security in particular situation (LeRoy, 2010). EMH reflects that investor cannot
get abnormal return out a portfolio or particular assets as prices already contain all information
19
maintained the effective mix of debt and equity. However, efficiency analysis identified
managerial inefficiency as assets are not using optimally.
Recommendation
Booker Group must make several policies and decisions in order to stronger their revenue
stream and also must apply cost control mechanism so as to maximize profitability.
Closure and regular managerial monitoring and supervisions is also a better way to
curtain unnecessary spending and encourage saving.
Market expansion, new product, innovative technologies etc. can be used to enhance
performance.
Increase in CA and decrease in CL will also enable firm to strengthen their
creditworthiness to make their deferral payments on right time.
CONTEMPROARY METHODS
CAPM model
This model is generally used to assess the relationship between and risk and return by
creating portfolio of assets. However, this model reflects information related to risk free rate of
return and beta which is considered as market risk. This shows that if beta of assets is 1 then total
risk associated with portfolio will be equivalent to market risk (Barberis, Greenwood, Jin and
Shleifer, 2015).
Efficient market hypothesis
This is another important concept related to investment which detail regarding the return
generated by security in particular situation (LeRoy, 2010). EMH reflects that investor cannot
get abnormal return out a portfolio or particular assets as prices already contain all information
19
Secure Best Marks with AI Grader
Need help grading? Try our AI Grader for instant feedback on your assignments.
available in the marketplace. Efficient market hypothesis depicts that no past prices and other
indicator affect the current prices of stock. Apart from this, other assumption related to semi,
strong and weak form do not allow investors to generate return on the basis of available
information (Lee, Lee and Lee, 2010).
Economic value added (EVA)
Economic value added is referred as internal management performance measures
whereby comparison is made between net operating profit and total cost of capital (Priester and
Wang, 2010). It is also known as economic profit which enable firm to opt appropriate strategies
by taking into account extracted results. It is considered as the best way to compare
establishment’s economic profit with the expected return percentage (Hanushek and Rivkin,
2010).
20
REFERENCES
Books and Journals
Ahrendsen, B.L. and Katchova, A.L., 2012. Financial ratio analysis using ARMS data.
Agricultural Finance Review. 72(2). pp. 262-272.
Ak, B.K. and et.al., 2013. The use of financial ratio models to help investors predict and interpret
significant corporate events. Australian journal of management. 38(3). pp. 553-598.
Barberis, N., Greenwood, R., Jin, L. and Shleifer, A., 2015. X-CAPM: An extrapolative capital
asset pricing model. Journal of Financial Economics. 115(1). pp.1-24.
Dokas, I., Giokas, D. and Tsamis, A., 2014. Liquidity efficiency in the Greek listed firms: a
financial ratio based on data envelopment analysis. International Journal of Corporate
Finance and Accounting (IJCFA). 1(1). pp. 40-59.
Evans, J.R. and Mathur, A., 2014. Retailing and the period leading up to the Great Recession: a
model and a 25-year financial ratio analysis of US retailing. The International Review of
Retail, Distribution and Consumer Research. 24(1). pp. 30-58.
Hanushek, E.A. and Rivkin, S.G., 2010. Generalizations about using value-added measures of
teacher quality. The American Economic Review, 100(2). pp.267-271.
Kamoto, S., 2014. Impacts of internal financing on investment decisions by optimistic and
overconfident managers. European Financial Management. 20(1). pp. 107-125.
Lartey, V.C., Antwi, S. and Boadi, E.K., 2013. The relationship between liquidity and
profitability of listed banks in Ghana. International Journal of Business and Social
Science. 4(3).
Lee, C.C., Lee, J.D. and Lee, C.C., 2010. Stock prices and the efficient market hypothesis:
Evidence from a panel stationary test with structural breaks. Japan and the world
economy. 22(1). pp.49-58.
LeRoy, S.F., 2010. Efficient market hypothesis. Encyclopedia of Quantitative Finance.
Mishra, L., 2013. HERD MENTALITY IN INDIAN FUND MANAGERS: A REALITY OR A
MYTH? A BEHAVIOURAL FINANCE PERSPECTIVE. International Journal of
Applied Financial Management Perspectives. 2(1). p. 216.
21
Nguyen, T. and Schüßler, A., 2013. How to make better decisions? Lessons learned from
behavioral corporate finance. International Business Research. 6(1). p. 187.
Patton, A.J. and Timmermann, A., 2010. Monotonicity in asset returns: New tests with
applications to the term structure, the CAPM, and portfolio sorts. Journal of Financial
Economics. 98(3). pp.605-625.
Priester, C. and Wang, J., 2010. Economic Value Added. In Financial Strategies for the
Manager (pp. 118-135). Springer Berlin Heidelberg.
QIN, X.J. and Xing-jun, L.L., 2014. A Study of the Impact of Corporate Governance on
Managers' Self-Interest Motivation and Cost Stickiness.".Contemporary Finance &
Economics. 2. pp. 38-45.ZHU, G.Y., XI, A.Q. and DING, J.X., 2014. Empirical Research
on Effects of the Irrational Performance of Managers in Corporate Finance Decisions.
Journal of Guizhou University of Finance and Economics. 4. p. 008.
Šarlija, N. and Harc, M., 2012. The impact of liquidity on the capital structure: a case study of
Croatian firms. Business Systems Research. 3(1). pp. 30-36.
Xu, W. and et.al., 2014. Financial ratio selection for business failure prediction using soft set
theory. Knowledge-Based Systems. 63. pp. 59-67.
Online
Boer, P., 2011. Basics of Financial Management. [Online]. Accessed
Through:<http://www.noordhoffuitgevers.nl/nuweb/assets/Inhoudsopgave_97890018029
12.pdf>: [Accessed on 23rd November 2016].
Kumbirai, M., 2010. A financial Ratio Analysis of Commercial Bank Performance in South
Africa. [Online]. Accessed
Through:<http://african-review.com/Vol.%202%20(1)/Financial%20Ratio%20Analysis
%20of%20Bank%20Performance.pdf>: [Accessed on 23rd November 2016].
22
Paraphrase This Document
Need a fresh take? Get an instant paraphrase of this document with our AI Paraphraser
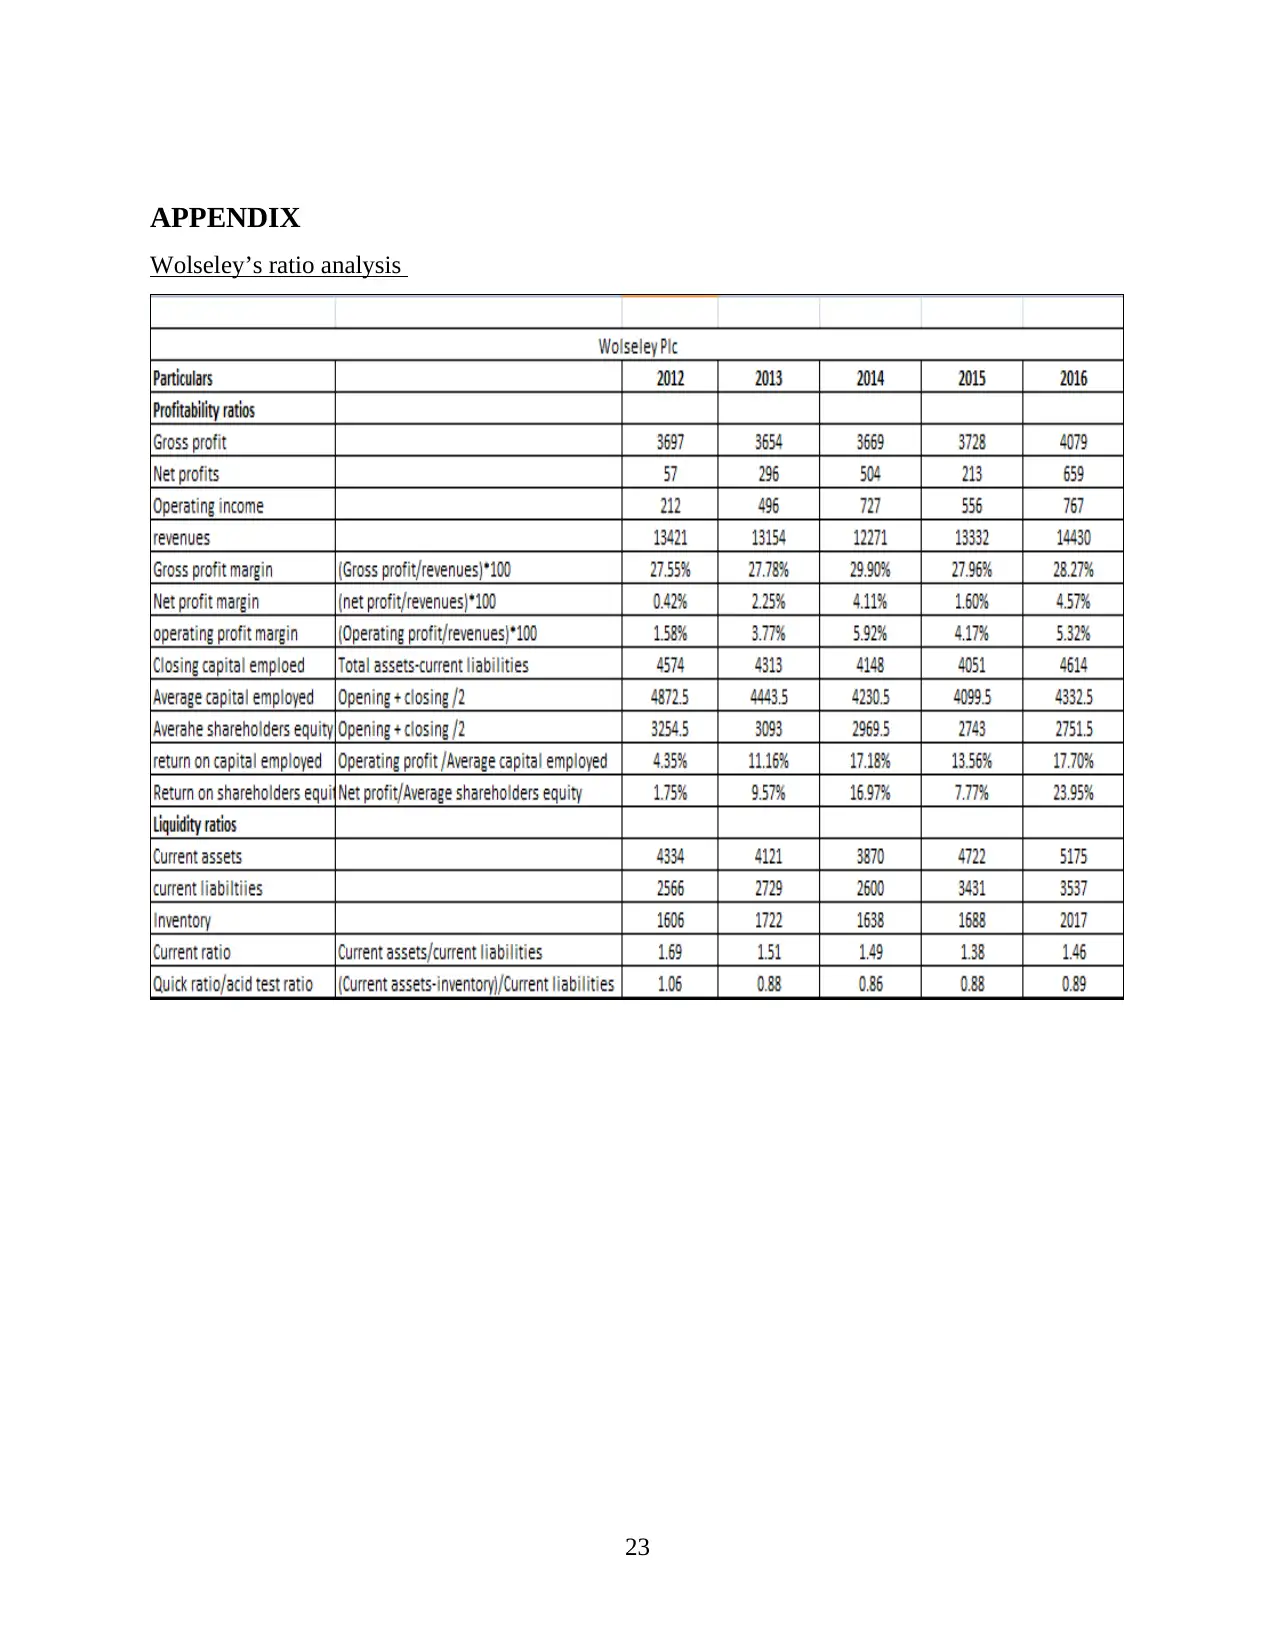
APPENDIX
Wolseley’s ratio analysis
23
Wolseley’s ratio analysis
23
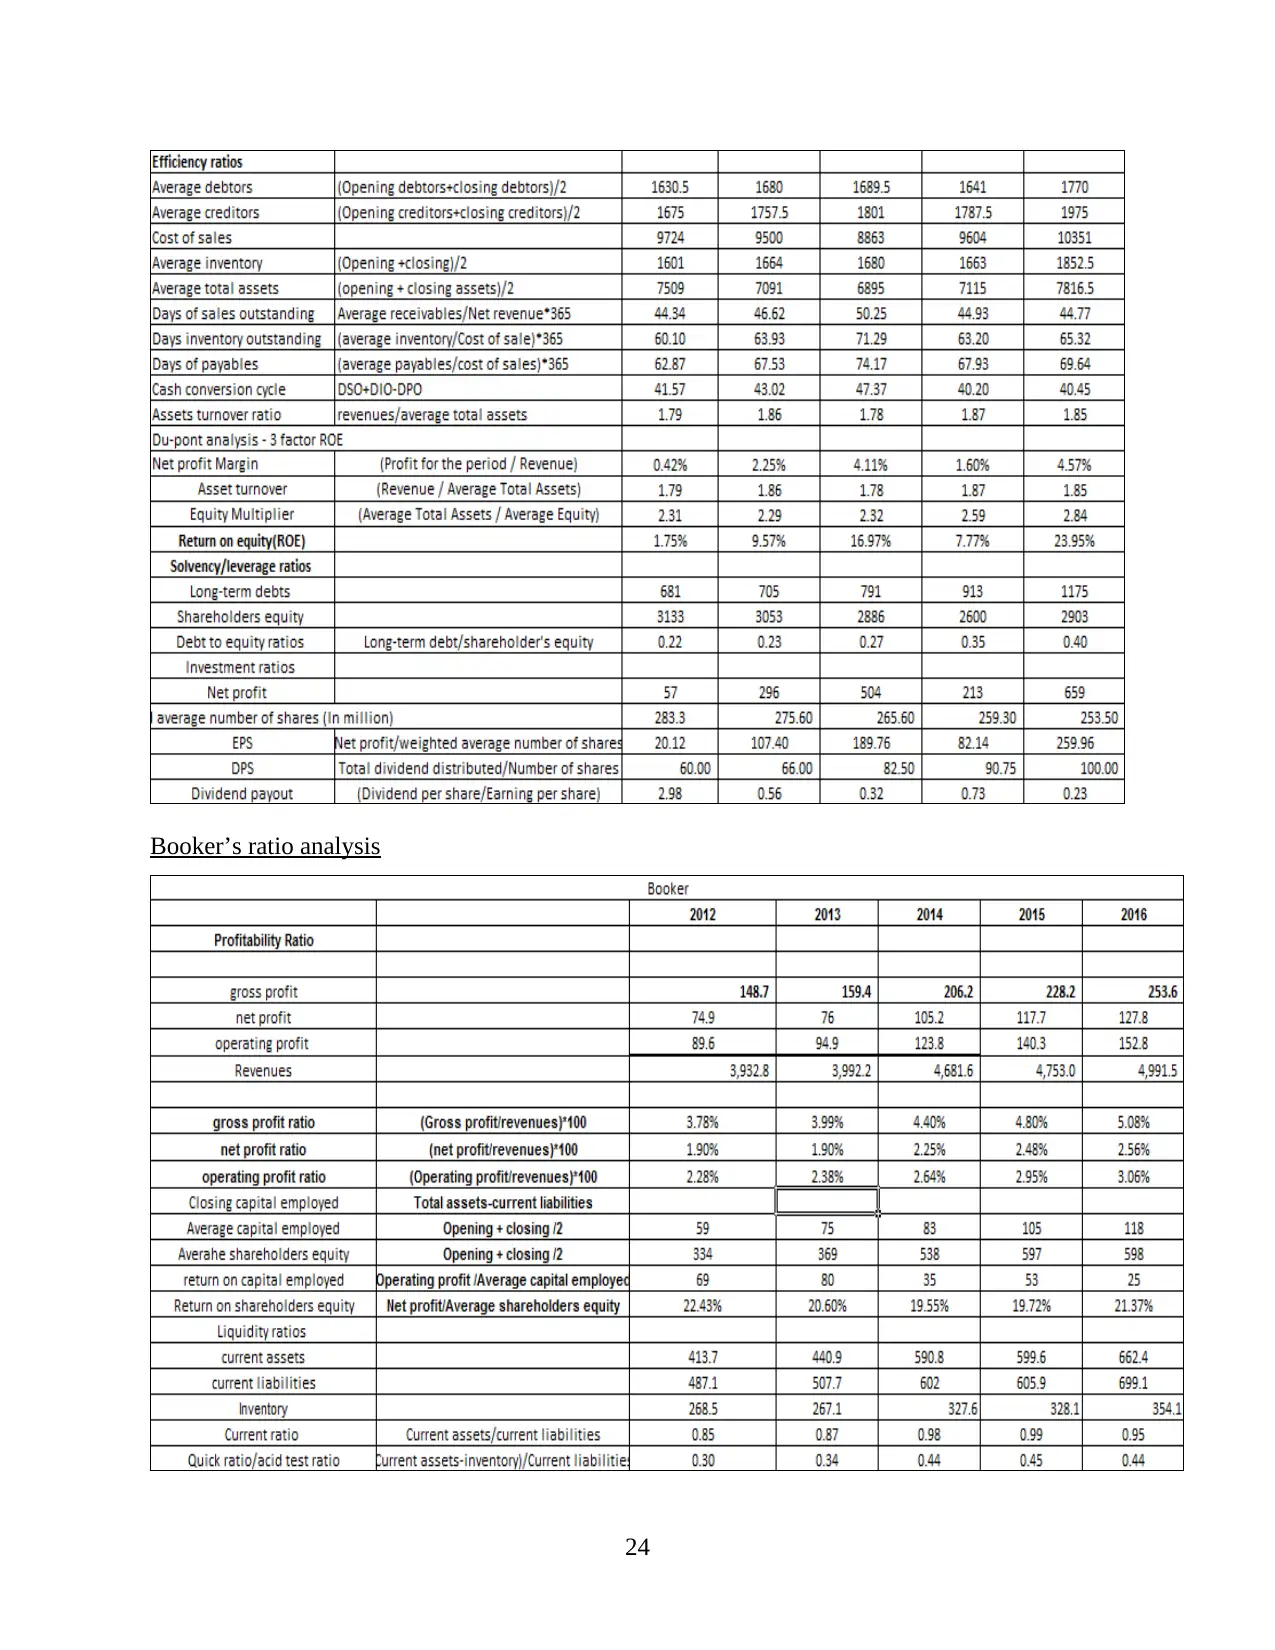
Booker’s ratio analysis
24
24
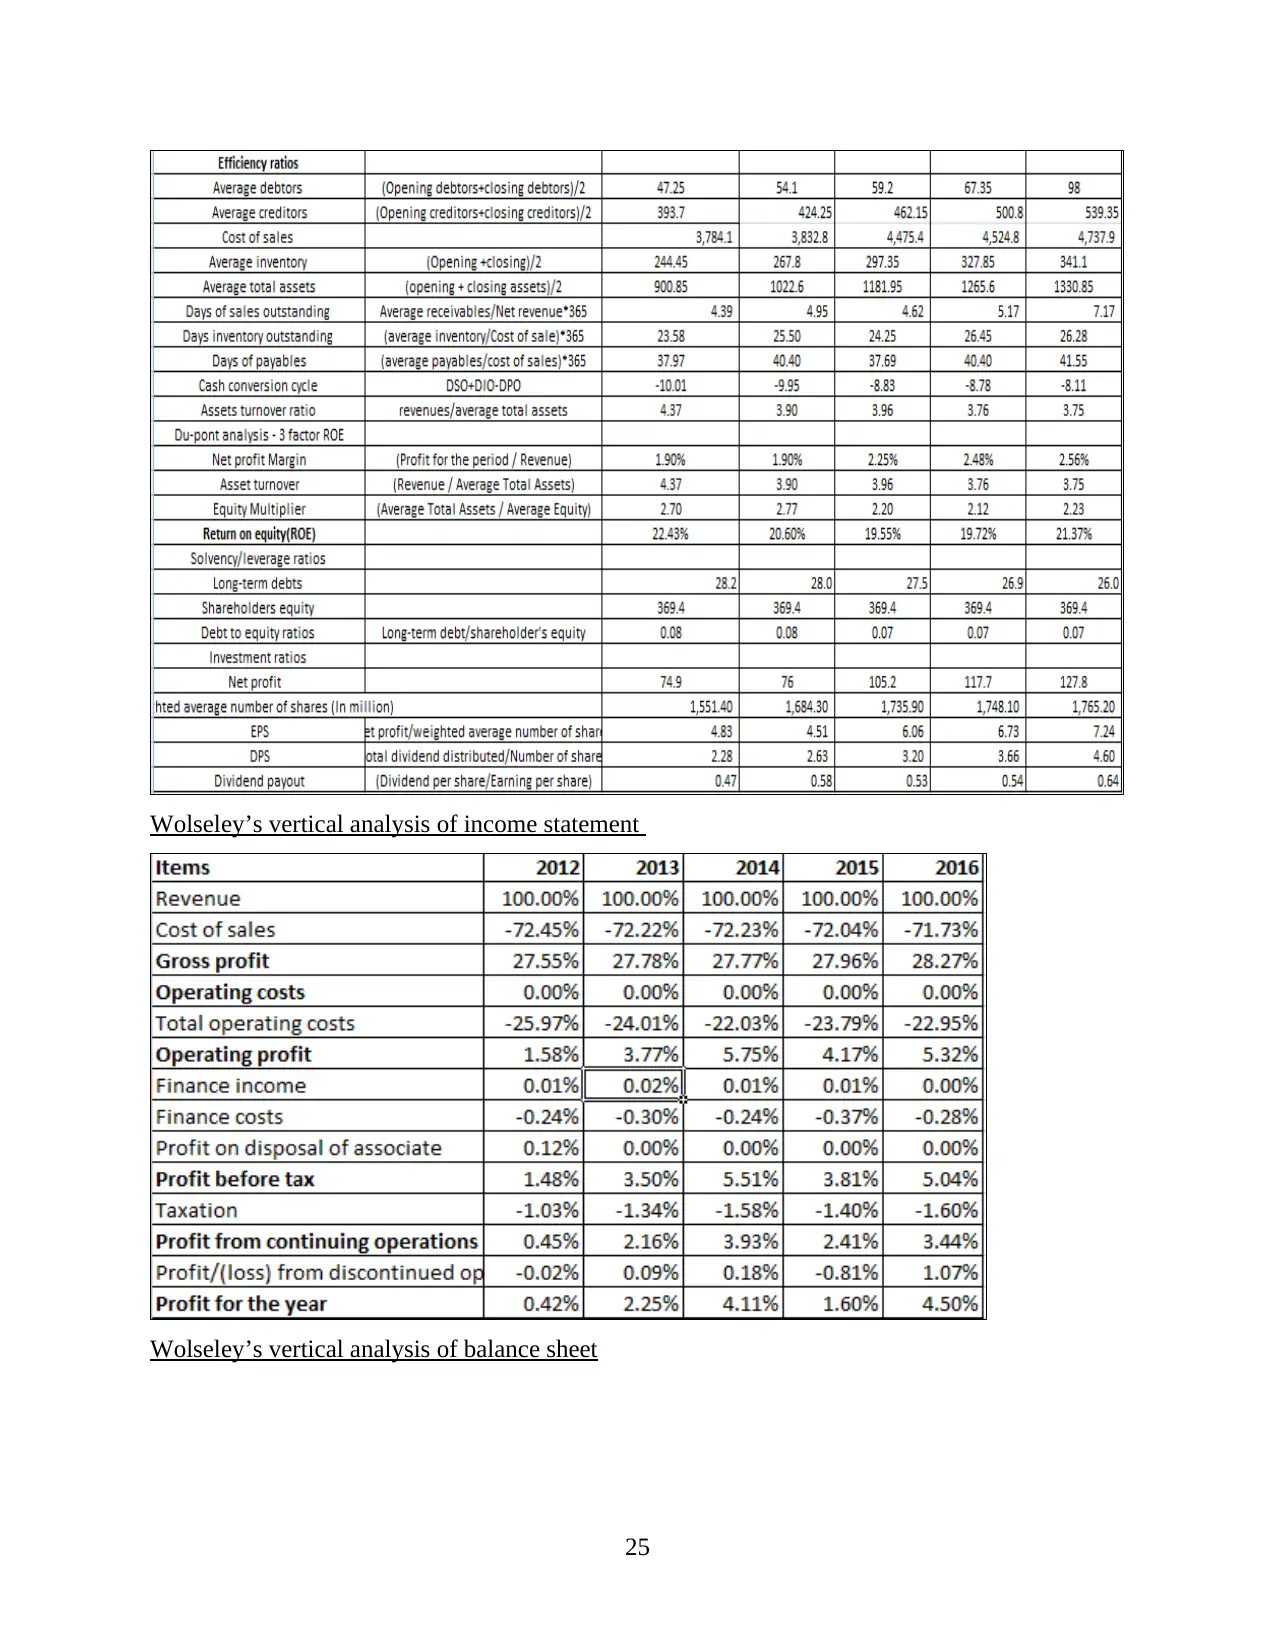
Wolseley’s vertical analysis of income statement
Wolseley’s vertical analysis of balance sheet
25
Wolseley’s vertical analysis of balance sheet
25
Secure Best Marks with AI Grader
Need help grading? Try our AI Grader for instant feedback on your assignments.
26
Wolseley’s vertical analysis of cash flow statement
Booker’s vertical analysis of income statement
27
Booker’s vertical analysis of income statement
27
Booker’s vertical analysis of balance sheet
28
28
Paraphrase This Document
Need a fresh take? Get an instant paraphrase of this document with our AI Paraphraser
Booker’s vertical analysis of statement of cash flows
29
29
Wolseley’s horizontal analysis of statement of income statement
Wolseley’s horizontal analysis of statement of balance sheet
30
Wolseley’s horizontal analysis of statement of balance sheet
30
Wolseley’s horizontal analysis of statement of cash flows
Booker’s horizontal analysis of income statement
31
Booker’s horizontal analysis of income statement
31
Secure Best Marks with AI Grader
Need help grading? Try our AI Grader for instant feedback on your assignments.
Booker’s horizontal analysis of balance sheet
32
32
Booker’s horizontal analysis of statement of cash flows
33
33
1 out of 36
Related Documents


Your All-in-One AI-Powered Toolkit for Academic Success.
+13062052269
info@desklib.com
Available 24*7 on WhatsApp / Email
![[object Object]](/_next/static/media/star-bottom.7253800d.svg)
Unlock your academic potential
© 2024 | Zucol Services PVT LTD | All rights reserved.