(DOC) Complete Strategic Finance Assignment
46 Pages10766 Words192 Views
Added on 2020-12-29
(DOC) Complete Strategic Finance Assignment
Added on 2020-12-29
ShareRelated Documents
STRATEGIC FINANCIAL ANALYSIS
Table of Contents1.0 INTRODUCTION....................................................................................................................................................11.1 Defining Strategic financial analysis and significance of financial analysis......................................................11.2 Objective of project.............................................................................................................................................11.3 Introducing two companies.................................................................................................................................11.4 Introducing methods of analysis..........................................................................................................................12.0 Calculation of Ratios.................................................................................................................................................12.1 Profitability..........................................................................................................................................................12.2 Liquidity..............................................................................................................................................................42.3 Efficiency............................................................................................................................................................52.4 Leverage..............................................................................................................................................................72.5 Cash flow ratios...................................................................................................................................................82.6 Investor’s ratios.................................................................................................................................................102.7 Common-size.....................................................................................................................................................11Horizontal Analysis.......................................................................................................................................................142.8 DuPont analysis.................................................................................................................................................162.9 Segmental analysis............................................................................................................................................18.......................................................................................................................................................................................20.......................................................................................................................................................................................203.0 Advantages and disadvantages of analysis.............................................................................................................203.1 Financial Ratios Analysis..................................................................................................................................203.2 Common-size Analysis......................................................................................................................................213.3 DuPont Analysis................................................................................................................................................214.0 Contemporary Methods...........................................................................................................................................224.1 EMH..................................................................................................................................................................224.2 EVA...................................................................................................................................................................224.3 CAPM................................................................................................................................................................225.0 CONCLUSION.......................................................................................................................................................226.0 LIST OF REFERENCES........................................................................................................................................24APPENDIXES..............................................................................................................................................................26
Figure IndexFigure 1: Gross profit margin..........................................................................................................................................2Figure 2: OPM................................................................................................................................................................2Figure 3: Net Profit Margin............................................................................................................................................3Figure 4: ROCE..............................................................................................................................................................4Figure 5: Current Ratio...................................................................................................................................................4Figure 6: Quick Ratio......................................................................................................................................................5Figure 7: Days of Sales Outstanding...............................................................................................................................5Figure 8: Days of Inventory on Hand.............................................................................................................................6Figure 9: Days of Payables.............................................................................................................................................6Figure 10: Cash Conversion Cycle.................................................................................................................................7Figure 11: Debt-to-equity ratio.......................................................................................................................................7Figure 12: Gearing..........................................................................................................................................................8Figure 13: Operating cash flow to sales..........................................................................................................................8Figure 14: Operating cash flow to net profit...................................................................................................................9Figure 15: Cash flow to debt.........................................................................................................................................10Figure 16: Earnings Per Share......................................................................................................................................10Figure 17: Dividend Payout Ratio................................................................................................................................11Figure 18: Price Earnings Ratio....................................................................................................................................11Figure 19: Vertical SOPL.............................................................................................................................................12Figure 20: Vertical SOFP..............................................................................................................................................13Figure 21: Vertical Cash flow statement.......................................................................................................................13Figure 22: Horizontal SOPL.........................................................................................................................................14Figure 23: Horizontal SOFP.........................................................................................................................................15Figure 24: Horizontal Cash flow statement..................................................................................................................15Figure 25: 2 FACTORS ROA.......................................................................................................................................17Figure 26: 2 FACTORS ROE.......................................................................................................................................17Figure 27: UK Segment................................................................................................................................................19Figure 28: USA Segment..............................................................................................................................................20Figure 29: Other European Countries Segment............................................................................................................20Figure 30: Rest of the world Segment..........................................................................................................................21
1.0 INTRODUCTION1.1 Defining Strategic financial analysis and significance of financial analysisThe term strategic financial analysis is used for integrating data, analysing and then form decisions byincorporating accounting regulations. The strategic plan and financial objectives can be enhanced by getting intoaccount risk assessment metrics with ease (Cumming and Johan, 2017). The financial planning can be made anddecision-making can be done properly with main of increasing overall profitability position of company in effectualmanner. 1.2 Objective of projectMain objective of present project is to assess business performance of companies like Booker Group PLCand Tate & Lyle PLC for past five years and making comparison of financial health of companies. Furthermore,project will be made for describing, critically assess and evaluate the principal methods of accounts to firm’soutsider. Indicating shortcomings in process and proposing contemporary analysis methods for eradicatingshortcomings. Moreover, dynamic analysis of two companies will be made (Vanhegan and et.al., 2012). 1.3 Introducing two companiesBooker Group PLC and Tate & Lyle PLC are being taken which are under same segment of food industryand are bigger firms in terms of market capitalisation and consumer’s base (Laudon and Traver, 2013). BookerGroup PLC is British food wholesaler organisation based in UK. It was founded by George and Richard Booker in1835. It has various subsidiaries such as Makro, Booker Direct, Chef Direct, Family Shopper and many others. Itserves more than 1.5 million customers and has 13000 employees.Tate & Lyle PLC is British MNC started and run as agribusiness. In 1921, merger was formed by HenryTate & Sons and Abraham Lyle & Sons. It has employees strength of 4326 and provides food commodities tocustomers.1.4 Introducing methods of analysisThe financial methods used in present project are ratio analysis, common size method and DuPont analysis arebeing conducted. Ratio analysis is one of important technique for analysing health of company. Common size method analysis help to compare performances of firm with the help of base year quiteeffectually (Liang and et.al., 2016). DuPont analysis will also carried out for investors to under capitalstructure, asset efficiency and profit efficiency of two reputed firms.2.0 Calculation of RatiosRatio analysis is one of the widely used method for analysing financial performance of company in effectualmanner (Sheikhi, Ranjbar and Oraee, 2012). It can be analysed that financial ratios are computed for companywhich provide firm’s stakeholders with better decisions to be taken.1
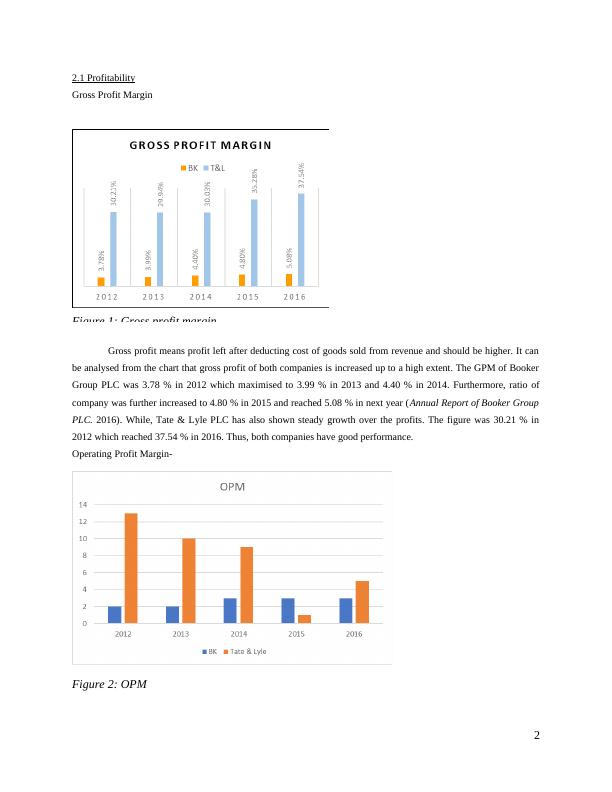
2.1 ProfitabilityGross Profit MarginFigure 1: Gross profit marginGross profit means profit left after deducting cost of goods sold from revenue and should be higher. It canbe analysed from the chart that gross profit of both companies is increased up to a high extent. The GPM of BookerGroup PLC was 3.78 % in 2012 which maximised to 3.99 % in 2013 and 4.40 % in 2014. Furthermore, ratio ofcompany was further increased to 4.80 % in 2015 and reached 5.08 % in next year (Annual Report of Booker GroupPLC. 2016). While, Tate & Lyle PLC has also shown steady growth over the profits. The figure was 30.21 % in2012 which reached 37.54 % in 2016. Thus, both companies have good performance.Operating Profit Margin-Figure 2: OPM2
Operating profit means profit left after deducting operational expenses of firm. The OPM is calculated forboth companies. Booker Group PLC had OPM in 2.3 % in 2012 which increased to 2.4 % in next year. Moreover, itreached 2.6 % and 3 % in next two years respectively. The figure reached to 3.1 % in 2016. On the other hand, it canbe analysed that OPM of Tate & Lyle PLC has considerably gone down up to a high extent (Tian and Yu, 2017). Itwas 13.1 % in 2012 and reached 5.4 % in 2016 which means that company has incurred lot of operating expensescausing fall down. Net Profit Margin-Figure 3: Net Profit MarginNet profit means that profit achieved after making deduction for taxes and interest from operating profit.Higher the profit, better for firm (El Kasmioui and Ceulemans, 2012). The net profit of Booker Group PLC hasincreased up to a high extent. This is evident from the fact that internet sales are increased leading to robust growthof company. On the other hand, good progress has been made by company. While, Tate & Lyle PLC shows thatNPM has decreased quite significantly as OPM has decreased (Annual Report of Tate and Lyle PLC. 2016). NPM ofcompany was 10 % in 2012 which reached to 8.4 % in next year and 9.9 % in 2014. Moreover, reach to 1.3 % in2015 and 6.9 % in 2016.Return on Capital Employed (ROCE)-3
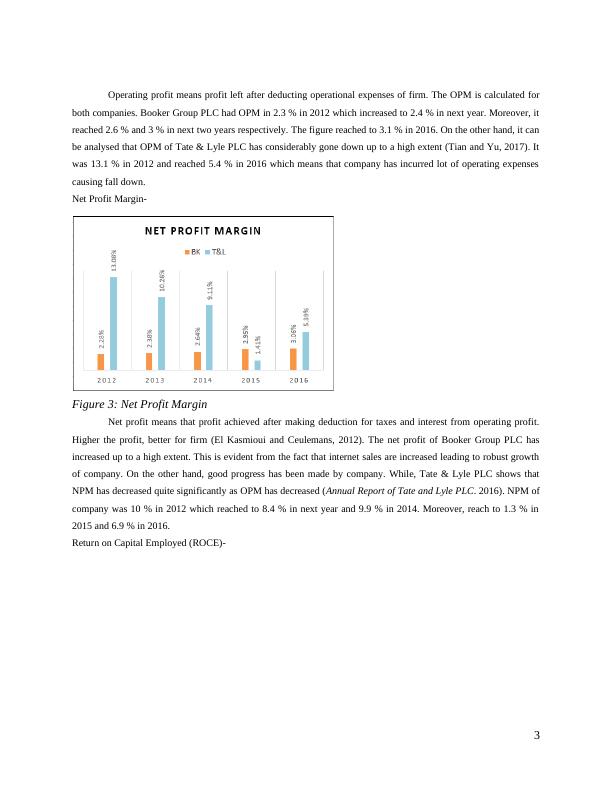
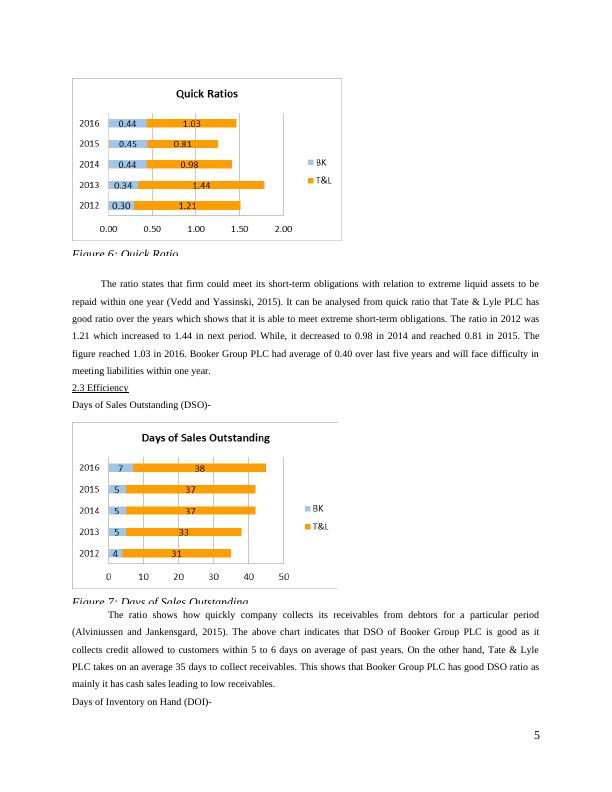
Figure 4: ROCEIt is the ratio which is used for assessing how much return is generated out of the capital invested (Michaeland Albert, 2015). ROCE of Booker Group PLC was 20.64 % in 2012 and reached 22.53 % in 2016. On the otherhand, Tate & Lyle PLC had 18.26 % in 2012 and 7.01 % in 2016. This effectively implies that ROCE has gonesignificantly of firm. This is evident from the fact that NPM, OPM, ROCE have gone down. Thus, ROCE of BookerGroup PLC is good in comparison to its rival (Sharma and et.al., 2012).2.2 LiquidityCurrent Ratio-Figure 5: Current RatioIt shows how efficient is company in meeting out its short-term obligations with ease (Xuân Vinh, 2015).The current ratio of Booker Group PLC was 0.85 in 2012 which increased to 0.87 in 2013. Furthermore, it can besaid that ratio reached 0.95 in 2016. Thus, current ratio is ideal for company and has good liquidity position. On theother side, Tate & Lyle PLC had ratio of 1.87 in 2012 which increased to 2.31 in effective manner. Further, figurereached 1.50 and 1.32 in 2014 and 2015 respectively. It reached 1.63 in 2016 which clarifies that firm has goodliquid assets in comparison to another firm (Doucette and et.al., 2012).Quick Ratio-4
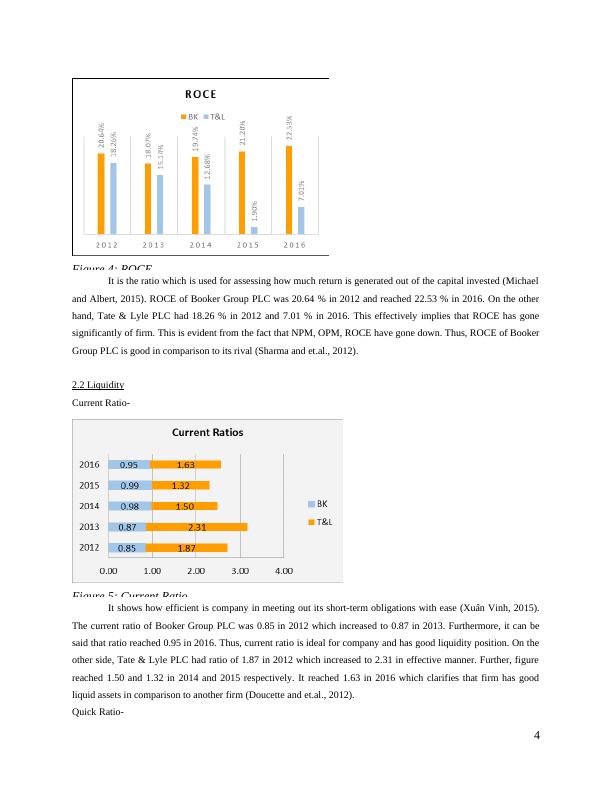
Figure 6: Quick RatioThe ratio states that firm could meet its short-term obligations with relation to extreme liquid assets to berepaid within one year (Vedd and Yassinski, 2015). It can be analysed from quick ratio that Tate & Lyle PLC hasgood ratio over the years which shows that it is able to meet extreme short-term obligations. The ratio in 2012 was1.21 which increased to 1.44 in next period. While, it decreased to 0.98 in 2014 and reached 0.81 in 2015. Thefigure reached 1.03 in 2016. Booker Group PLC had average of 0.40 over last five years and will face difficulty inmeeting liabilities within one year.2.3 EfficiencyDays of Sales Outstanding (DSO)-Figure 7: Days of Sales OutstandingThe ratio shows how quickly company collects its receivables from debtors for a particular period(Alviniussen and Jankensgard, 2015). The above chart indicates that DSO of Booker Group PLC is good as itcollects credit allowed to customers within 5 to 6 days on average of past years. On the other hand, Tate & LylePLC takes on an average 35 days to collect receivables. This shows that Booker Group PLC has good DSO ratio asmainly it has cash sales leading to low receivables.Days of Inventory on Hand (DOI)-5
End of preview
Want to access all the pages? Upload your documents or become a member.
Related Documents
Financial Statements Analysis Processlg...
|25
|4694
|27
Strategic Financial Analysis - Methods and Contemporary Approacheslg...
|69
|13055
|110
Strategic Financial Analysis TABLE OF CONTENTSlg...
|57
|13738
|400
Strategic Financial Analysislg...
|55
|8602
|68
Strategic Financial Analysis - Assignmentlg...
|32
|4920
|422
Strategic Financial Analysis 2022lg...
|35
|8266
|26