Strategic financial analysis and its importance
36 Pages5153 Words120 Views
Added on 2020-01-28
About This Document
STRATEGIC FINANCIAL ANALYSIS TABLE OF CONTENTS INTRODUCTION 1 Strategic financial analysis and its importance 1 Objectives 1 Overview of companies 1 Methods of analysis 1 RATIO ANALYSIS1 Profitability Ratios2 Liquidity Ratios 6 Profitability ratios8 Solvency ratio|12 Investor ratio13 COMMON –SIZE 15 Horizontal 15 Vertical analysis16 Du-Pont 16 Segmental revenues 17 ADVANTAGE AND DISADVANTAGE 17 Ratio analysis17 Du-Pont 18 Segmental |18 CONCLUSION
Strategic financial analysis and its importance
Added on 2020-01-28
ShareRelated Documents
STRATEGIC FINANCIALANALYSIS

TABLE OF CONTENTSINTRODUCTION...........................................................................................................................1Strategic financial analysis and its importance......................................................................1Objectives...............................................................................................................................1Overview of companies..........................................................................................................1Methods of analysis................................................................................................................1RATIO ANALYSIS.........................................................................................................................1Profitability Ratios..................................................................................................................2Liquidity Ratios......................................................................................................................6Efficiency ratios......................................................................................................................8Solvency ratio.......................................................................................................................12Investor ratio.........................................................................................................................13COMMON –SIZE..........................................................................................................................15Horizontal.............................................................................................................................15Vertical analysis...................................................................................................................16Du-Pont.................................................................................................................................16Segmental revenues..............................................................................................................17ADVANTAGE AND DISADVANTAGE....................................................................................17Ratio analysis........................................................................................................................17Du-Pont.................................................................................................................................18Segmental.............................................................................................................................18CONCLUSION & RECOMMENDATIONS................................................................................18Conclusion............................................................................................................................18Recommendation..................................................................................................................19CONTEMPROARY METHODS..................................................................................................19CAPM model........................................................................................................................19Efficient market hypothesis..................................................................................................19Economic value added (EVA)..............................................................................................20REFERENCES..............................................................................................................................21APPENDIX....................................................................................................................................23Wolseley’s ratio analysis......................................................................................................23
Booker’s ratio analysis.........................................................................................................24Wolseley’s vertical analysis of income statement................................................................25Wolseley’s vertical analysis of balance sheet......................................................................25Wolseley’s vertical analysis of cash flow statement............................................................27Booker’s vertical analysis of income statement...................................................................27Booker’s vertical analysis of balance sheet..........................................................................28Booker’s vertical analysis of statement of cash flows..........................................................29Wolseley’s horizontal analysis of statement of income statement.......................................30Wolseley’s horizontal analysis of statement of balance sheet..............................................30Wolseley’s horizontal analysis of statement of cash flows..................................................31Booker’s horizontal analysis of income statement...............................................................31Booker’s horizontal analysis of balance sheet......................................................................32Booker’s horizontal analysis of statement of cash flows.....................................................33
INTRODUCTIONStrategic financial analysis and its importance Strategic financial analysis (SFA) regards to the process of analyzing business financialperformance and thereby makes right decisions at the right time to drive success. There arenumber of tools and techniques available to the entrepreneur such as ratio analysis, horizontaland vertical analysis and many others. SFA is of utmost importance for the manager to determineand assess their financial difficulties, so that, managers, directors and executives can makequalitative decisions for accomplishing the defined targets and objectives. ObjectivesThe report targeted at analysing the financial position and operational performance of twoexisting companies, Wolseley and Booker. The report will make financial analysis of both thecompanies by applying ratio analysis and horizontal as well as vertical analysis of all thenecessary financial accounts profitability statement, cash flow statement and balance sheet.Moreover, it will also analyse the limitations of all the methods. Besides this, contemporarytechniques like Capital Assets pricing Model, Efficient Market Hypothesis and Economic ValueAdded will be analysed that how these techniques can assist business to examine and evaluatetheir success and operational excellence. Overview of companies Booker group is operating in food sector that offers variety of products and services tobuyers including grocers, restaurants and pub etc. Another organization is Wolseley deals in theconstruction of buildings. Methods of analysis Ratio analysis will be used to determine relationship between various elements offinancial statement. However, horizontal analysis will be used to examine volatility trend overthe years whereas vertical analysis technique will be incorporated to determine the relationshipof each and every element from the revenues and total assets. Besides this, Du-pont model andsegmental reports will be prepared for in-depth analysis of business performance. RATIO ANALYSISRatio analysis may be defined as a tool which helps in analyzing the financial statementsof the business organization in an effectual way. By this, financial health, performance andposition of the firm can be measured in against to the competitor. Besides this, by evaluating the1
own performance in against to the competitors business unit can take suitable decision for theimprovement purposs (Xu and et.al., 2014). The ratio analysis includes different types of ratiosby which analyser can interpret about the financial position of company. The different ratios aresuch as Profitability, liquidity, efficiency, solvency, gearing etc.Profitability RatiosProfitability ratios: This ratio helps in analyzing the profit margin generated by the firmduring the time frame over the expenses (Boer 2011). Hence, by making analysis of such ratiobusiness unit can take significant action or measure for enhancing the profit level. Gross margin indicates profit %age on total sales revenues generated during a specifiedperiod. 20122013201420152016Wolseley27.55%27.78%29.90%27.96%28.27%Booker3.78%3.99%4.40%4.80%5.08%Interpretation: Gross profit is companies profit which shows that how much cost ofgoods is covered and up to which extent the company is controlling over the cost (Kumbirai,2010). Graph revealed that in all the period, Wolseley’s gross margin is comparatively greaterthan that of Booker Group. Greater sales revenues and effective cost control over directexpenditures are the two reasons for excessive GM in Wolseley. It shows that it is generating2
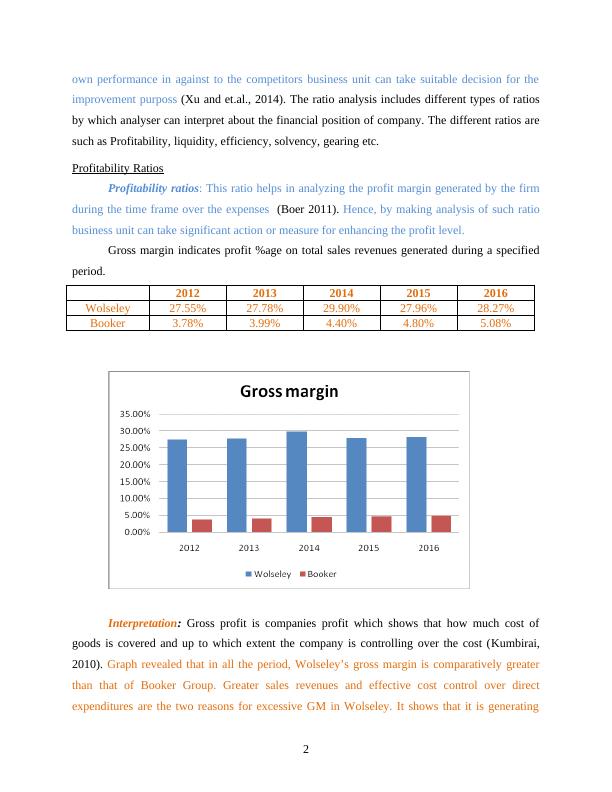
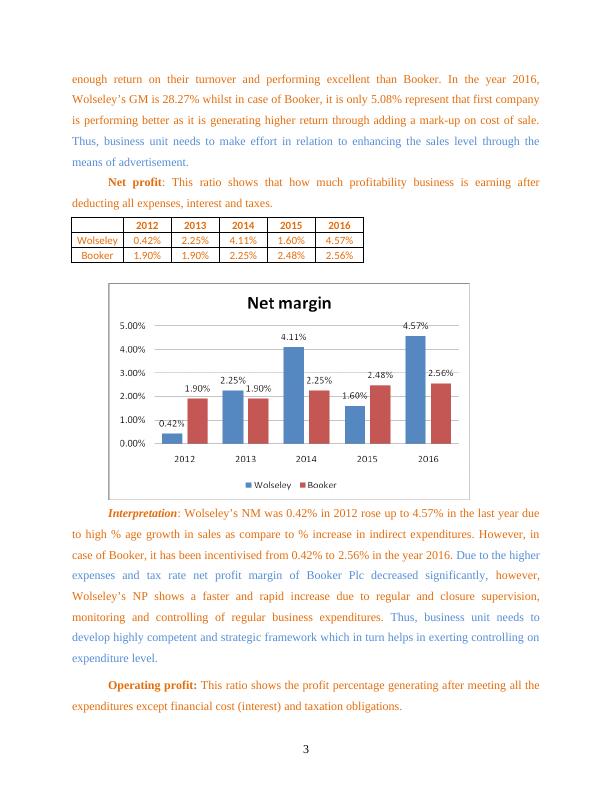
enough return on their turnover and performing excellent than Booker. In the year 2016,Wolseley’s GM is 28.27% whilst in case of Booker, it is only 5.08% represent that first companyis performing better as it is generating higher return through adding a mark-up on cost of sale.Thus, business unit needs to make effort in relation to enhancing the sales level through themeans of advertisement. Net profit: This ratio shows that how much profitability business is earning afterdeducting all expenses, interest and taxes.20122013201420152016Wolseley0.42%2.25%4.11%1.60%4.57%Booker1.90%1.90%2.25%2.48%2.56%Interpretation: Wolseley’s NM was 0.42% in 2012 rose up to 4.57% in the last year dueto high % age growth in sales as compare to % increase in indirect expenditures. However, incase of Booker, it has been incentivised from 0.42% to2.56% in the year 2016. Due to the higherexpenses and tax rate net profit margin of Booker Plc decreased significantly, however,Wolseley’s NP shows a faster and rapid increase due to regular and closure supervision,monitoring and controlling of regular business expenditures. Thus, business unit needs todevelop highly competent and strategic framework which in turn helps in exerting controlling onexpenditure level. Operating profit: This ratio shows the profit percentage generating after meeting all theexpenditures except financial cost (interest) and taxation obligations. 3
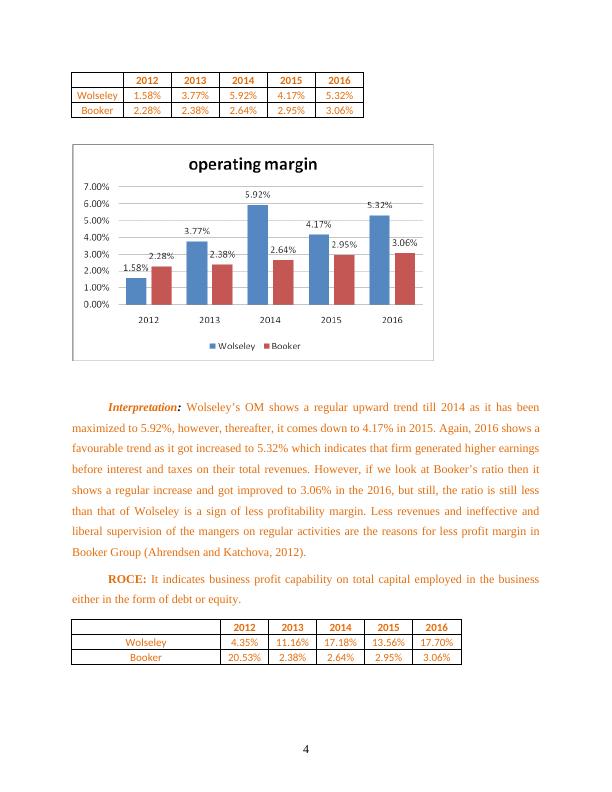
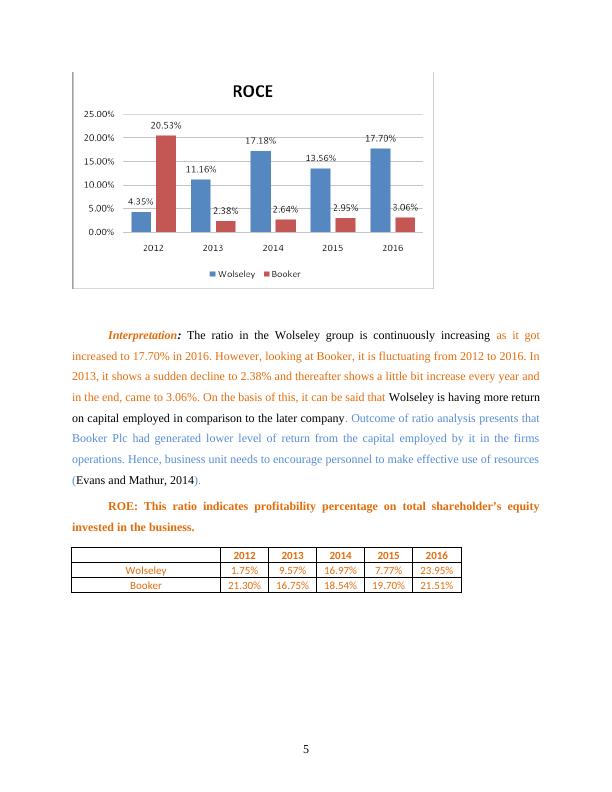
20122013201420152016Wolseley1.58%3.77%5.92%4.17%5.32%Booker2.28%2.38%2.64%2.95%3.06%Interpretation: Wolseley’s OM shows a regular upward trend till 2014 as it has beenmaximized to 5.92%, however, thereafter, it comes down to 4.17% in 2015. Again, 2016 shows afavourable trend as it got increased to 5.32% which indicates that firm generated higher earningsbefore interest and taxes on their total revenues. However, if we look at Booker’s ratio then itshows a regular increase and got improved to 3.06% in the 2016, but still, the ratio is still lessthan that of Wolseley is a sign of less profitability margin. Less revenues and ineffective andliberal supervision of the mangers on regular activities are the reasons for less profit margin inBooker Group (Ahrendsen and Katchova, 2012).ROCE: It indicates business profit capability on total capital employed in the businesseither in the form of debt or equity. 20122013201420152016Wolseley4.35%11.16%17.18%13.56%17.70%Booker20.53%2.38%2.64%2.95%3.06%4
Interpretation: The ratio in the Wolseley group is continuously increasing as it gotincreased to 17.70% in 2016. However, looking at Booker, it is fluctuating from 2012 to 2016. In2013, it shows a sudden decline to 2.38% and thereafter shows a little bit increase every year andin the end, came to 3.06%. On the basis of this, it can be said that Wolseley is having more returnon capital employed in comparison to the later company. Outcome of ratio analysis presents thatBooker Plc had generated lower level of return from the capital employed by it in the firmsoperations. Hence, business unit needs to encourage personnel to make effective use of resources(Evans and Mathur, 2014). ROE: This ratio indicates profitability percentage on total shareholder’s equityinvested in the business.20122013201420152016Wolseley1.75%9.57%16.97%7.77%23.95%Booker21.30%16.75%18.54%19.70%21.51%5
End of preview
Want to access all the pages? Upload your documents or become a member.
Related Documents
MOD000983 Strategic Financial Analysislg...
|29
|6247
|271
Strategic Financial Analysis - Assignmentlg...
|32
|4920
|422
15622051 Strategic financiallg...
|29
|8287
|39
Importance of Strategic Financial Analysis (SFA)lg...
|22
|5476
|180
Strategic Financial Analysis - Methods and Contemporary Approacheslg...
|69
|13055
|110
Financial Statements Analysis Processlg...
|25
|4694
|27