Strategic Management: Portfolio Analysis Essay, System04104, 2019
VerifiedAdded on 2022/09/14
|11
|3371
|14
Essay
AI Summary
This essay delves into the concept of portfolio analysis as a crucial tool for strategic management, enabling organizations to effectively manage their products or business units within the market. It examines how portfolio analysis aids in formulating short-term and long-term organizational strategies, ensuring market share growth and competitive advantage. The essay highlights the significance of portfolio models like the BCG Matrix and GE McKinsey Matrix, detailing their methodologies for assessing product portfolios based on market share, market growth, market attractiveness, and business strength. It illustrates how companies like Unilever can leverage these models to make informed investment decisions, prioritize product development, and optimize resource allocation. Furthermore, it discusses the strategic implications of these models for achieving market growth and profitability, while also acknowledging their limitations and criticisms.

Running Head: Strategic Management
Portfolio Analysis
Essay
System04104
8/26/2019
Portfolio Analysis
Essay
System04104
8/26/2019
Paraphrase This Document
Need a fresh take? Get an instant paraphrase of this document with our AI Paraphraser
Strategic Management 1
Portfolio Analysis
Portfolio analysis is a tool that enables the organisation to develop a proper strategy, which is
helpful for the company to handle their products or business units in the market. Although,
some scholars refer it as a strategy formulation technique that helps the organisation to
manage their investments or products, but they often ignore that a good designed portfolio
analysis also helps the organisation to determine their organisational strategy in both short
term and long term. The major approach in the portfolio analysis is that it supports the
business operation and ensures better market share and growth in the market and face the
competition with best marketing strategy. The purpose of portfolio analysis is to ensure that
organisational strategic objectives can easily be achieved (Salo, Keisler, and Morton, 2011).
Although many companies depend on various diversified strategies of portfolio analysis that
helps the company to achieve the strategic goals of the organisation. The best portfolio
management approach of any organisation is that enables the organisation to exploit best
market for the company. However, it has been seen that a large organisation has several small
subsidiaries companies, but the parent company formulates its own business level strategy
through which other firm’s strategy is connected.
Managing portfolio in the organisation is an essential function for the management
department that ensure maximum revenues on various products and services offered by the
organisation. The portfolio management strategy can be in both short-term and long-term
goals. Portfolio analysis helps the business organisation to develop growth strategies and
launch new product or portfolio in the market to enhance the profit and returns of the
company in a particular period. Portfolio analysis also helps to determine whether a particular
product or services should be retained in future or abolished from the market. However, the
portfolio analysis includes a variety of decisions that enables the business organisation to
ensure long-term gains and returns (Afonina and Chalupský, 2012).
One of the popular portfolio models that is used in large business organisations is called
‘BCG Matrix’ model. BCG matrix or Boston growth share matrix is an assessment model,
which is used in the organisations. There are two factors that is assessed under this model are
relative market share and the market growth potential of a certain product or business unit.
This strategic model helps to analyse the status of various portfolio or products in the market
and analyse the competitive situation of other products. The BCG matrix classified the
Strategic Management 2
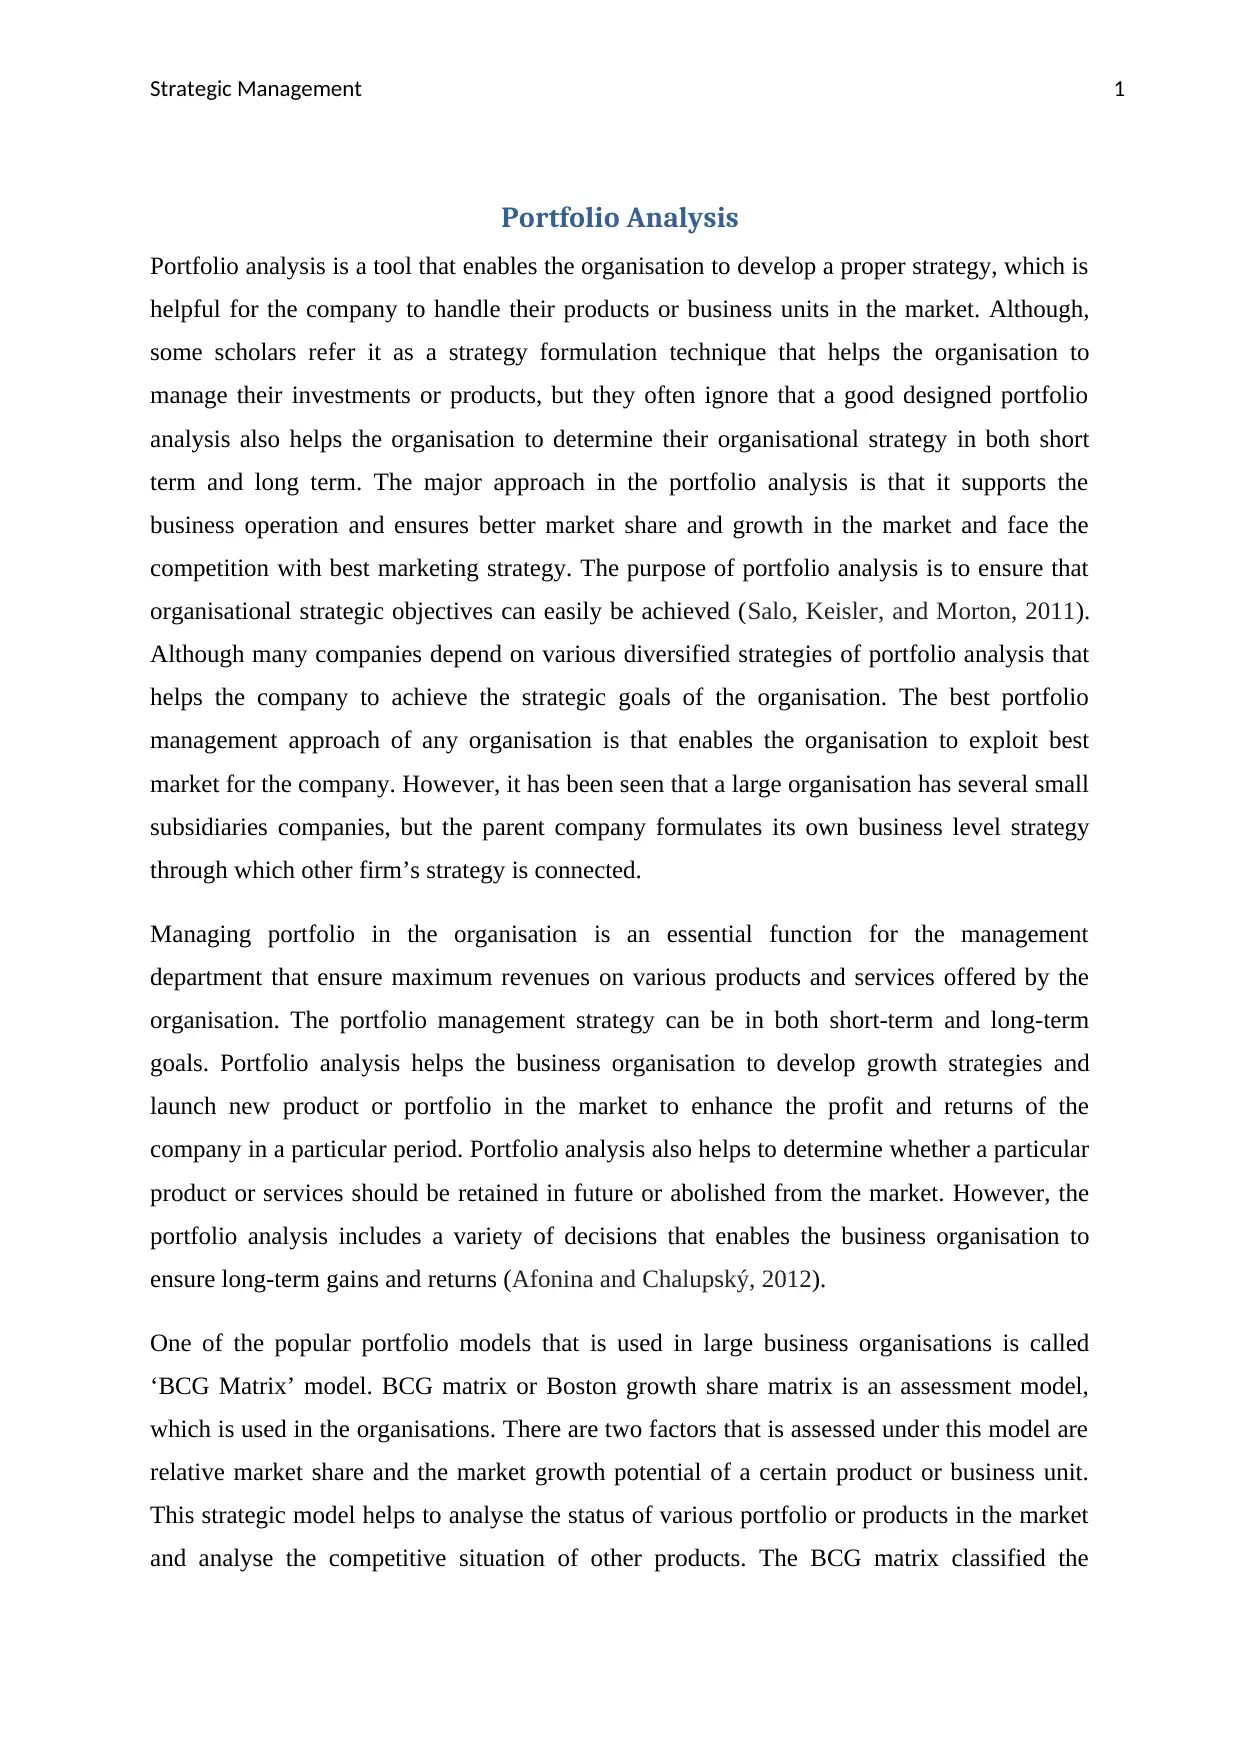
products on low or high market share or low or high market growth of a particular product or
business unit (Amatulli, Caputo, and Guido, 2011).
(Source: Sargeant and Jay, 2014)
BCG matrix divides the products in four quadrants that are question marks, stars, dogs, and
cash cow. The question mark shows those portfolio or products, which have high market
demand and low market share (Pidun, et. al., 2011). The star category of products or portfolio
shows the high market share of particular r products or SBU’s of the business organisation
while the Cash cows shows the high market share and low market growth rate of the product
or product groups. However, the Dog quadrants in the graph show the low market share and
low market growth rate of particular products or SBUs. On the basis of above analysis, a
business organisation can make their strategy that how they can manage their portfolio in the
market (Aspara, Lamberg, Laukia, and Tikkanen, 2011).
⊘ This is a preview!⊘
Do you want full access?
Subscribe today to unlock all pages.
Trusted by 1+ million students worldwide
Strategic Management 3
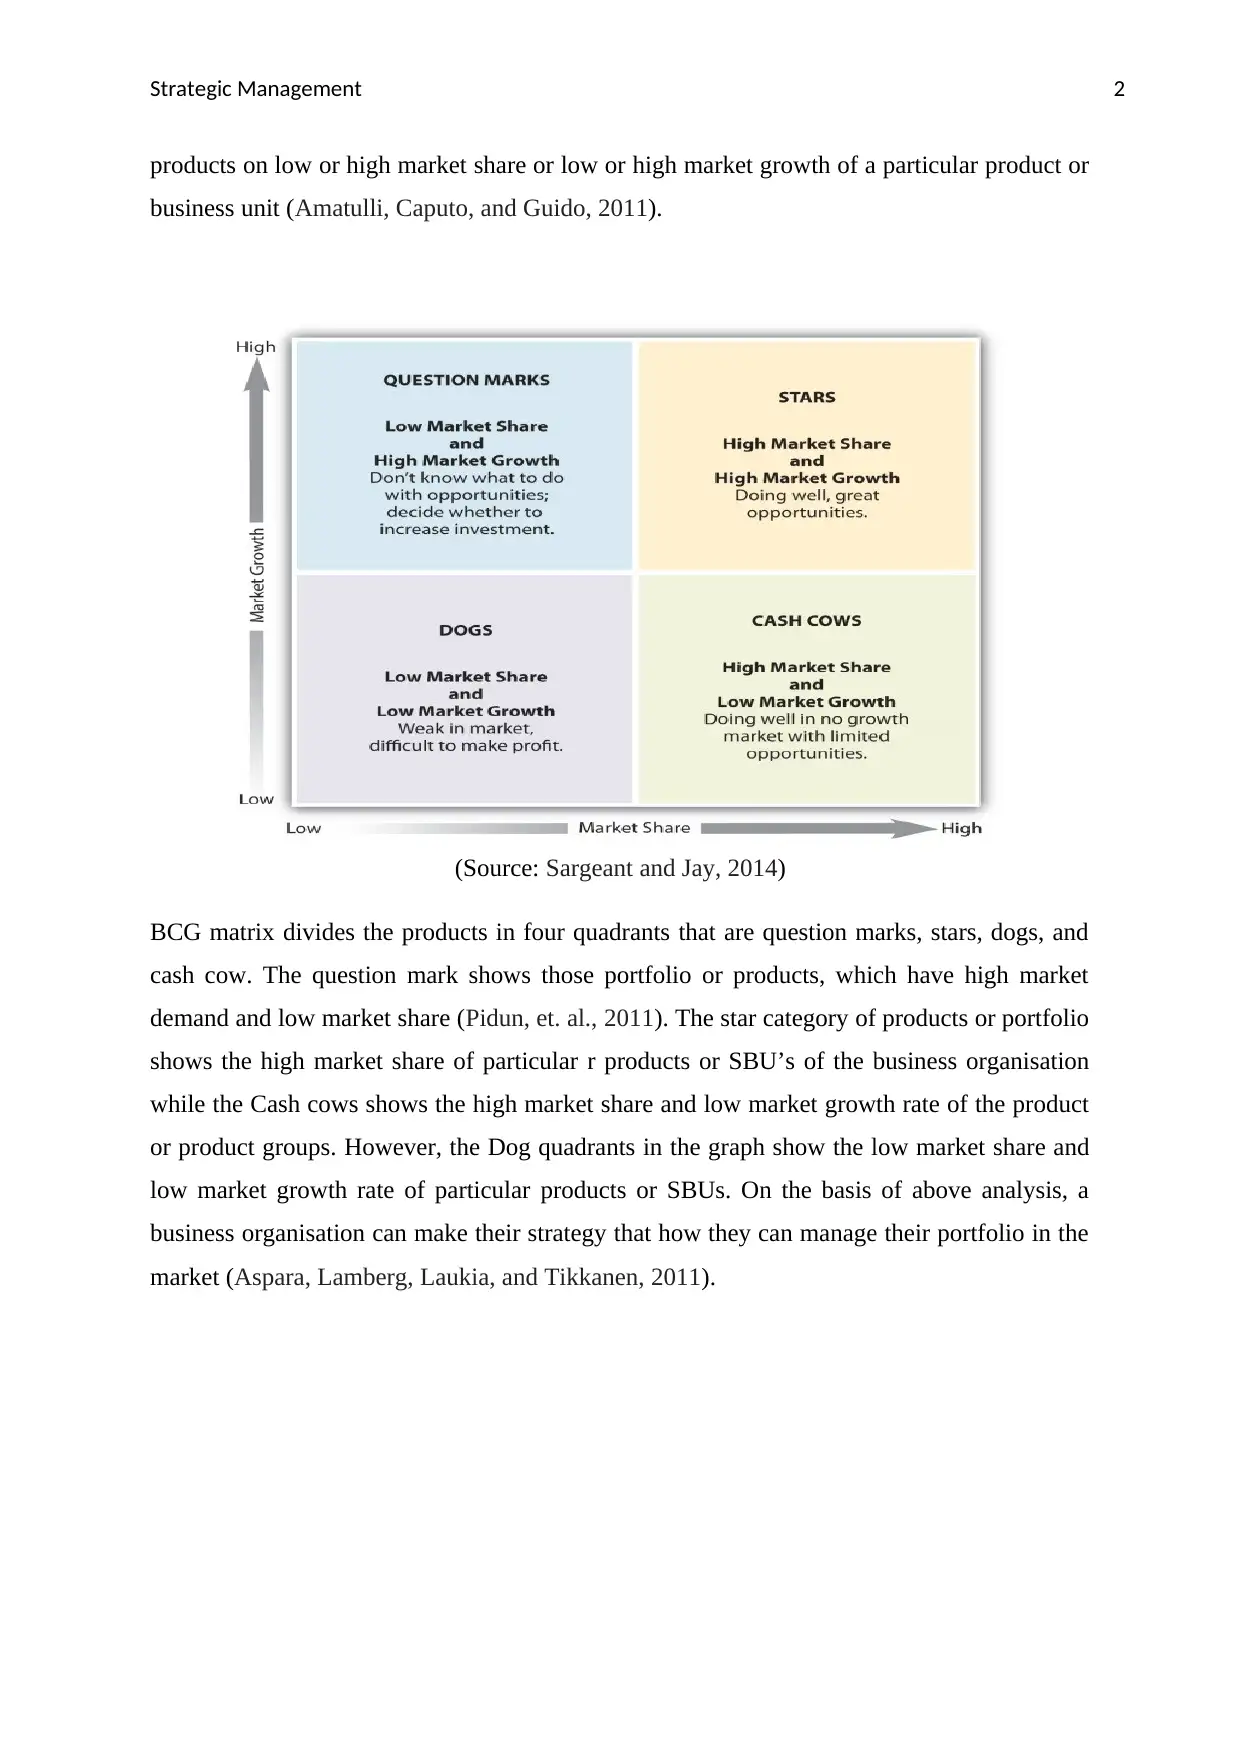
(Source: Sargeant and Jay, 2014)
For example, if we analyse the Unilever then it can easily be seen that company needs to
focus or prioritise the Lifebuoy product, wheel etc. and should give more priority to these
products. Unilever should prioritise these products because these products have high growth
rate but low market share. Apart from this, the Dog section shows those products, which
cannot be profitable for the company because it has low growth rate and low market, share. It
means the company need to kill these products from the market and prioritise that product
that has opportunities of high market growth rate or high market share (Haltofová and
Štěpánková, 2014). Apart from this, the company needs to invest in the Cash cow portfolio
group where company has option to increase their market share with increasing the high
growth rate by doing investment. The star section needs divestment of money from these
sections because this group of products do not need advertising or additional expenses from
the company because these products have already high market growth and high market share
such as Lux, Fair & Lovely, etc. However, it can be said that BCG matrix helps the
organisation to make strategy for the various portfolio and products for the future market
growth and increasing the market share. Although this strategy avoids the future uncertainties
or conditions because it may be possible that a small change in the product may change the
Paraphrase This Document
Need a fresh take? Get an instant paraphrase of this document with our AI Paraphraser
Strategic Management 4
scenario about a product and enhance the demand and growth of the product in the market
(Demil and Lecocq, 2010).
The strategic implication of BCG matrix is to gain market growth and profit. The major
objective of the corporate organisation through the portfolio analysis is to analyse that how
cash resources can be used to maximise the growth and profitability of the organisation. One
of the popular portfolio management models is ‘Modern Portfolio Model’. This model is
given by Markowitz who made all the assumptions in this theory (Ionescu, 2011). The
modern portfolio theory is criticised by many people because it depends on research from
various fields of study, especially it is based on the behavioural economics. This theory based
on the assumptions of volatility. According to this theory, organisational decisions to invest
in particular products or services are directly related to risk factors and when they need
higher returns on products, they need to bear more risks factor. However, when organisations
accept lower returns they bear low risk (Jenkins and Williamson, 2015). The behavioural
economics said that the expectations of organisations on earning returns on the investment
are biased by many factors. This is generally the portfolio theory for financial products or
securities, but it also applies on other organisations to make strategy related to product
positioning in the market. Apart from this, this model ignores the other important factors like
sustainable competitive advantage or marketing strategies of competitors etc. in shadow of
market growth and market share. The assumption made by Markowitz in this theory that
“investors’ acting rationally’ is criticised by many scholars (Salo, Keisler, and Morton, 2011).
However, the behaviour economics challenged the assumption that all investors have same
intention of earing returns on their investment such as dog products in BCG matrix. However,
the use and importance of BCG matrix is limited to a diversified group of business
organisation and apply on these organisations to enhance the profit and market share of the
various products through the use of financial investment in the promotion or growth in the
product portfolios (Nippa, Pidun, and Rubner, 2011). However, the BCG matrix has also
faced the greater level of criticism among all the portfolio models. The major criticism of this
model is that it analyses the business unit only on two factors growth rate and market share.
This is the reason this model is assumed to be too simplistic and misleading for most of the
companies. This model does not take the other factors such as market size, profit margin, or
entry barriers etc. The BCG matrix also ignores the factors related to competitive strengths
such as price competitiveness and geographical advantage, product quality etc. Another
drawback of this model that it measures all the four cells in high and low measures.
Strategic Management 5
According to Hofer and Schendel, the world is not containing with only high and low
measure rather an intermediate factor like ‘medium’ can be used to analyse the status of
portfolios in the market (Udo-Imeh, Edet, and Anani, 2012).
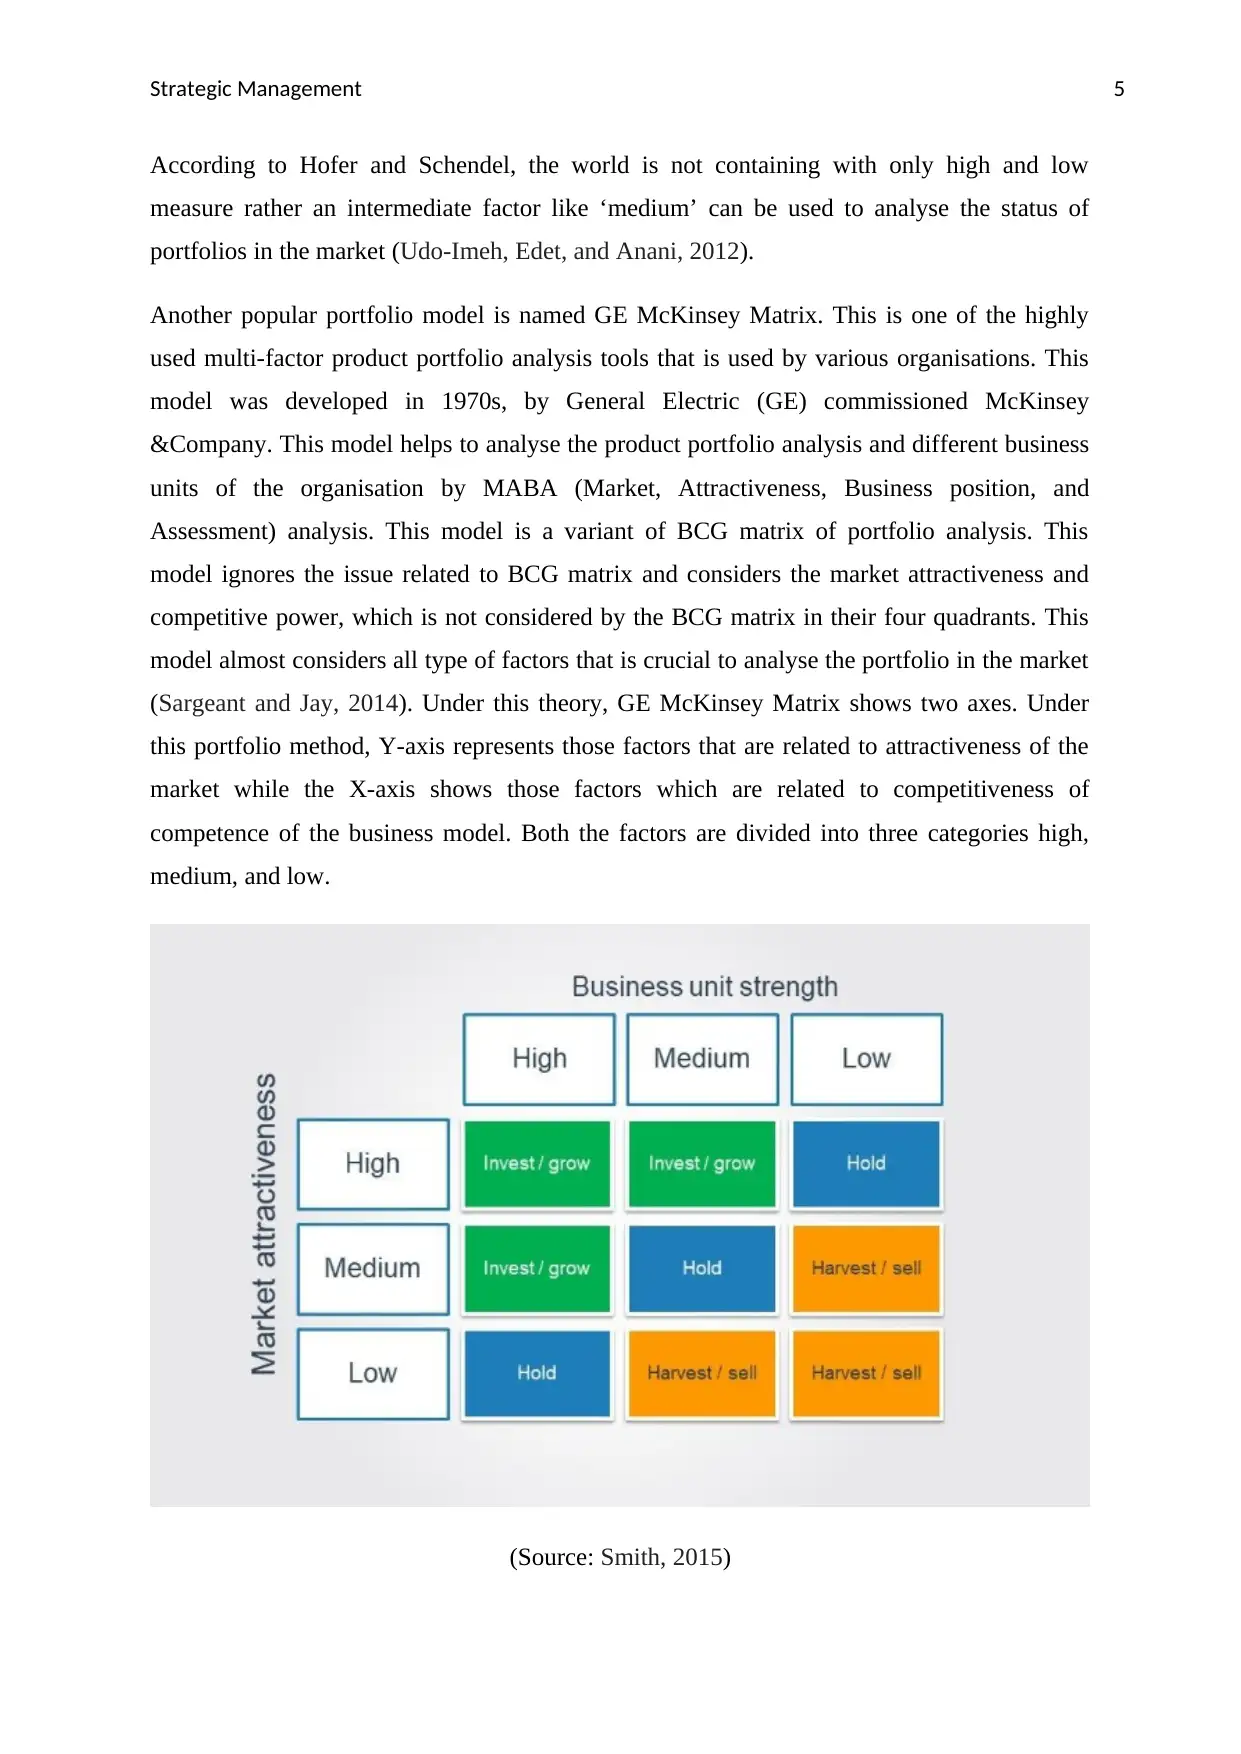
Another popular portfolio model is named GE McKinsey Matrix. This is one of the highly
used multi-factor product portfolio analysis tools that is used by various organisations. This
model was developed in 1970s, by General Electric (GE) commissioned McKinsey
&Company. This model helps to analyse the product portfolio analysis and different business
units of the organisation by MABA (Market, Attractiveness, Business position, and
Assessment) analysis. This model is a variant of BCG matrix of portfolio analysis. This
model ignores the issue related to BCG matrix and considers the market attractiveness and
competitive power, which is not considered by the BCG matrix in their four quadrants. This
model almost considers all type of factors that is crucial to analyse the portfolio in the market
(Sargeant and Jay, 2014). Under this theory, GE McKinsey Matrix shows two axes. Under
this portfolio method, Y-axis represents those factors that are related to attractiveness of the
market while the X-axis shows those factors which are related to competitiveness of
competence of the business model. Both the factors are divided into three categories high,
medium, and low.
(Source: Smith, 2015)
According to Hofer and Schendel, the world is not containing with only high and low
measure rather an intermediate factor like ‘medium’ can be used to analyse the status of
portfolios in the market (Udo-Imeh, Edet, and Anani, 2012).
Another popular portfolio model is named GE McKinsey Matrix. This is one of the highly
used multi-factor product portfolio analysis tools that is used by various organisations. This
model was developed in 1970s, by General Electric (GE) commissioned McKinsey
&Company. This model helps to analyse the product portfolio analysis and different business
units of the organisation by MABA (Market, Attractiveness, Business position, and
Assessment) analysis. This model is a variant of BCG matrix of portfolio analysis. This
model ignores the issue related to BCG matrix and considers the market attractiveness and
competitive power, which is not considered by the BCG matrix in their four quadrants. This
model almost considers all type of factors that is crucial to analyse the portfolio in the market
(Sargeant and Jay, 2014). Under this theory, GE McKinsey Matrix shows two axes. Under
this portfolio method, Y-axis represents those factors that are related to attractiveness of the
market while the X-axis shows those factors which are related to competitiveness of
competence of the business model. Both the factors are divided into three categories high,
medium, and low.
(Source: Smith, 2015)
⊘ This is a preview!⊘
Do you want full access?
Subscribe today to unlock all pages.
Trusted by 1+ million students worldwide
Strategic Management 6
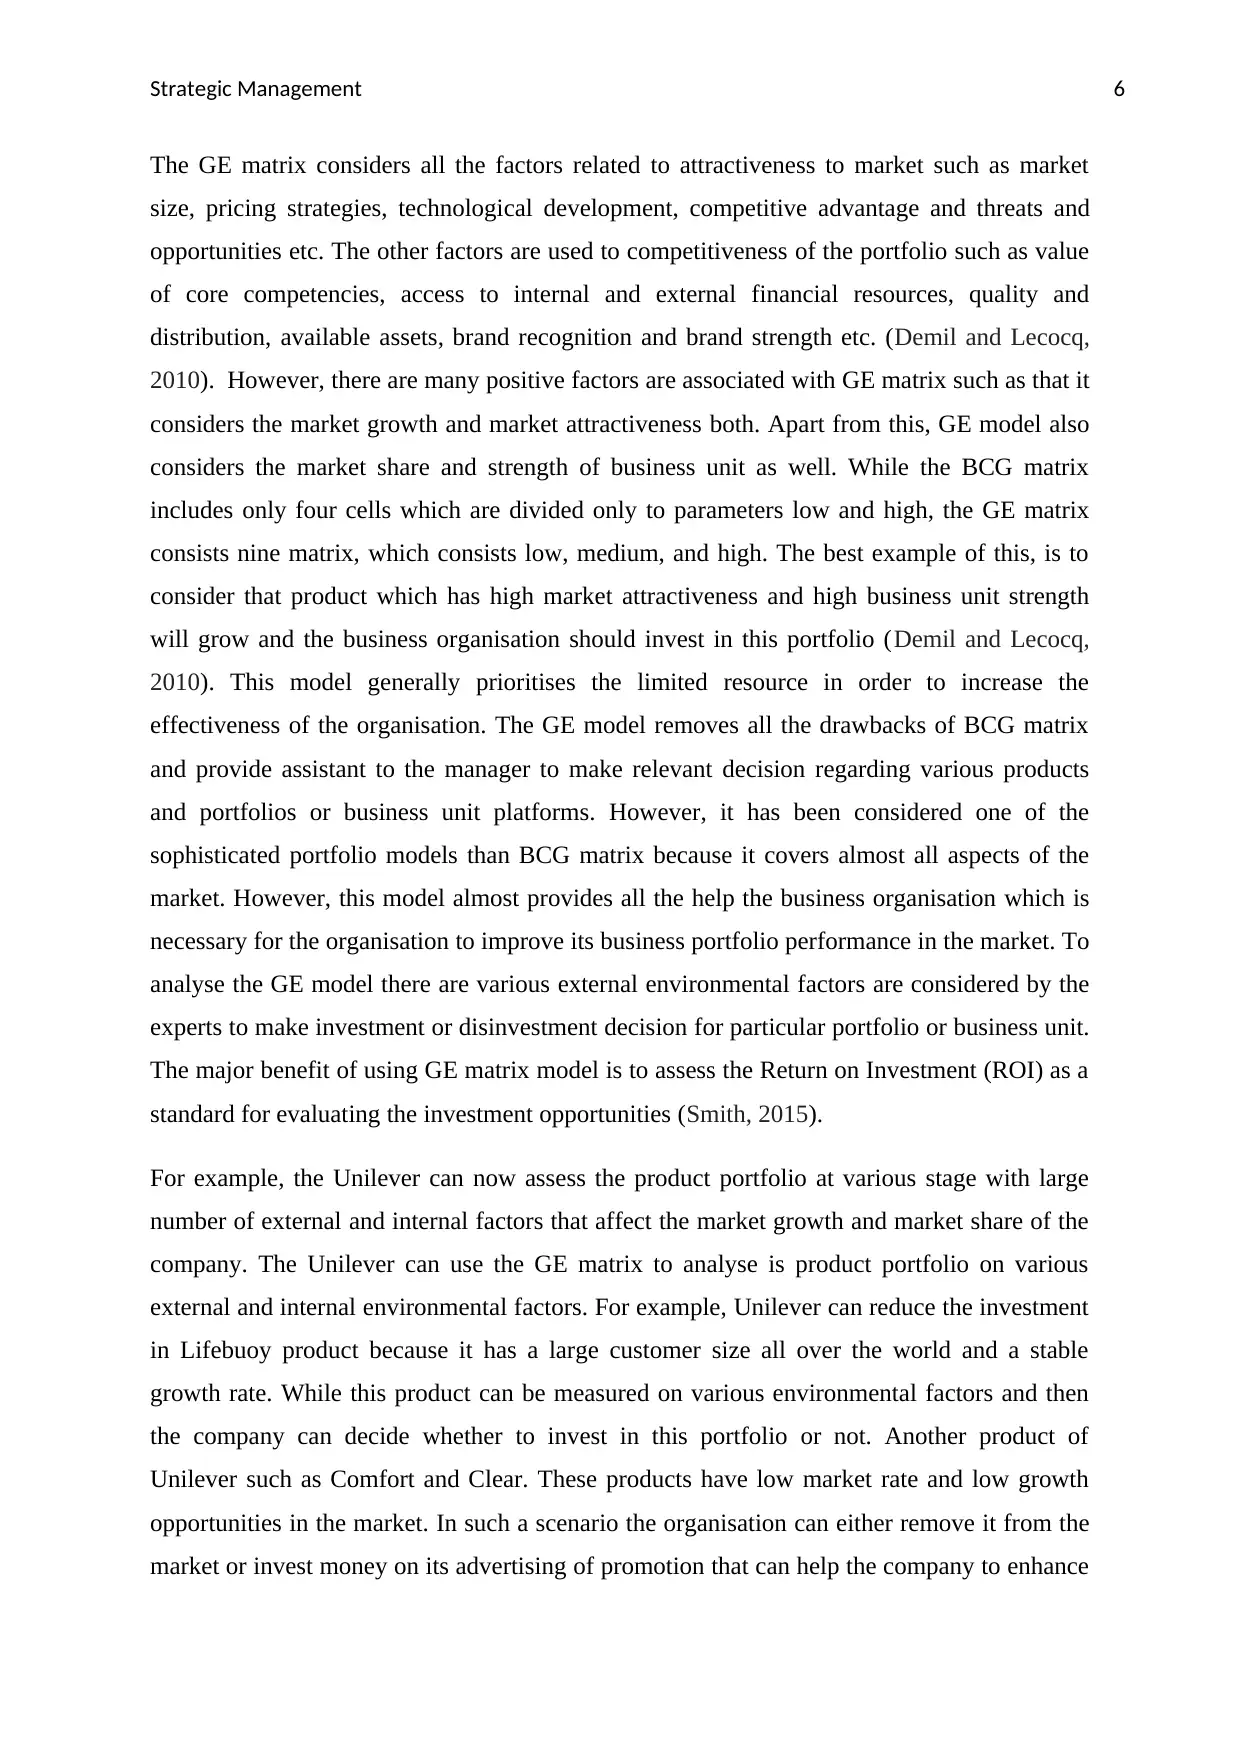
The GE matrix considers all the factors related to attractiveness to market such as market
size, pricing strategies, technological development, competitive advantage and threats and
opportunities etc. The other factors are used to competitiveness of the portfolio such as value
of core competencies, access to internal and external financial resources, quality and
distribution, available assets, brand recognition and brand strength etc. (Demil and Lecocq,
2010). However, there are many positive factors are associated with GE matrix such as that it
considers the market growth and market attractiveness both. Apart from this, GE model also
considers the market share and strength of business unit as well. While the BCG matrix
includes only four cells which are divided only to parameters low and high, the GE matrix
consists nine matrix, which consists low, medium, and high. The best example of this, is to
consider that product which has high market attractiveness and high business unit strength
will grow and the business organisation should invest in this portfolio (Demil and Lecocq,
2010). This model generally prioritises the limited resource in order to increase the
effectiveness of the organisation. The GE model removes all the drawbacks of BCG matrix
and provide assistant to the manager to make relevant decision regarding various products
and portfolios or business unit platforms. However, it has been considered one of the
sophisticated portfolio models than BCG matrix because it covers almost all aspects of the
market. However, this model almost provides all the help the business organisation which is
necessary for the organisation to improve its business portfolio performance in the market. To
analyse the GE model there are various external environmental factors are considered by the
experts to make investment or disinvestment decision for particular portfolio or business unit.
The major benefit of using GE matrix model is to assess the Return on Investment (ROI) as a
standard for evaluating the investment opportunities (Smith, 2015).
For example, the Unilever can now assess the product portfolio at various stage with large
number of external and internal factors that affect the market growth and market share of the
company. The Unilever can use the GE matrix to analyse is product portfolio on various
external and internal environmental factors. For example, Unilever can reduce the investment
in Lifebuoy product because it has a large customer size all over the world and a stable
growth rate. While this product can be measured on various environmental factors and then
the company can decide whether to invest in this portfolio or not. Another product of
Unilever such as Comfort and Clear. These products have low market rate and low growth
opportunities in the market. In such a scenario the organisation can either remove it from the
market or invest money on its advertising of promotion that can help the company to enhance
Paraphrase This Document
Need a fresh take? Get an instant paraphrase of this document with our AI Paraphraser
Strategic Management 7
its demand in the market. However, the option of measuring the performance of different
product portfolio or SBU on large number of external and internal environmental factors
make it more attractive and beneficial for any business organisation (Smith, 2015).
(Source: Smith, 2015)
GE matrix portfolio model is almost similar to the BC matrix because both models are used
to analyse the business unit portfolio and facilitate the management to make investment
decisions. But there are several criticisms of this model which were raised by the various
scholars and researchers. However, this model needs highly technical knowledge and
expertness to determine various industrial attractiveness. Without proper knowledge of
product portfolio and its market, it is impossible to determine the investment decision
(Srivastava and Prakash, 2011). GE matrix is very costly to conduct so most of the
organisation to use this portfolio model to analyse the portfolio and market growth of any
business unit. Another important issue with this model is that there are various factors need to
be analysed first such as external and internal environmental factors and collection of
Strategic Management 8
information related to competitive analysis. The GE matrix almost ignore the future changes
and only consider the current situation of SBU and it is really a dangerous thing for the
organisation. Even the GE matrix does not consider that what will be the position of the
product in the future due to change in the product life-cycle. One of the key issues that cannot
be ignored in this model that this model often affected with the individual biases because
assessing the market attractiveness and firm position is based on some subjective process.
Therefore, the chances of biases are more than any other portfolio model in the GE matrix
model. However, somewhere it is found that result of this model is very sensitive to the
definition of business market (Rothaermel, 2013).
In conclusion, portfolio analysis is a strategic tool and it helps the manager to analyse the
strength and weakness of firm’s small business unit or product portfolio and determine that
whether the portfolio is appropriate to fulfil long term goals of the organisation such as
profitability and growth. It is really important for a manager to analyse a suitable portfolio
model to enhance and market growth and market share of the product portfolio of the
company. The portfolio analysis really helps the business organisations to determine various
external and internal factors that affect the growth of the firm and its profitability. The
manager of the organisation decides on the result of various portfolio model whether
organisation should invest on particular portfolio or SBU or whether organisation should
disinvest their money from the portfolio. One of the famous portfolio models, BCG matrix is
known for its portfolio analysis, but it has some limitations such as it considers only two
factors and avoid the future changes that might affect the portfolio due to change in product
life cycle. However, the other model named GE matrix avoid some of the drawbacks of this
model, but it has its own limitations that affect the investment decision of manager in SBU or
product portfolio. One of the major issues is related with GE matrix model that it is based on
subjective process and affected by individual biases.
⊘ This is a preview!⊘
Do you want full access?
Subscribe today to unlock all pages.
Trusted by 1+ million students worldwide
Strategic Management 9
References
Afonina, A. and Chalupský, V. (2012) The current strategic management tools and
techniques: The evidence from Czech Republic. Economics and management, 17(4),
pp.1535-1544.
Amatulli, C., Caputo, T. and Guido, G. (2011) Strategic analysis through the general
electric/McKinsey Matrix: An application to the Italian fashion industry. International
Journal of Business and Management, 6(5), p.61.
Aspara, J., Lamberg, J.A., Laukia, A. and Tikkanen, H. (2011) Strategic management of
business model transformation: lessons from Nokia. Management Decision, 49(4), pp.622-
647.
Demil, B. and Lecocq, X. (2010) Business model evolution: in search of dynamic
consistency. Long range planning, 43(2-3), pp.227-246.
Haltofová, P. and Štěpánková, P. (2014) An Application of the Boston Matrix within
Financial Analysis of NGOs. Procedia-Social and Behavioral Sciences, 147, pp.56-63.
Ionescu, F.T. (2011) Boston consulting group II–a business portfolio analysis
matrix. International Journal of Economic Practices and Theories, 1(2), pp.65-70.
Jenkins, W. and Williamson, D. (2015) Strategic management and business analysis.
Routledge.
Nippa, M., Pidun, U. and Rubner, H. (2011) Corporate portfolio management: Appraising
four decades of academic research. Academy of Management Perspectives, 25(4), pp.50-66.
Pidun, U., Rubner, H., Krühler, M., Untiedt, R., Boston Consulting Group and Nippa, M.
(2011) Corporate portfolio management: Theory and practice. Journal of Applied Corporate
Finance, 23(1), pp.63-76.
Rothaermel, F.T. (2013) Strategic management: concepts. New York, NY: McGraw-Hill
Irwin.
Salo, A., Keisler, J. and Morton, A. (2011) Portfolio decision analysis: improved methods for
resource allocation(Vol. 162). Springer Science & Business Media.
Paraphrase This Document
Need a fresh take? Get an instant paraphrase of this document with our AI Paraphraser
Strategic Management 10
Salo, A., Keisler, J. and Morton, A. (2011) An invitation to portfolio decision analysis.
In Portfolio decision analysis (pp. 3-27). Springer, New York, NY.
Sargeant, A. and Jay, E. (2014) Fundraising management: analysis, planning and practice.
Routledge.
Smith, C. (2015) Portfolio Management. Wiley Encyclopedia of Management, pp.1-3.
Srivastava, R. and Prakash, A. (2011) Growth-share matrix as a tool for portfolio planning:
Evidence from the Indian telecommunication services industry. IUP Journal of Business
Strategy, 8(2), p.22.
Udo-Imeh, P.T., Edet, W.E. and Anani, R.B. (2012) Portfolio analysis models: a
review. European Journal of Business and Management, 4(18), pp.101-117.
Udo-Imeh, P.T., Edet, W.E. and Anani, R.B. (2012) Portfolio analysis models: a
review. European Journal of Business and Management, 4(18), pp.101-117.
1 out of 11
Related Documents


Your All-in-One AI-Powered Toolkit for Academic Success.
+13062052269
info@desklib.com
Available 24*7 on WhatsApp / Email
![[object Object]](/_next/static/media/star-bottom.7253800d.svg)
Unlock your academic potential
Copyright © 2020–2025 A2Z Services. All Rights Reserved. Developed and managed by ZUCOL.