Strategic Management Portfolio Analysis
Added on 2022-09-14
11 Pages3371 Words14 Views
Running Head: Strategic Management
Portfolio Analysis
Essay
System04104
8/26/2019
Portfolio Analysis
Essay
System04104
8/26/2019

Strategic Management 1
Portfolio Analysis
Portfolio analysis is a tool that enables the organisation to develop a proper strategy, which is
helpful for the company to handle their products or business units in the market. Although,
some scholars refer it as a strategy formulation technique that helps the organisation to
manage their investments or products, but they often ignore that a good designed portfolio
analysis also helps the organisation to determine their organisational strategy in both short
term and long term. The major approach in the portfolio analysis is that it supports the
business operation and ensures better market share and growth in the market and face the
competition with best marketing strategy. The purpose of portfolio analysis is to ensure that
organisational strategic objectives can easily be achieved (Salo, Keisler, and Morton, 2011).
Although many companies depend on various diversified strategies of portfolio analysis that
helps the company to achieve the strategic goals of the organisation. The best portfolio
management approach of any organisation is that enables the organisation to exploit best
market for the company. However, it has been seen that a large organisation has several small
subsidiaries companies, but the parent company formulates its own business level strategy
through which other firm’s strategy is connected.
Managing portfolio in the organisation is an essential function for the management
department that ensure maximum revenues on various products and services offered by the
organisation. The portfolio management strategy can be in both short-term and long-term
goals. Portfolio analysis helps the business organisation to develop growth strategies and
launch new product or portfolio in the market to enhance the profit and returns of the
company in a particular period. Portfolio analysis also helps to determine whether a particular
product or services should be retained in future or abolished from the market. However, the
portfolio analysis includes a variety of decisions that enables the business organisation to
ensure long-term gains and returns (Afonina and Chalupský, 2012).
One of the popular portfolio models that is used in large business organisations is called
‘BCG Matrix’ model. BCG matrix or Boston growth share matrix is an assessment model,
which is used in the organisations. There are two factors that is assessed under this model are
relative market share and the market growth potential of a certain product or business unit.
This strategic model helps to analyse the status of various portfolio or products in the market
and analyse the competitive situation of other products. The BCG matrix classified the
Strategic Management 2
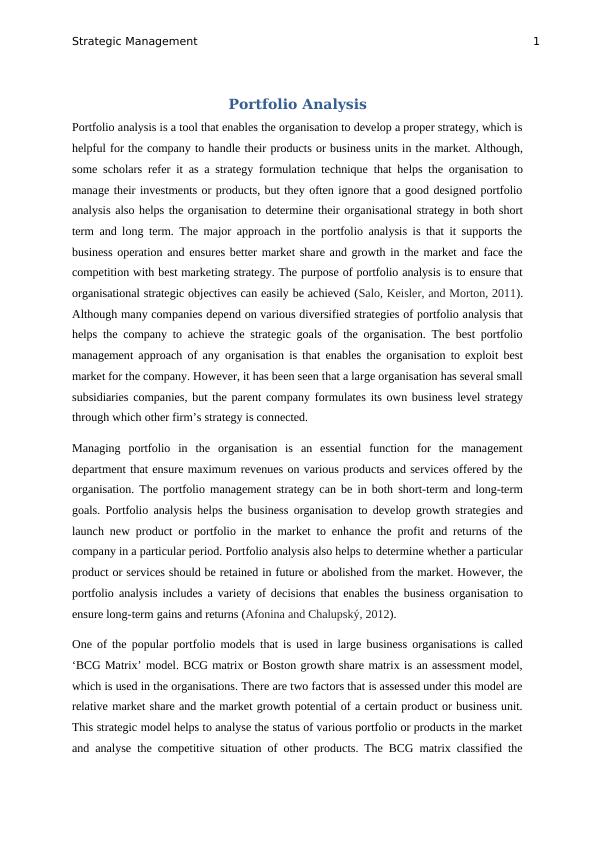
products on low or high market share or low or high market growth of a particular product or
business unit (Amatulli, Caputo, and Guido, 2011).
(Source: Sargeant and Jay, 2014)
BCG matrix divides the products in four quadrants that are question marks, stars, dogs, and
cash cow. The question mark shows those portfolio or products, which have high market
demand and low market share (Pidun, et. al., 2011). The star category of products or portfolio
shows the high market share of particular r products or SBU’s of the business organisation
while the Cash cows shows the high market share and low market growth rate of the product
or product groups. However, the Dog quadrants in the graph show the low market share and
low market growth rate of particular products or SBUs. On the basis of above analysis, a
business organisation can make their strategy that how they can manage their portfolio in the
market (Aspara, Lamberg, Laukia, and Tikkanen, 2011).
Strategic Management 3
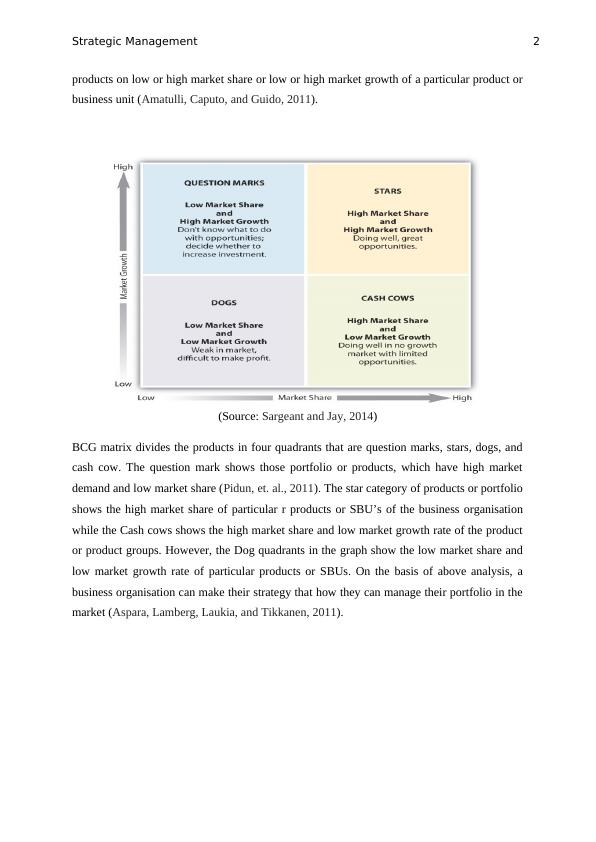
(Source: Sargeant and Jay, 2014)
For example, if we analyse the Unilever then it can easily be seen that company needs to
focus or prioritise the Lifebuoy product, wheel etc. and should give more priority to these
products. Unilever should prioritise these products because these products have high growth
rate but low market share. Apart from this, the Dog section shows those products, which
cannot be profitable for the company because it has low growth rate and low market, share. It
means the company need to kill these products from the market and prioritise that product
that has opportunities of high market growth rate or high market share (Haltofová and
Štěpánková, 2014). Apart from this, the company needs to invest in the Cash cow portfolio
group where company has option to increase their market share with increasing the high
growth rate by doing investment. The star section needs divestment of money from these
sections because this group of products do not need advertising or additional expenses from
the company because these products have already high market growth and high market share
such as Lux, Fair & Lovely, etc. However, it can be said that BCG matrix helps the
organisation to make strategy for the various portfolio and products for the future market
growth and increasing the market share. Although this strategy avoids the future uncertainties
or conditions because it may be possible that a small change in the product may change the
End of preview
Want to access all the pages? Upload your documents or become a member.
Related Documents
Unit 42- Planning for Growthlg...
|16
|4656
|400
Strategic Management Accountinglg...
|8
|1475
|88
Strategic Planning: BCG Matrix and SWOT Analysislg...
|8
|1433
|79
Marketing Management: Investment Decision and BCG Matrix Analysislg...
|15
|3463
|3
Business Strategy of Netflix Executiveslg...
|12
|832
|411
Planning for Growth: Evaluating Growth Opportunities and Funding for Oak Cash & Carrylg...
|15
|4766
|29