Sugar Tax In Australia Question and Answer 2022
VerifiedAdded on 2022/09/23
|15
|2746
|27
Presentation
AI Summary
Contribute Materials
Your contribution can guide someone’s learning journey. Share your
documents today.
Sugar Tax in Australia
Name of the Student
Name of the University
Student ID
Name of the Student
Name of the University
Student ID
Secure Best Marks with AI Grader
Need help grading? Try our AI Grader for instant feedback on your assignments.
Answer 1
(a) (i) Own price elasticity of demand for the economy on average (OPEDE)
(a) (ii) Own price elasticity of demand for low income households (OPEDLIH)
(a) (i) Own price elasticity of demand for the economy on average (OPEDE)
(a) (ii) Own price elasticity of demand for low income households (OPEDLIH)
(b) Own price elasticity of demand for the economy on average is 0.76, which is lower than 1. It means that demand for Sugar Sweetened
Beverages (SSB) in case of economy on average is relatively price inelastic (Jawad et al. 2018). However, OPED for low income households is
1.17, which is greater than 1. Therefore, demand for SSB in case of low income household is relatively price elastic. Hence, it can be said that,
low income households are more responsive to the tax on SSB.
(c) Responsiveness to a price increases depends on various factors and they are
• Income level: Higher the income of individuals lower will be the responsiveness to price increase and vice versa.
• Nature of commodity: Responsiveness to price depends on the type of commodity that is if necessary responsiveness would be low and if
luxury then responsive would be high. There are other kind of commodities such as normal, giffen and demerit.
• Availability of substitutes: Goods with more number of substitutes have more responsive to price than the goods that have no or low number
of substitutes (Lee, Fox and Nayga Jr 2019).
• Price: Responsiveness of price also depends on price of the product. It means that if the price of a product is very high then responsive to it
increase in price would be high too and vice versa.
• Number of uses: Products with more number of uses have less responsive to price increase in comparison to product with less number or
single use.
• Delay in consumption: Consumption of products that can be delayed for longer period have more responsiveness to price increase in
comparison to the consumption of goods that cannot be delayed much.
• Habit: Goods that become necessary due to habit become less responsive to increase in price.
• Time: Time plays a crucial role in responsiveness to price increase. Greater the time responsiveness to price increase rises.
• Expenditure share: Higher the expenditure share of a product, higher its responsiveness to price increase.
The difference found in parts (a) and (b) is that for low income households OPED is higher than Mexican economy as a whole. Thus,
responsiveness of low income households to the increase in price of SSB is higher than the economy on average. This has happened due to the
factors that determine responsiveness to a price increase (Loi and Le Ng 2018). The factors that acted in the case are income, time, habit,
availability of substitute, nature of commodity and price.
Secure Best Marks with AI Grader
Need help grading? Try our AI Grader for instant feedback on your assignments.
(d) Cross price elasticity of demand between SSB and bottled water is given by
The cross price elasticity of demand between SSB and bottle water is 0.21. It means that with 1% increase in price of SSB causes
demand for bottled water to increase by 0.21%. Therefore, cross price elasticity of demand measures the responsiveness of demand for a
product due to change in its substitute’s price (Graham 2019).
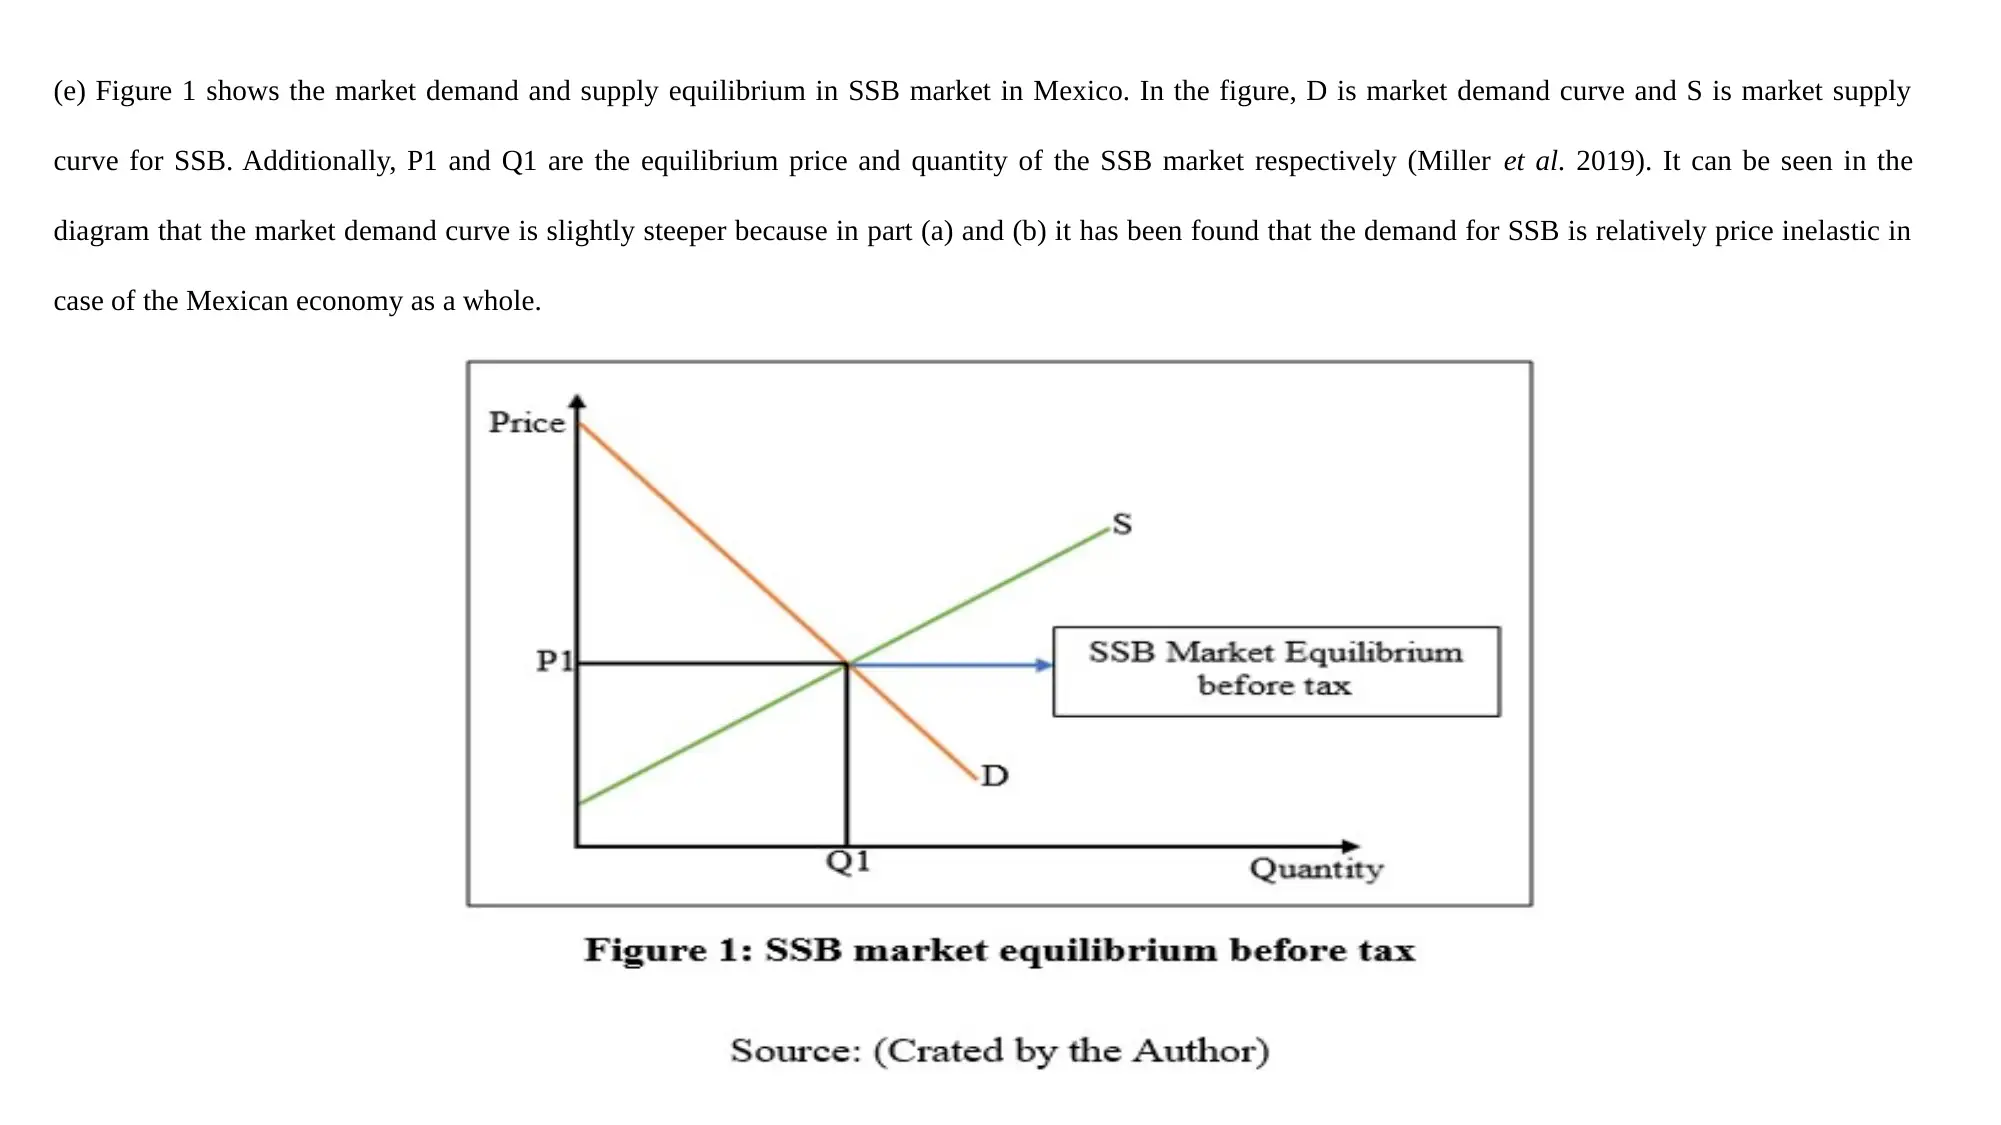
(e) Figure 1 shows the market demand and supply equilibrium in SSB market in Mexico. In the figure, D is market demand curve and S is market supply
curve for SSB. Additionally, P1 and Q1 are the equilibrium price and quantity of the SSB market respectively (Miller et al. 2019). It can be seen in the
diagram that the market demand curve is slightly steeper because in part (a) and (b) it has been found that the demand for SSB is relatively price inelastic in
case of the Mexican economy as a whole.
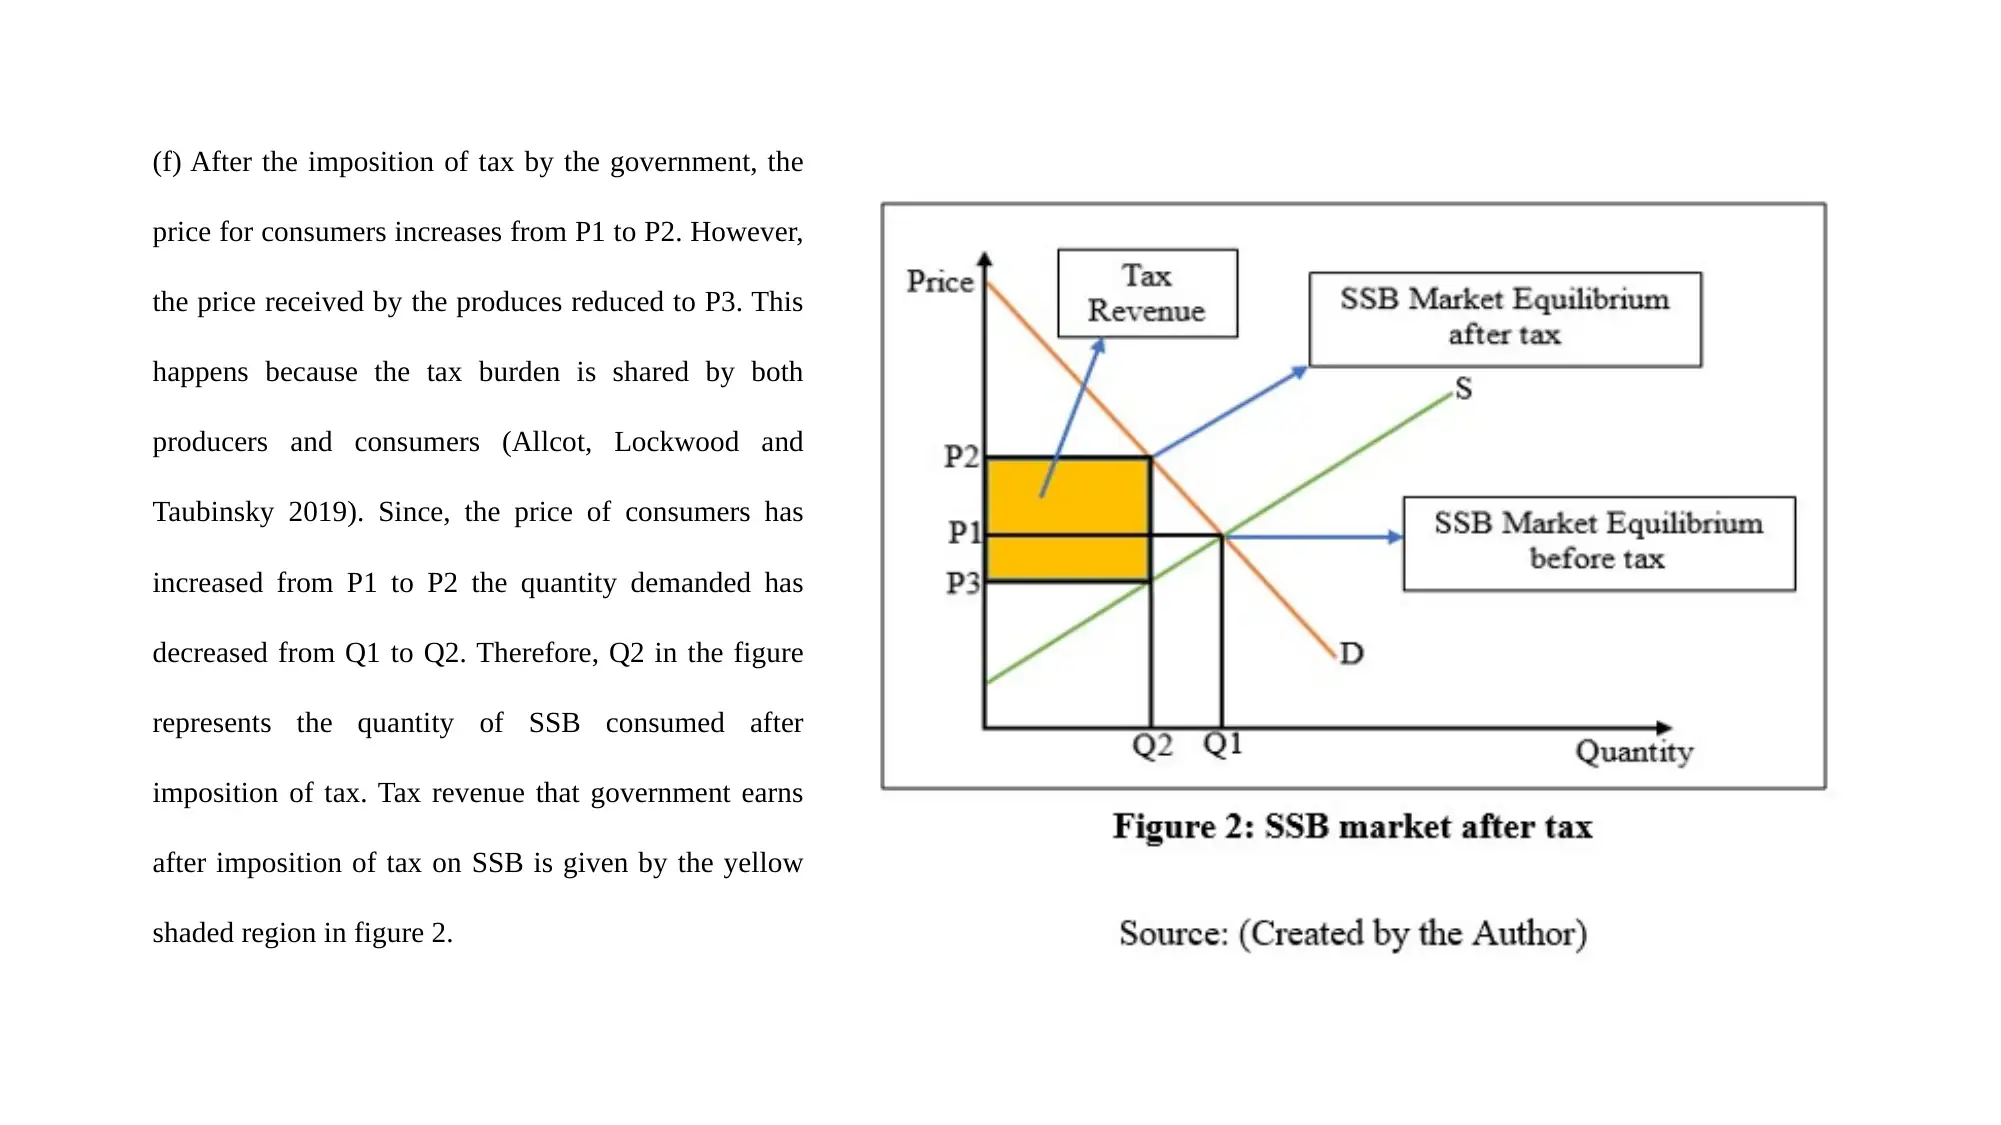
(f) After the imposition of tax by the government, the
price for consumers increases from P1 to P2. However,
the price received by the produces reduced to P3. This
happens because the tax burden is shared by both
producers and consumers (Allcot, Lockwood and
Taubinsky 2019). Since, the price of consumers has
increased from P1 to P2 the quantity demanded has
decreased from Q1 to Q2. Therefore, Q2 in the figure
represents the quantity of SSB consumed after
imposition of tax. Tax revenue that government earns
after imposition of tax on SSB is given by the yellow
shaded region in figure 2.
Paraphrase This Document
Need a fresh take? Get an instant paraphrase of this document with our AI Paraphraser
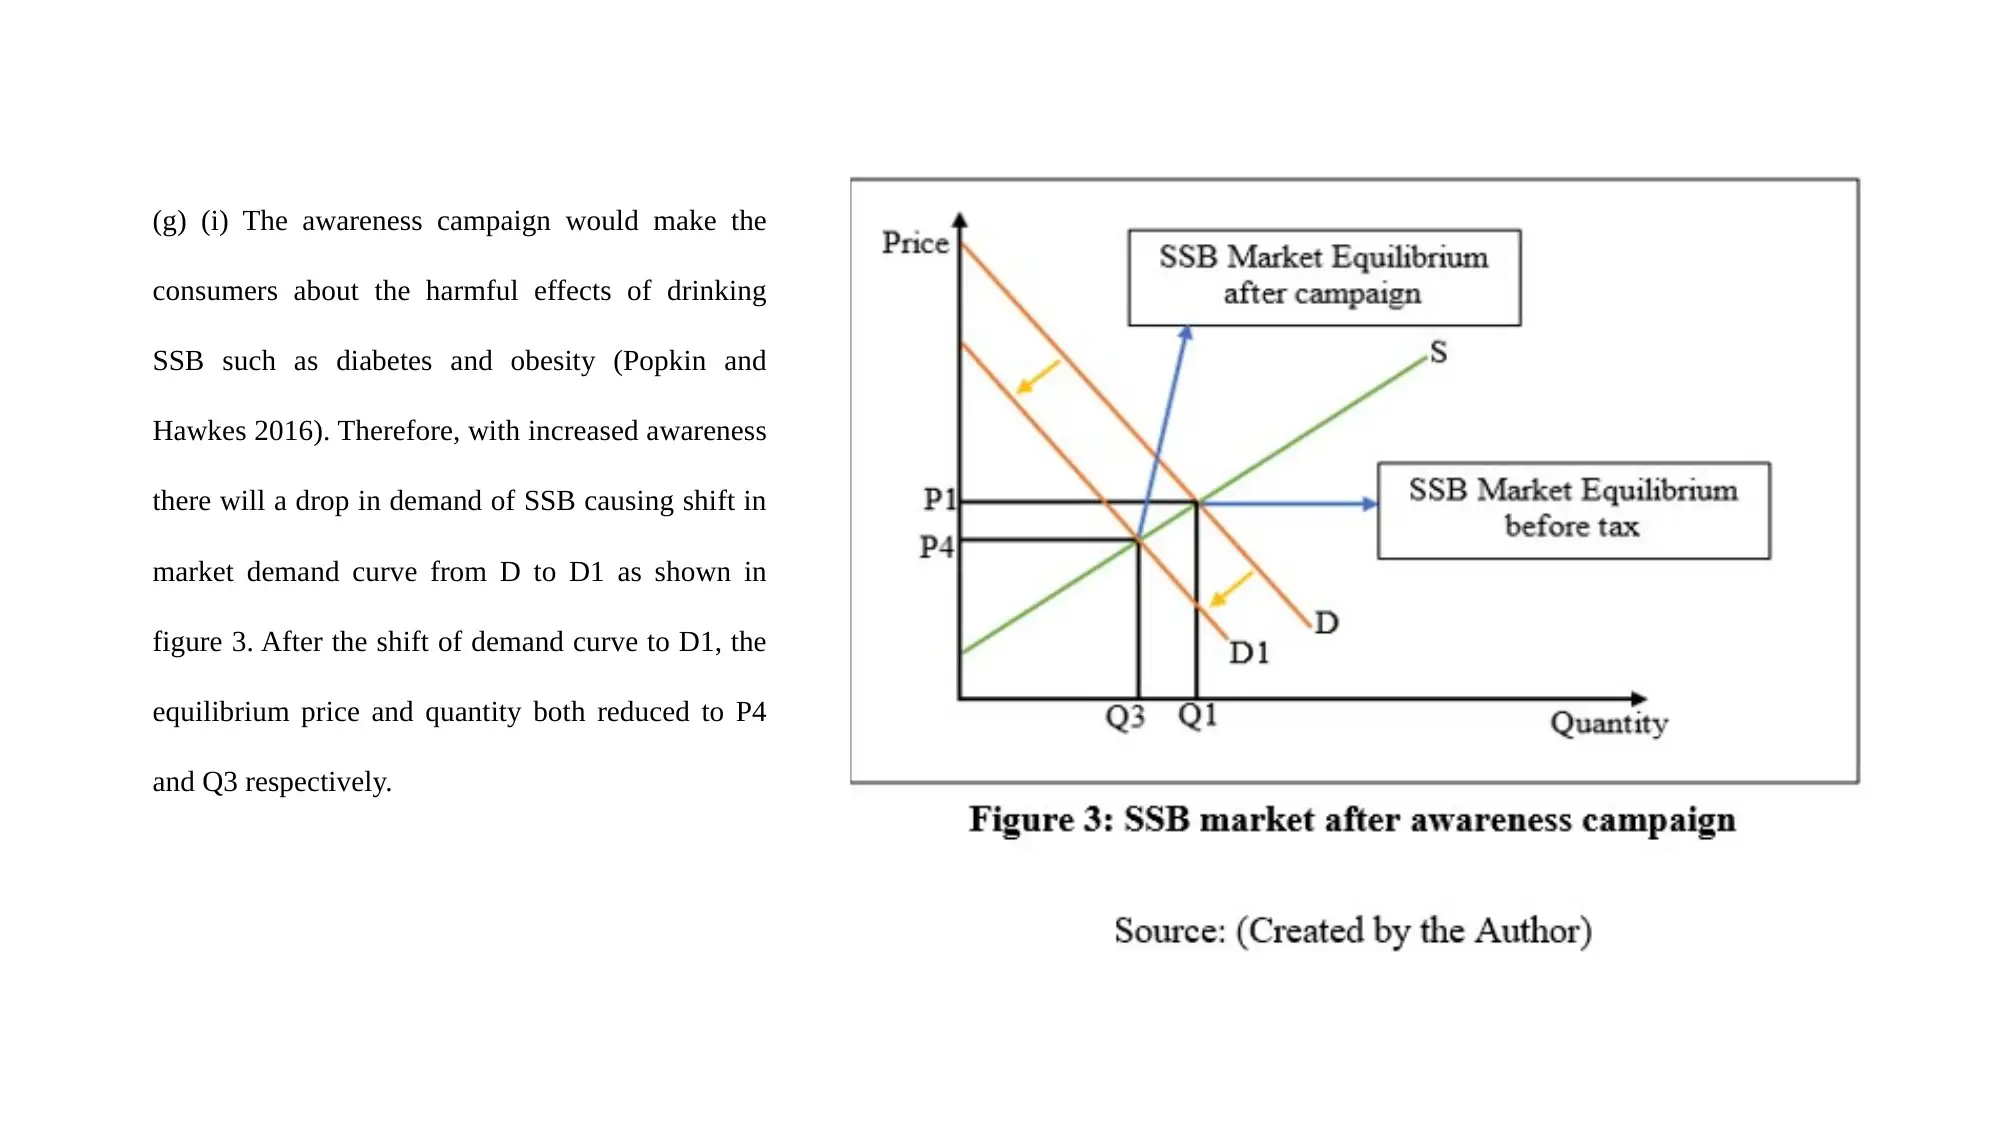
(g) (i) The awareness campaign would make the
consumers about the harmful effects of drinking
SSB such as diabetes and obesity (Popkin and
Hawkes 2016). Therefore, with increased awareness
there will a drop in demand of SSB causing shift in
market demand curve from D to D1 as shown in
figure 3. After the shift of demand curve to D1, the
equilibrium price and quantity both reduced to P4
and Q3 respectively.
(g) (ii) The fall in consumption of SSB due to awareness campaign and tax is a bit difficult to compare as it is not possible to assess the amount of fall in
quantity consumed after awareness campaign (Hagmann, Siegrist and Hartmann 2018). However, in the case of tax there is no change in demand but fall in
quantity demanded due to increase in price of SSB, it means that with fall in price the quantity demanded might increase. Conversely, in the case of awareness
campaign there is fall in demand that causes the demand curve to shift left (Morley et al. 2018). It means that awareness campaign caused the market to
contract. Assuming that even if the fall consumption is same, that is (Q1-Q2) = (Q1-Q3), the price of SSB paid by the consumer is lower than in the case of tax.
Therefore, there is no tax burden on consumers and producers. Additionally, there is no tax revenue for the government under awareness campaign.
Moreover, awareness campaign will have equal impact on both the low income households and Mexican economy as a whole in case of SSB
consumption unlike tax (Bleakley et al. 2018). This happens because there is no influence of factors that determines responsiveness to a price increase. In case
of awareness fall in consumption of SSB is completely due to self-concern generated owing to health awareness.
(g) (iii) A combination of both the awareness campaign and tax on SSB will have more impact on the consumption of SSB (Ma et al. 2016). The consumption
of SSB will fall below Q2 or Q3 and price received by the producers will fall below P3 or P4. However, there will be no significant change in the government
revenue since the tax burden of producers increase in this case.
Answer 2
Sugar Sweetened Beverages (SSB) has become a national concern in Australia. The continuous increase in consumption of SSB
has increased the number of obese people in the country and along with the cases of Type 2 diabetes has increased in the country drastically
(Harray et al. 2017). It is argued that over consumption of sugar is causing diabetes which impacts the eye sight (Vassey 2020). The person
suffering from severe diabetes has high chance of getting vision impairment. Thus, in many country such as Mexico has already imposed sugar
tax. It is argued that the Mexico government is successful in reducing consumption of SSB by imposing tax. They imposed a tax that increased
the price of SSBs by 10% and due to that, demand fell by more than 7%. Thus, many experts in Australia argue that imposing sugar tax will be
ideal to reduce the consumption of SSB in the country (Lloyd and MacLaren 2019). The tax would increase the price of the SSBs and due to
that, the consumers will reduce the consumption. However, this policy of taxing SSB in order to reduce their consumption is questioned by
many because it is argued that consuming SSB provides pleasure to the consumers taxing would reduce pleasure and thereby reduces welfare at
least in the cases of poor. Some believe that aggressive advertisement is one of the causes of rise in consumption of SSBs (Choi et al. 2017).
Thus, the government should bring strict regulation top restrict such aggressive advertisement to encourage consumption of SSB. Experts who
argue for imposition of tax on sugar gave the notion that since sugar is not an addictive product like cigarette or tobacco the impact of tax on
sugar will be much better.
Secure Best Marks with AI Grader
Need help grading? Try our AI Grader for instant feedback on your assignments.
Imposition of tax on sugar may reduce the consumption of SSB but it puts burden on consumers and producers. Both of them have to thus worse
off due to imposition of sugar tax. Thus, even though it helps in reduction of consumption of SSB and improves public health. However, tax burden
lowers the beneficial impact the policy. Thus, instead of imposing sugar tax alternative policies can be used. Policies such as conducting awareness
programmes, asking SSB manufacturers to reduce the amount of sugar in the drinks. Conducting awareness programmes would make the
consumers aware of the harmful effects of consuming sugar or sugar based products. Sugar is present in every foods that is consumed and thus it is
necessary to increase more awareness. Awareness programme does not imposes tax burden on consumers and the producers. Conversely, there is
problem with awareness programmes and that it takes long time to make any significant impact. Hence, it can be said that both the policies have
their own drawback. It is said that SSB manufacturers encourages consumption of SSBs since they are in the market to make more profits and it is
completely reasonable unless and until they are not using unlawful means to increase consumptions of SSB. On the other hand, the government of
Australia does not support taxing consumption of SSB since they are not addictive product like cigarette. With increasing concern of obesity and
diabetes in the country and debates about policies to control consumption of SSB, the one of biggest source of sugar, the SSB manufactures are
taking measures in order to keep their market growing by reducing sugar content in the SSB products. They are also launching new products that
will be free of sugars and thereby the sugar consumption of people of the country can be reduced significantly without controlling the consumption
of SSB by imposition of tax or any other similar policies. All the measures are capable of reducing the consumption of SSB or lower sugar intake.
Hence, further thought is needed in this context of lowering consumption of SSB to control excessive sugar intake.
Answer 3
The supermarket in Abisko is filled with sugary products such as sweets, SSB and chocolates. The town is 1 hour 20 minutes from
Narvik, a place in Norway. Therefore, the entire population of the town is dependent on the supplies of the super market. Abisko is not far from
from Norway and it means that the town is in border nearby area. Hence, it is difficult for the super market to get its products regularly. Again it
is the last super market not only in area but before the Norway and Sweden border, Therefore, the super market does not only serve people of
Abisko town but also the flying consumers who travel from Sweden to Norway or the opposite. Thus, in order to meet the market demand there
is more number of sugary products in the supermarket (Boudon 2016). Hence, this is an example of unintended consequences since it
encourages the consumption of sugary products by selling more of such products and increasing the chance of obesity and Type 2 diabetes.
Reference
Allcott, H., Lockwood, B.B. and Taubinsky, D., 2019. Should we tax sugar-sweetened beverages? An overview of theory and evidence. Journal of
Economic Perspectives, 33(3), pp.202-27.
Bleakley, A., Jordan, A., Mallya, G., Hennessy, M. and Piotrowski, J.T., 2018. Do you know what your kids are drinking? Evaluation of a media
campaign to reduce consumption of sugar-sweetened beverages. American Journal of Health Promotion, 32(6), pp.1409-1416.
Boudon, R., 2016. The unintended consequences of social action. Springer.
Choi, J.Y., Park, M.N., Kim, C.S., Lee, Y.K., Choi, E.Y., Chun, W.Y. and Shin, D.M., 2017. Long-term consumption of sugar-sweetened beverage
during the growth period promotes social aggression in adult mice with proinflammatory responses in the brain. Scientific reports, 7, p.45693.
Graham, N.J., 2019. An exploration of own and cross-price elasticity of demand for residential heating in the Fairbanks North Star
Borough (Doctoral dissertation).
Hagmann, D., Siegrist, M. and Hartmann, C., 2018. Taxes, labels, or nudges? Public acceptance of various interventions designed to reduce sugar
intake. Food policy, 79, pp.156-165.
Paraphrase This Document
Need a fresh take? Get an instant paraphrase of this document with our AI Paraphraser
Harray, A.J., Boushey, C.J., Pollard, C.M., Panizza, C.E., Delp, E.J., Dhaliwal, S.S. and Kerr, D.A., 2017. Perception v. actual intakes of junk
food and sugar-sweetened beverages in Australian young adults: assessed using the mobile food record. Public health nutrition, 20(13),
pp.2300-2307.
Jawad, M., Lee, J.T., Glantz, S. and Millett, C., 2018. Price elasticity of demand of non-cigarette tobacco products: a systematic review and
meta-analysis. Tobacco control, 27(6), pp.689-695.
Lee, J.Y., Fox, J.A. and Nayga Jr, R.M., 2019. Effect of substitutes in contingent valuation for a private market good. Applied Economics
Letters, 26(14), pp.1153-1156.
Lloyd, P. and MacLaren, D., 2019. Should we tax sugar and if so how?. Australian Economic Review, 52(1), pp.19-40.
Loi, T.S.A. and Le Ng, J., 2018. Analysing households’ responsiveness towards socio-economic determinants of residential electricity
consumption in Singapore. Energy Policy, 112, pp.415-426.
Ma, Y., He, F.J., Yin, Y., Hashem, K.M. and MacGregor, G.A., 2016. Gradual reduction of sugar in soft drinks without substitution as a strategy
to reduce overweight, obesity, and type 2 diabetes: a modelling study. The Lancet Diabetes & Endocrinology, 4(2), pp.105-114.
Miller, C.L., Dono, J., Wakefield, M.A., Pettigrew, S., Coveney, J., Roder, D., Durkin, S.J., Wittert, G., Martin, J. and Ettridge, K.A., 2019. Are
Australians ready for warning labels, marketing bans and sugary drink taxes? Two cross-sectional surveys measuring support for policy
responses to sugar-sweetened beverages. BMJ open, 9(6), p.e027962.
Morley, B.C., Niven, P.H., Dixon, H.G., Swanson, M.G., McAleese, A.B. and Wakefield, M.A., 2018. Controlled cohort evaluation of the
LiveLighter mass media campaign’s impact on adults’ reported consumption of sugar-sweetened beverages. BMJ open, 8(4), p.e019574.
Popkin, B.M. and Hawkes, C., 2016. Sweetening of the global diet, particularly beverages: patterns, trends, and policy responses. The Lancet
Diabetes & Endocrinology, 4(2), pp.174-186.
Vasey, C., 2020. Good Sugar, Bad Sugar: How to Power Your Body and Brain with Healthy Energy. Simon and Schuster.
1 out of 15
Related Documents


Your All-in-One AI-Powered Toolkit for Academic Success.
+13062052269
info@desklib.com
Available 24*7 on WhatsApp / Email
![[object Object]](/_next/static/media/star-bottom.7253800d.svg)
Unlock your academic potential
© 2024 | Zucol Services PVT LTD | All rights reserved.