Summarizing Data: Intro to Statistics - Business Admin Diploma

Verified

Added on  2023/06/15

|8
|1071
|154
Homework Assignment
AI Summary
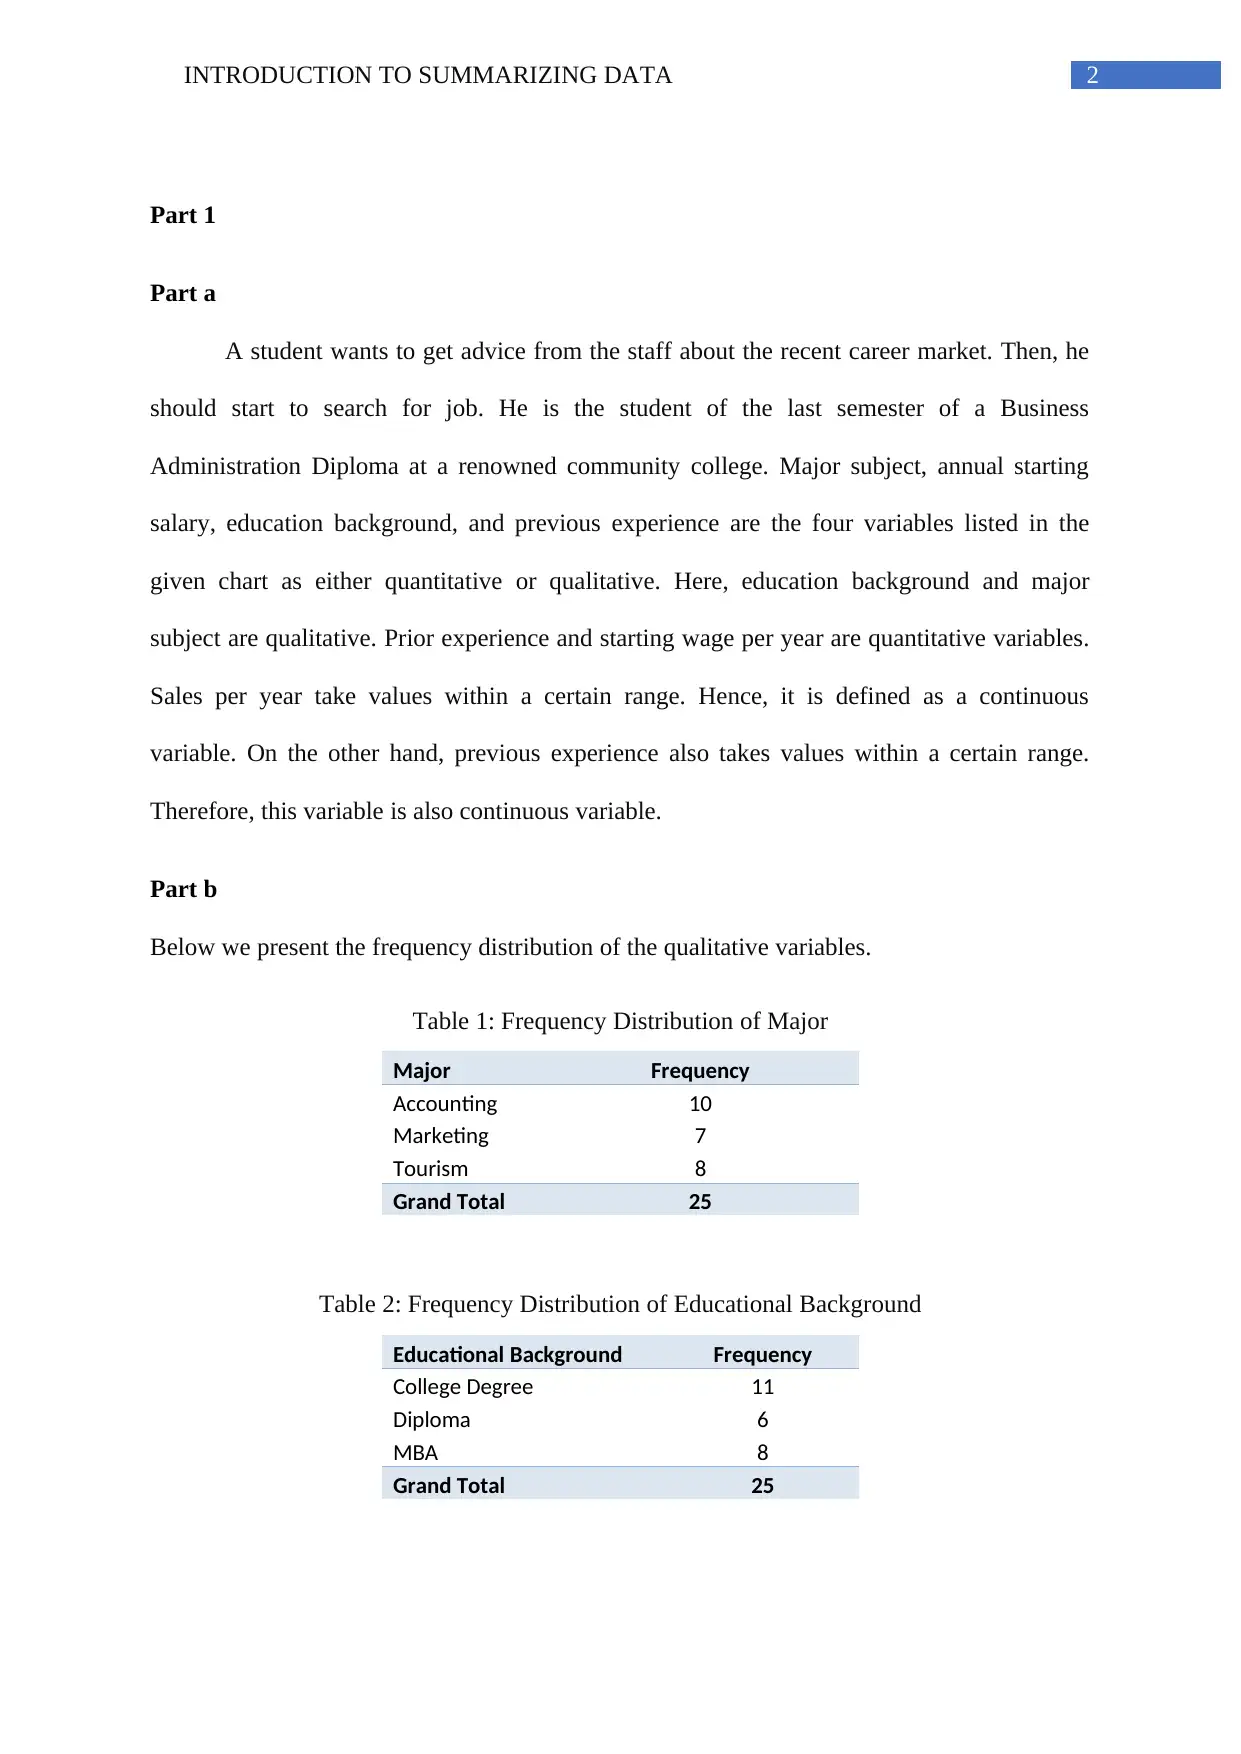
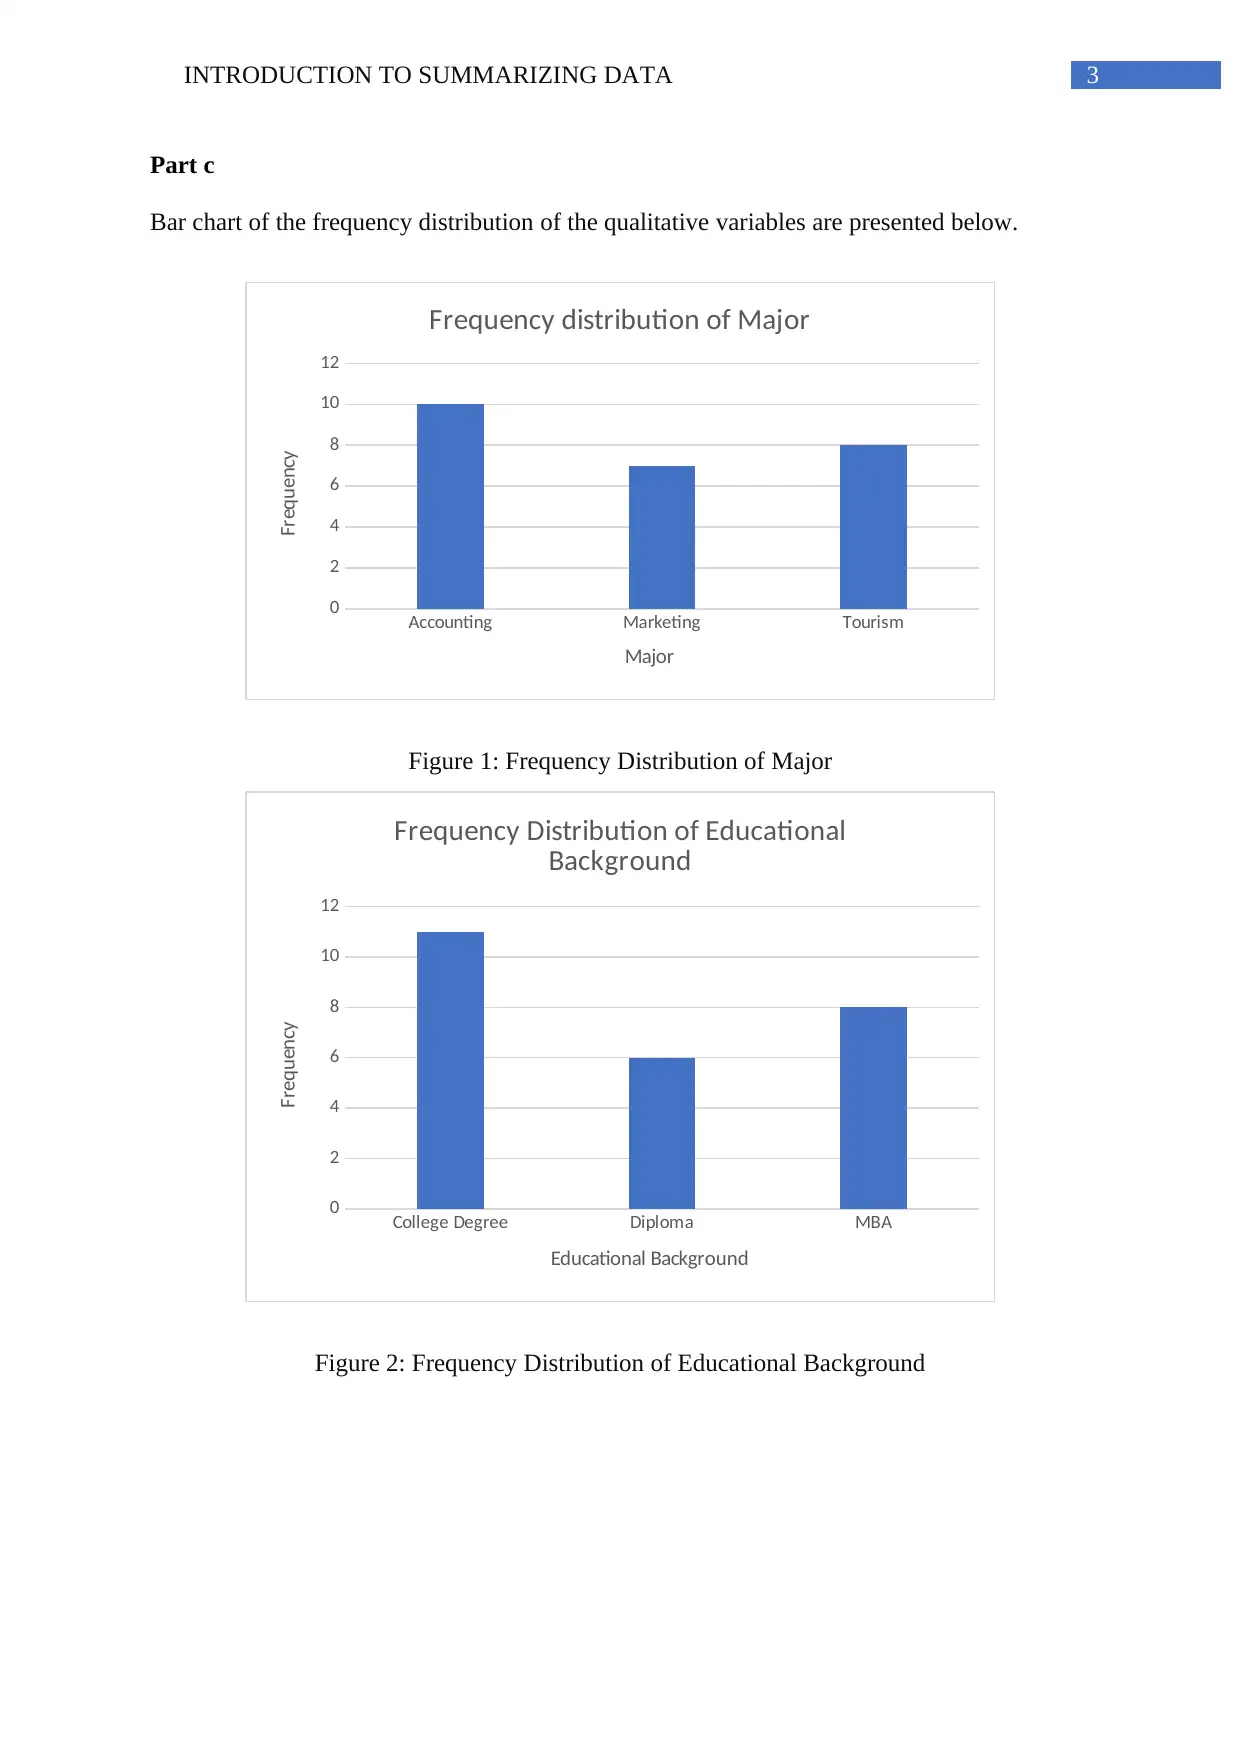
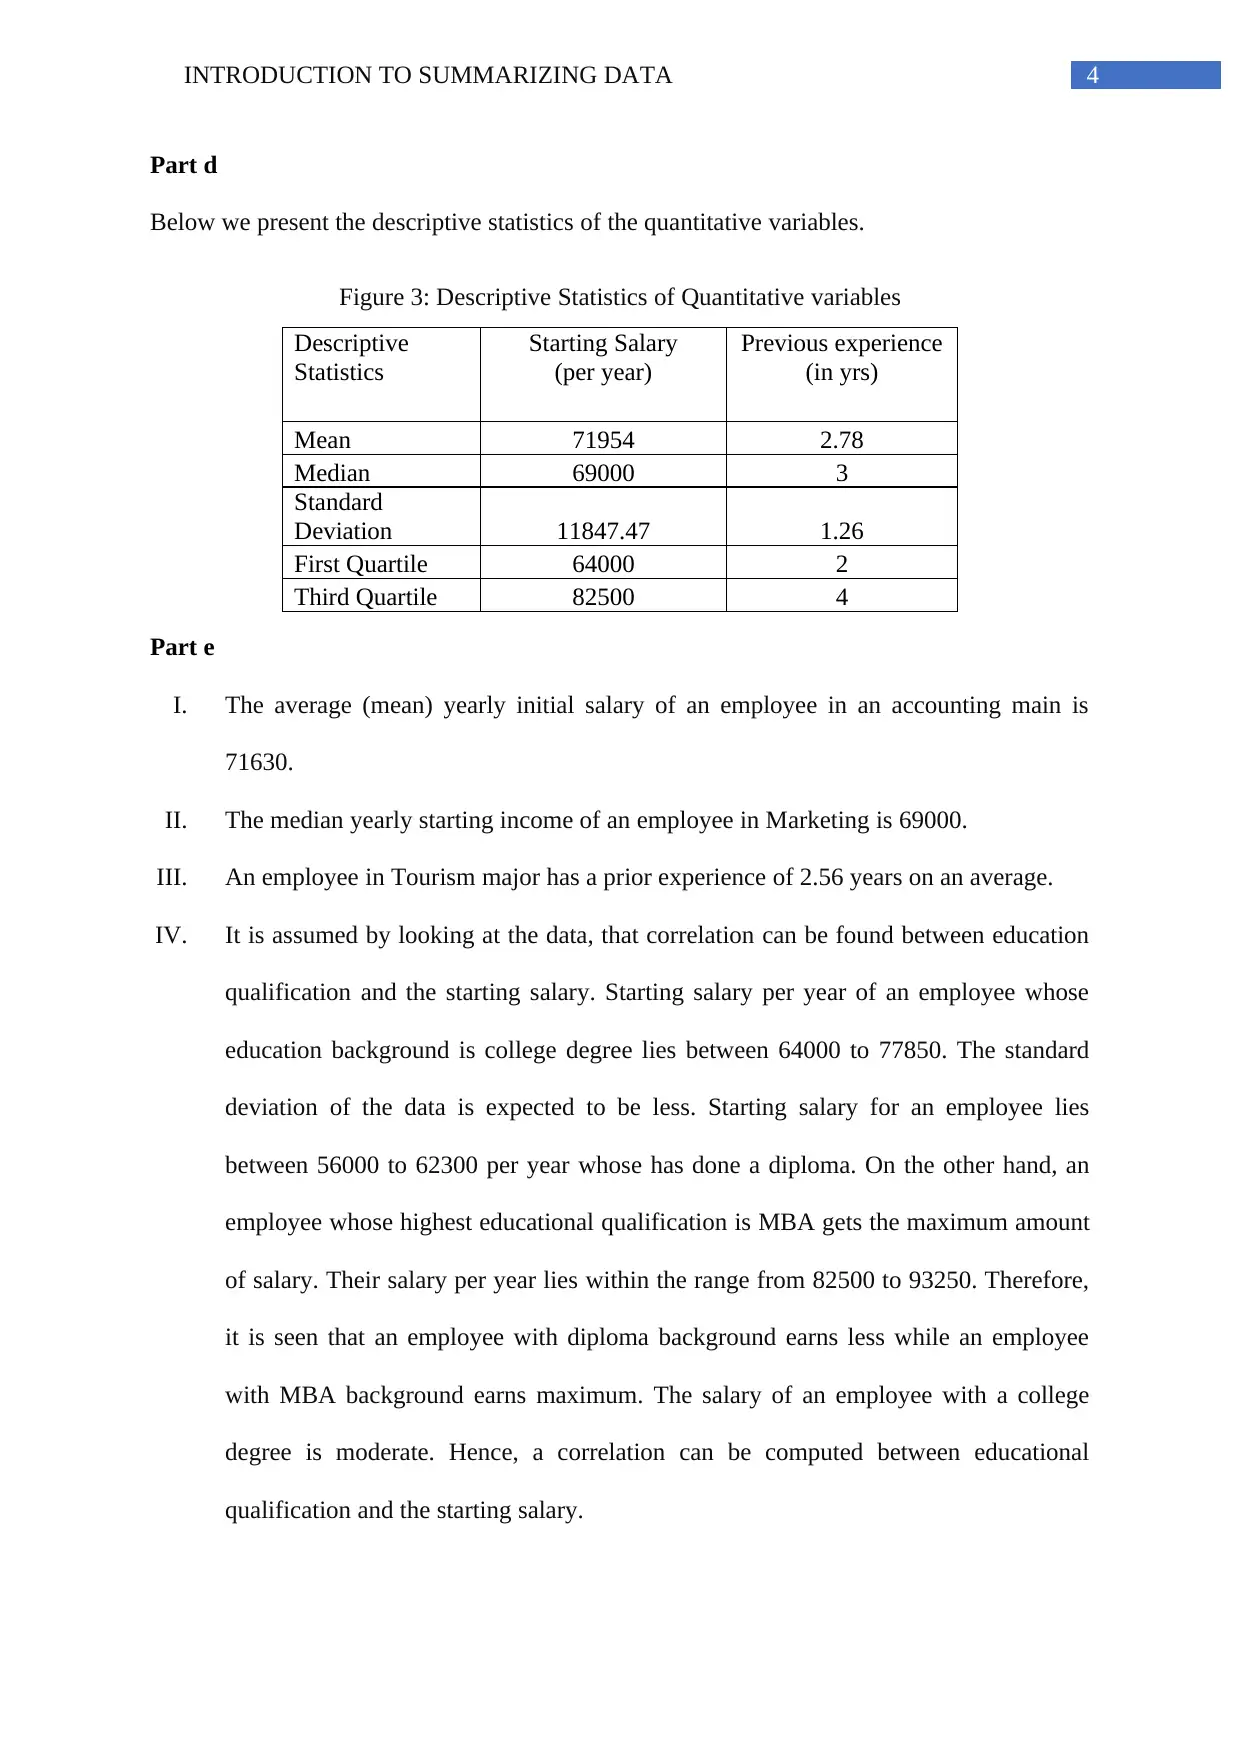
This assignment focuses on summarizing data for a Business Administration Diploma student exploring the job market. It involves analyzing qualitative and quantitative variables such as major subject, annual starting salary, education background, and previous experience. The solution includes frequency distributions for qualitative variables (major and educational background) and descriptive statistics (mean, median, standard deviation, quartiles) for quantitative variables (starting salary and previous experience). The analysis interprets these statistics, discussing the relationship between educational qualifications and starting salaries, and highlights the importance of data summarization for hypothesis testing and informed decision-making. A memorandum to the HR Director summarizes key findings, including salary ranges and experience levels across different majors, emphasizing the correlation between educational background and salary.
Document Page
Running head: INTRODUCTION TO SUMMARIZING DATA
Introduction to Summarizing Data
Name of the Student
Name of the University
Author note
tabler-icon-diamond-filled.svg

Paraphrase This Document

Need a fresh take? Get an instant paraphrase of this document with our AI Paraphraser
Document Page
1INTRODUCTION TO SUMMARIZING DATA
Table of Contents
Part 1..........................................................................................................................................2
Part a.......................................................................................................................................2
Part b......................................................................................................................................2
Part c.......................................................................................................................................3
Part d......................................................................................................................................3
Part e.......................................................................................................................................4
Part 2..........................................................................................................................................6
Document Page
2INTRODUCTION TO SUMMARIZING DATA
Part 1
Part a
A student wants to get advice from the staff about the recent career market. Then, he
should start to search for job. He is the student of the last semester of a Business
Administration Diploma at a renowned community college. Major subject, annual starting
salary, education background, and previous experience are the four variables listed in the
given chart as either quantitative or qualitative. Here, education background and major
subject are qualitative. Prior experience and starting wage per year are quantitative variables.
Sales per year take values within a certain range. Hence, it is defined as a continuous
variable. On the other hand, previous experience also takes values within a certain range.
Therefore, this variable is also continuous variable.
Part b
Below we present the frequency distribution of the qualitative variables.
Table 1: Frequency Distribution of Major
Major Frequency
Accounting 10
Marketing 7
Tourism 8
Grand Total 25
Table 2: Frequency Distribution of Educational Background
Educational Background Frequency
College Degree 11
Diploma 6
MBA 8
Grand Total 25
Document Page
3INTRODUCTION TO SUMMARIZING DATA
Part c
Bar chart of the frequency distribution of the qualitative variables are presented below.
Accounting Marketing Tourism
0
2
4
6
8
10
12
Frequency distribution of Major
Major
Frequency
Figure 1: Frequency Distribution of Major
College Degree Diploma MBA
0
2
4
6
8
10
12
Frequency Distribution of Educational
Background
Educational Background
Frequency
Figure 2: Frequency Distribution of Educational Background
tabler-icon-diamond-filled.svg

Paraphrase This Document

Need a fresh take? Get an instant paraphrase of this document with our AI Paraphraser
Document Page
4INTRODUCTION TO SUMMARIZING DATA
Part d
Below we present the descriptive statistics of the quantitative variables.
Figure 3: Descriptive Statistics of Quantitative variables
Descriptive
Statistics
Starting Salary
(per year)
Previous experience
(in yrs)
Mean 71954 2.78
Median 69000 3
Standard
Deviation 11847.47 1.26
First Quartile 64000 2
Third Quartile 82500 4
Part e
I. The average (mean) yearly initial salary of an employee in an accounting main is
71630.
II. The median yearly starting income of an employee in Marketing is 69000.
III. An employee in Tourism major has a prior experience of 2.56 years on an average.
IV. It is assumed by looking at the data, that correlation can be found between education
qualification and the starting salary. Starting salary per year of an employee whose
education background is college degree lies between 64000 to 77850. The standard
deviation of the data is expected to be less. Starting salary for an employee lies
between 56000 to 62300 per year whose has done a diploma. On the other hand, an
employee whose highest educational qualification is MBA gets the maximum amount
of salary. Their salary per year lies within the range from 82500 to 93250. Therefore,
it is seen that an employee with diploma background earns less while an employee
with MBA background earns maximum. The salary of an employee with a college
degree is moderate. Hence, a correlation can be computed between educational
qualification and the starting salary.
Document Page
5INTRODUCTION TO SUMMARIZING DATA
V. Pie chart, bar diagram etc. can be drawn for better understanding. Graphs and tables
provide a suitable plain picture of a set of data but it is frequently essential to
summarize the additional quantitative data. The two key elements of a dataset are its
location (where the standard the data lie) and its unpredictability (the degree to which
individual information values deviate from the location). Numerous different methods
of location and variability can be computed. The selection of central tendency and
dispersion to use depends on individual conditions. Summarizing the data, we can
find the descriptive statistics of salary of employees per year. Summarize data will
also help to test hypotheses. The relationship between the educational background of
an employee and salary of that employee can be computed using the summarize data.
Summarize data will also help to test whether there is a relation between previous
work experience and salary. Hence, summarizing data is important. Summarize data
helps to think creatively. It leads to change in decision-making.
Document Page
6INTRODUCTION TO SUMMARIZING DATA
Part 2
Memorandum
TO: Director of HR
FROM: Name of the Student
DATE: 21-02-18
SUBJECT: Analysis of Summarizing Data
Three areas of interest in making a career such as Accounting, Marketing,and Tourism have
been picked. Appointment requests have been sent to a number of college staffs in
accounting, marketing and tourism majors. About 25 staff members have decided to converse
in person to provide their opinion. The above information has been gathered after
conversation with them.
It is seen that salary per year of maximum employees lies between 68416 to 74625. Previous
experience of maximum employees is within the range 3.5 years to 4.25 years and 2 years to
2.75 years. An employee in Tourism has an experience of 2.5625 years on an average.
The mean earning of an employee is 71954. Mean of previous work experience is 2.78 years.
It is noticeable that the average salary per year of an employee with Accounting major is
71630. The average salary per year of an member of staff with marketing major is 75814.28
and an employee with Tourism major earns 68981.25 per year.
It is also seen from the data that the salary of an employee with MBA background is much.
Average annual salary of an employee with MBA background is 86837.5. The average salary
of an employee who has completed diploma is least. On the other hand, the annual salary for
tabler-icon-diamond-filled.svg

Paraphrase This Document

Need a fresh take? Get an instant paraphrase of this document with our AI Paraphraser
Document Page
7INTRODUCTION TO SUMMARIZING DATA
a college student is moderate. Hence, there is a correlation between educational background
and salary per year.
chevron_up_icon
1 out of 8
circle_padding
hide_on_mobile
zoom_out_icon
[object Object]