BIO1010 Biology in Action Re-sit: Data Analysis and Results
VerifiedAdded on 2022/10/03
|9
|488
|1
Report
AI Summary
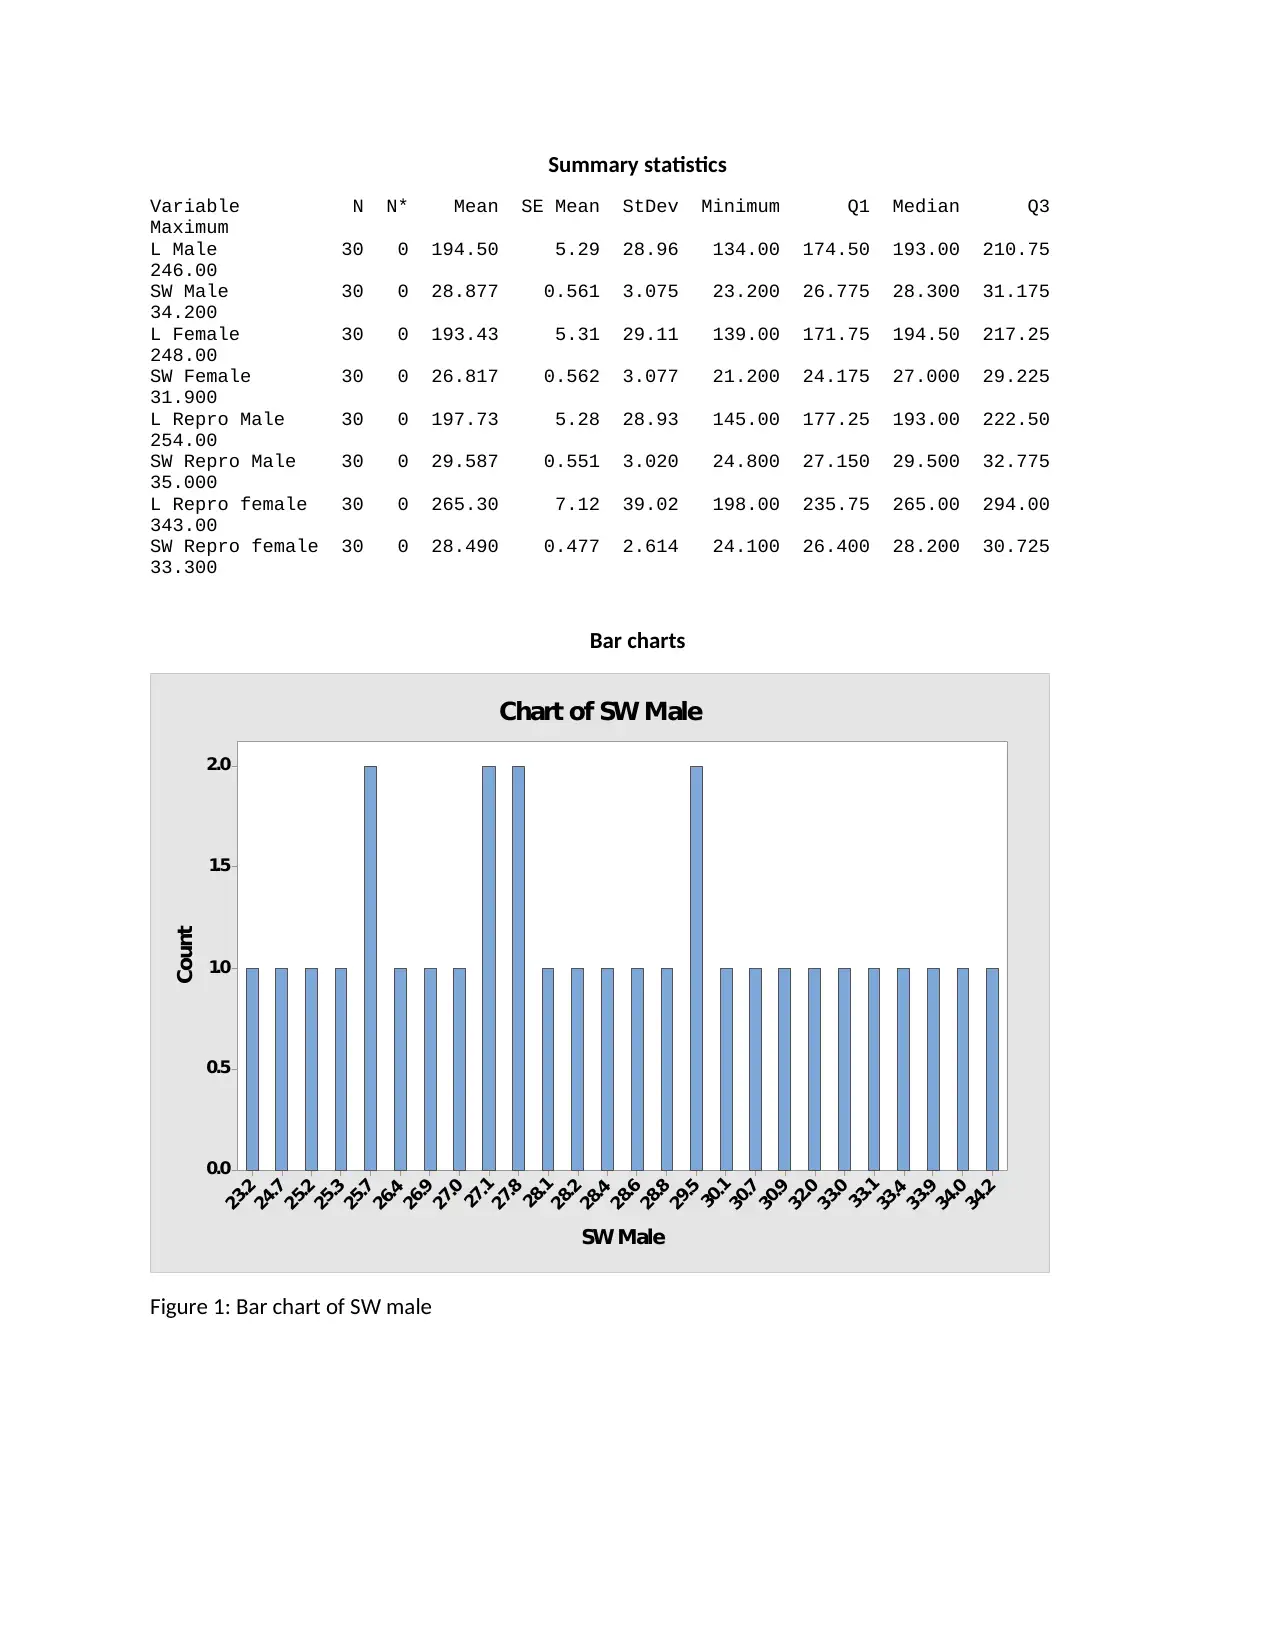
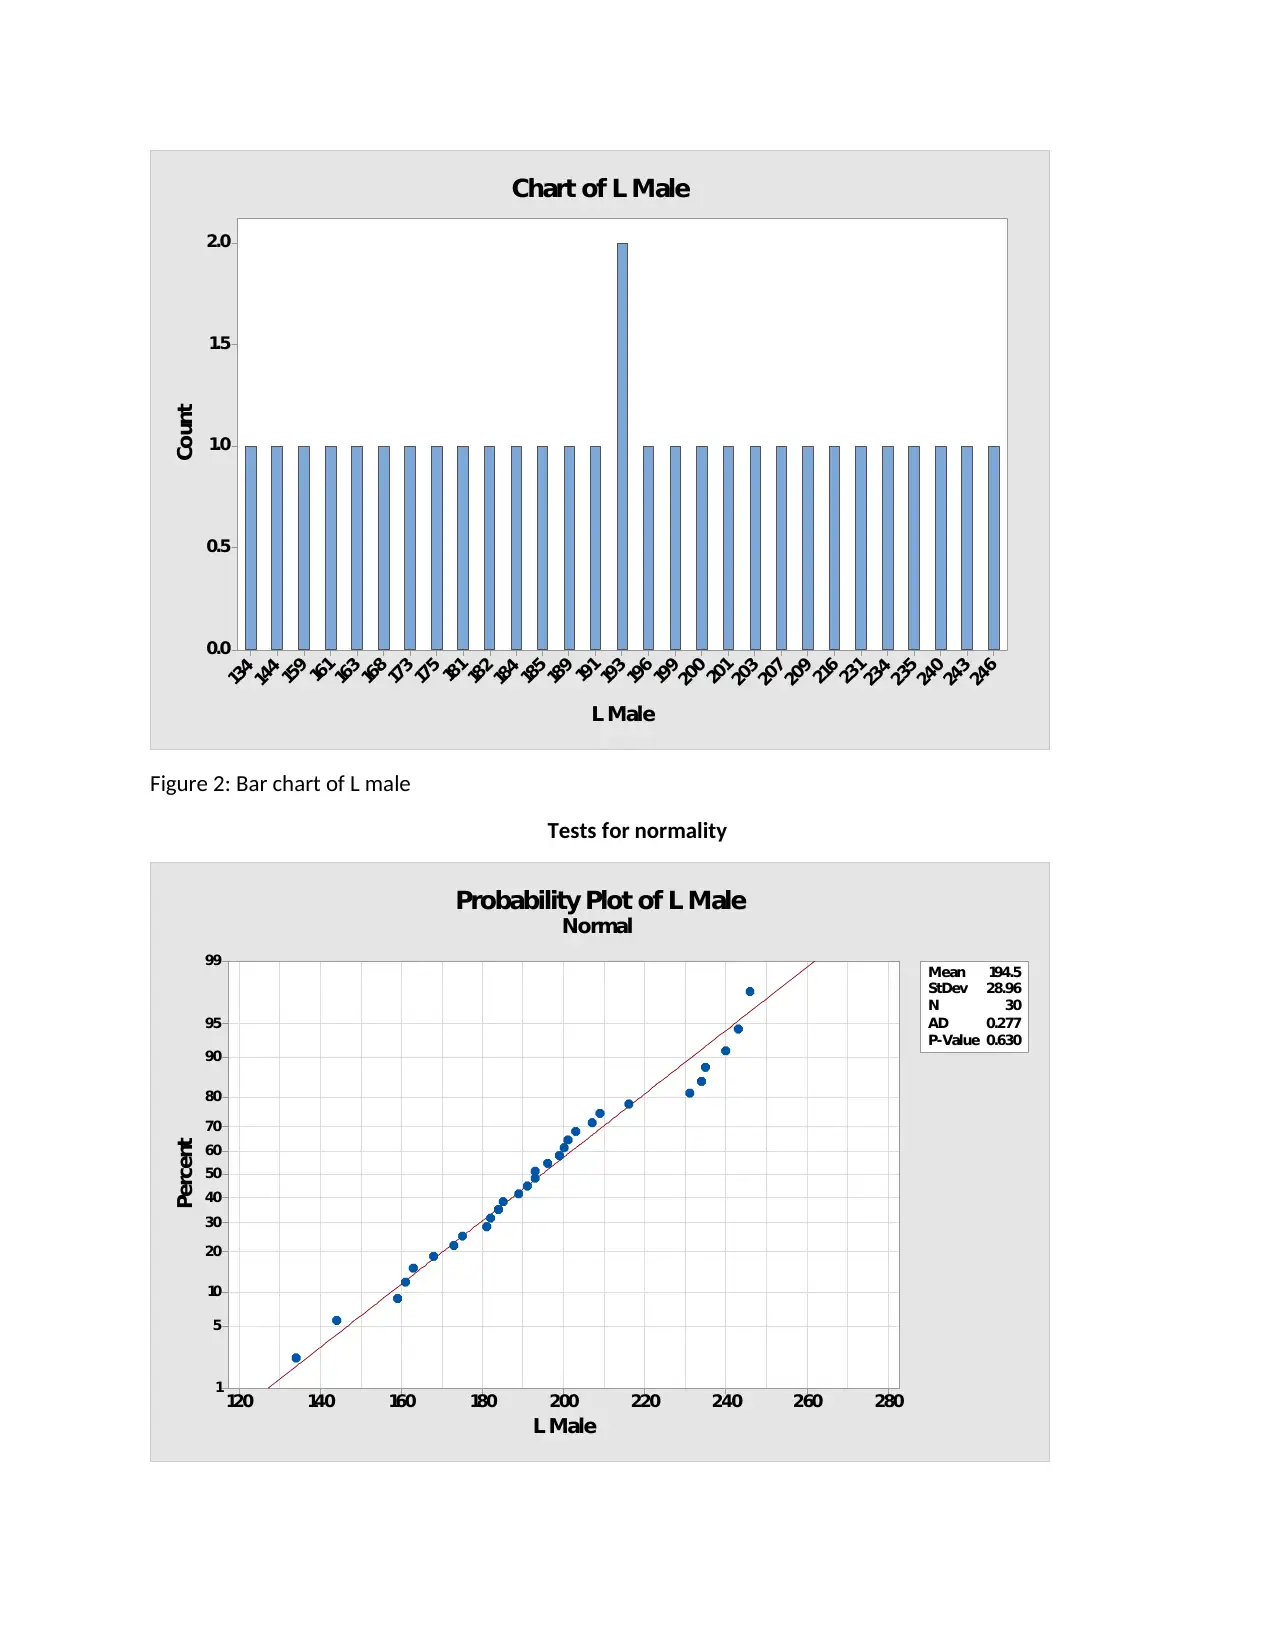
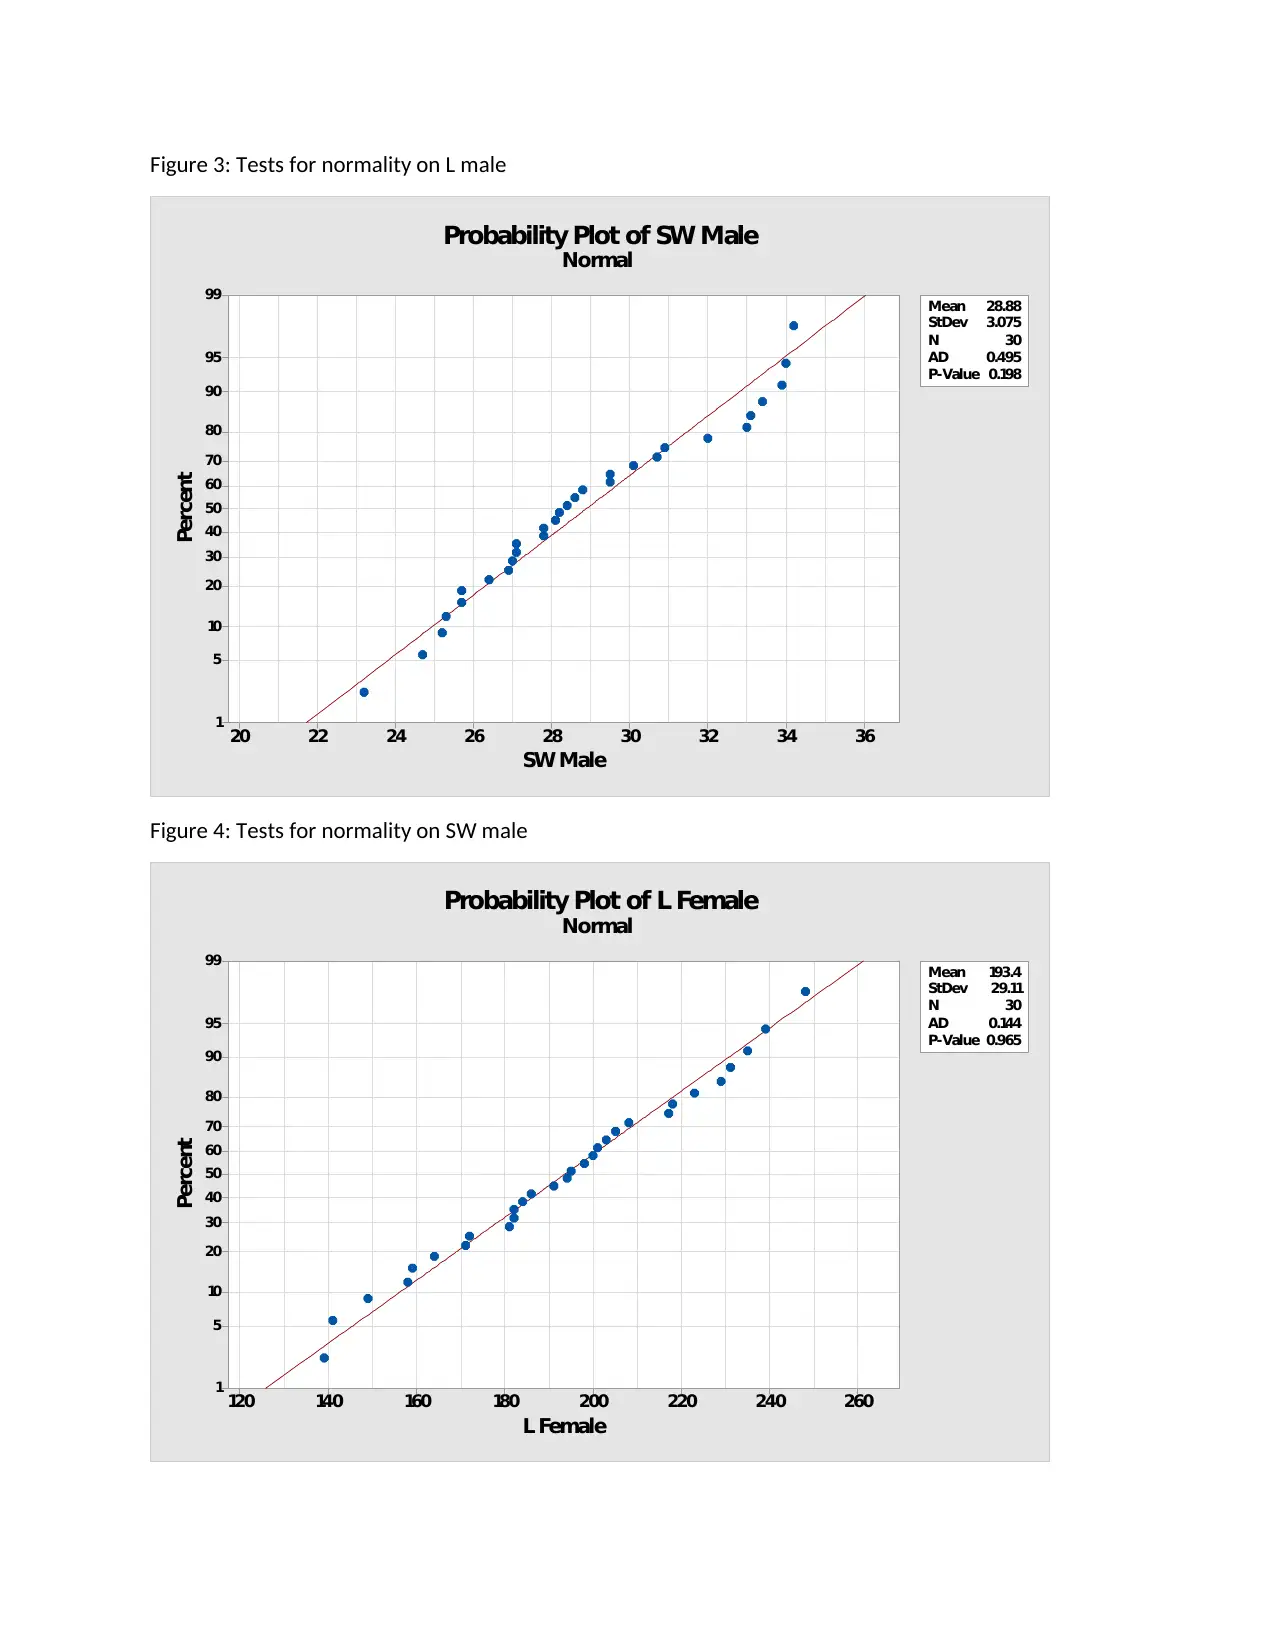
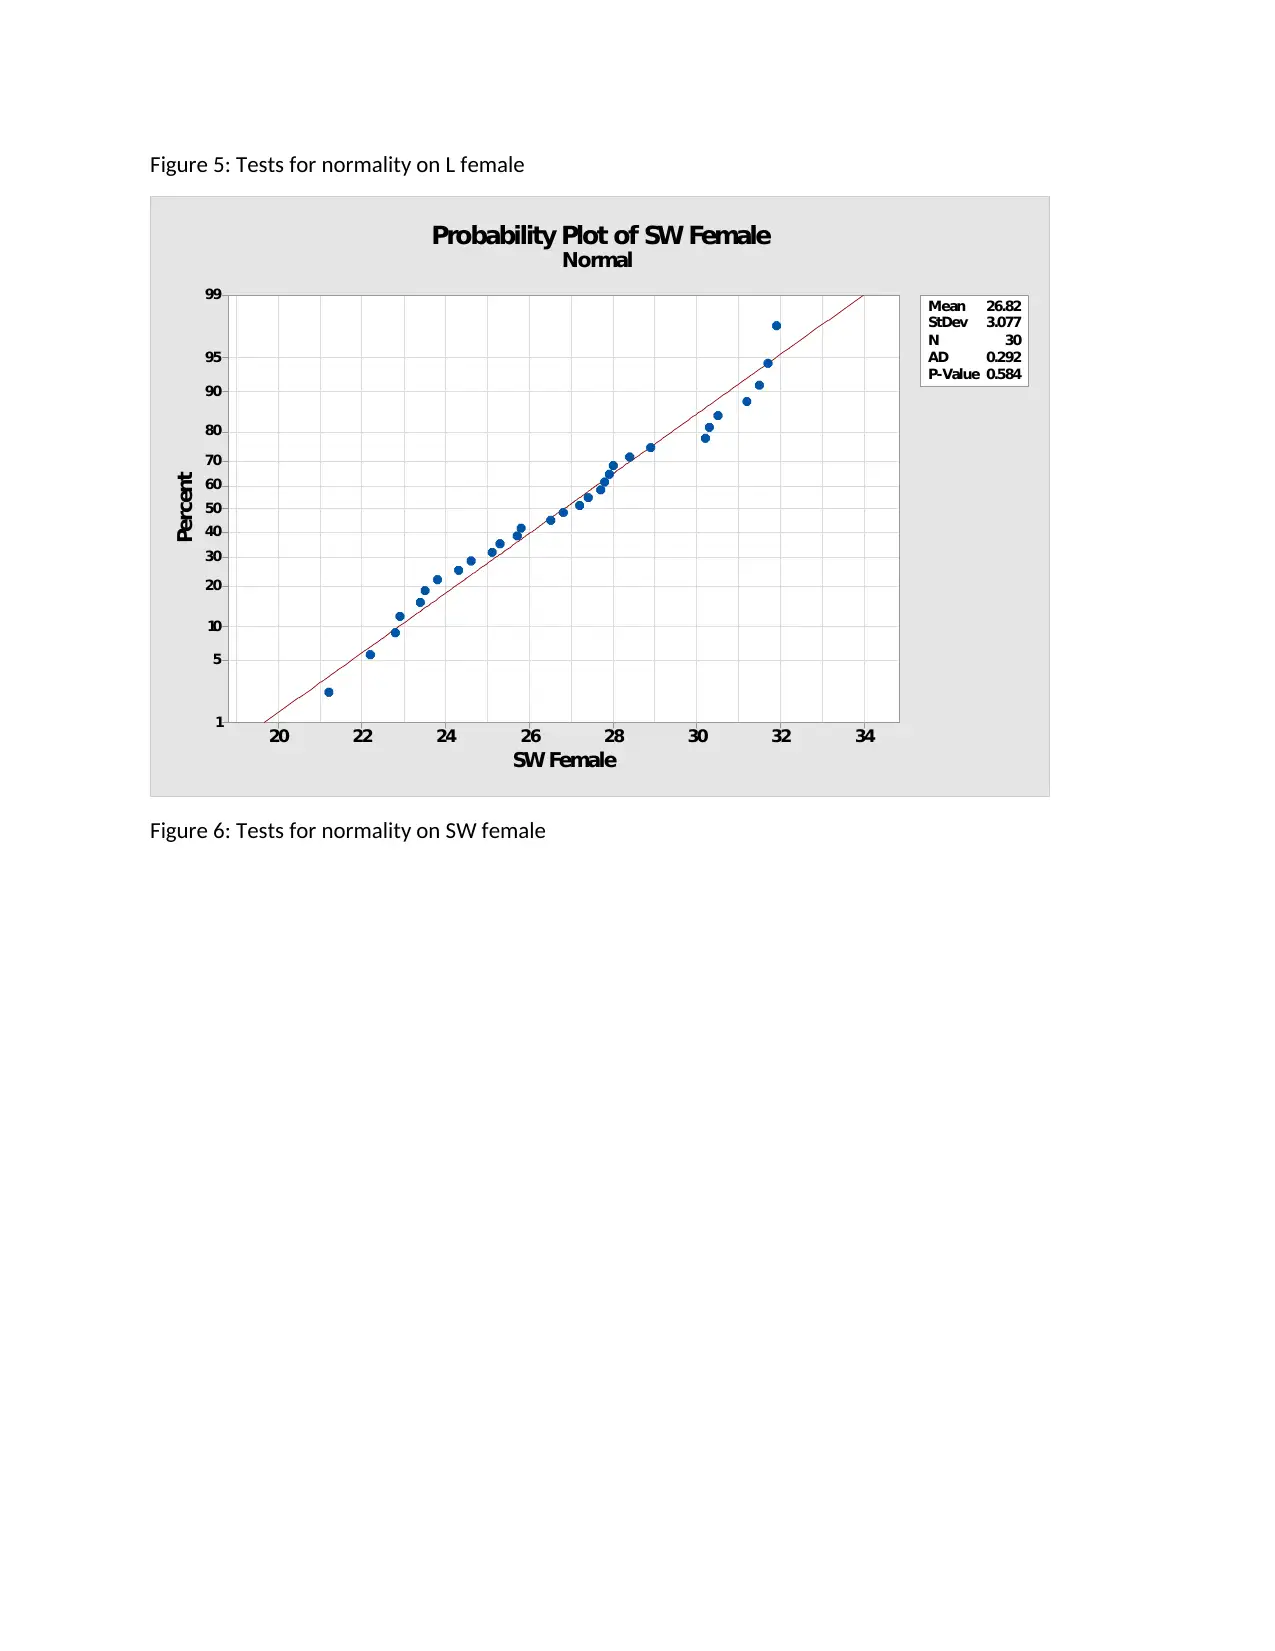
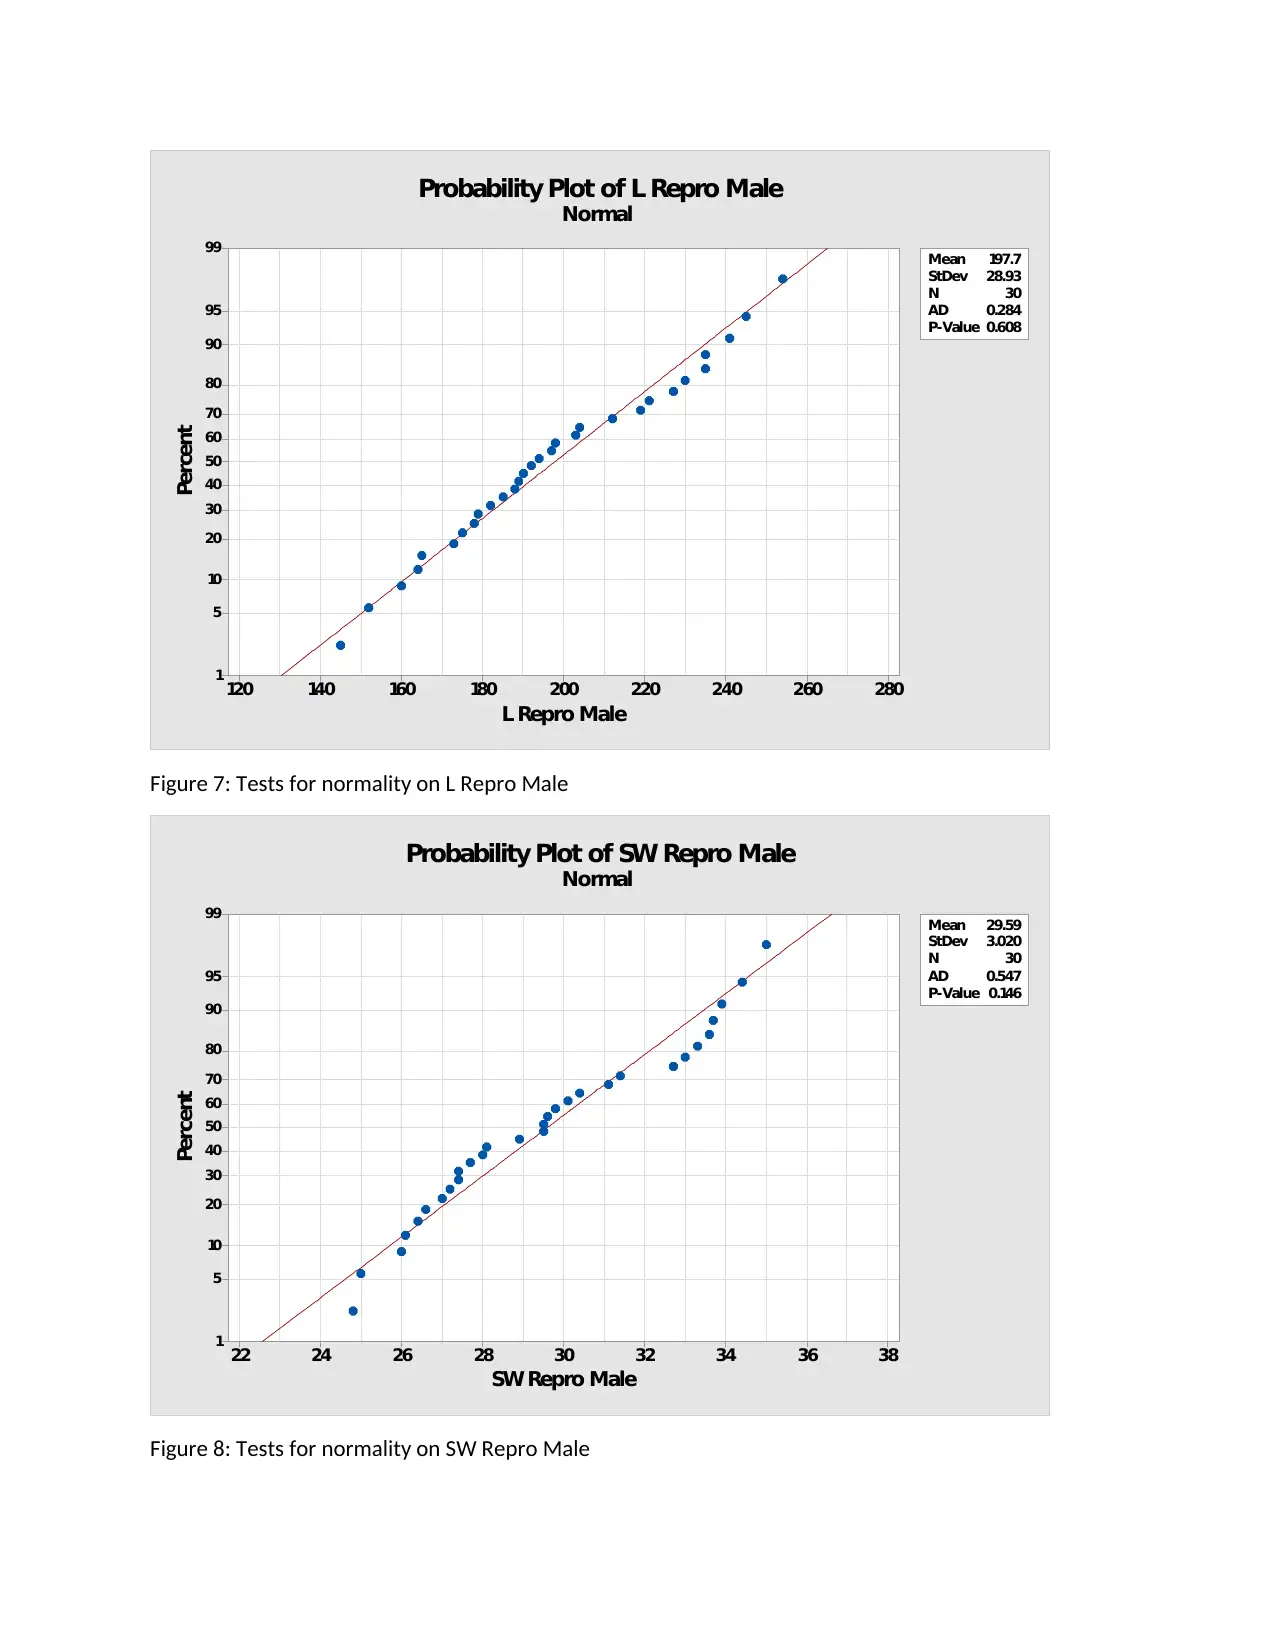
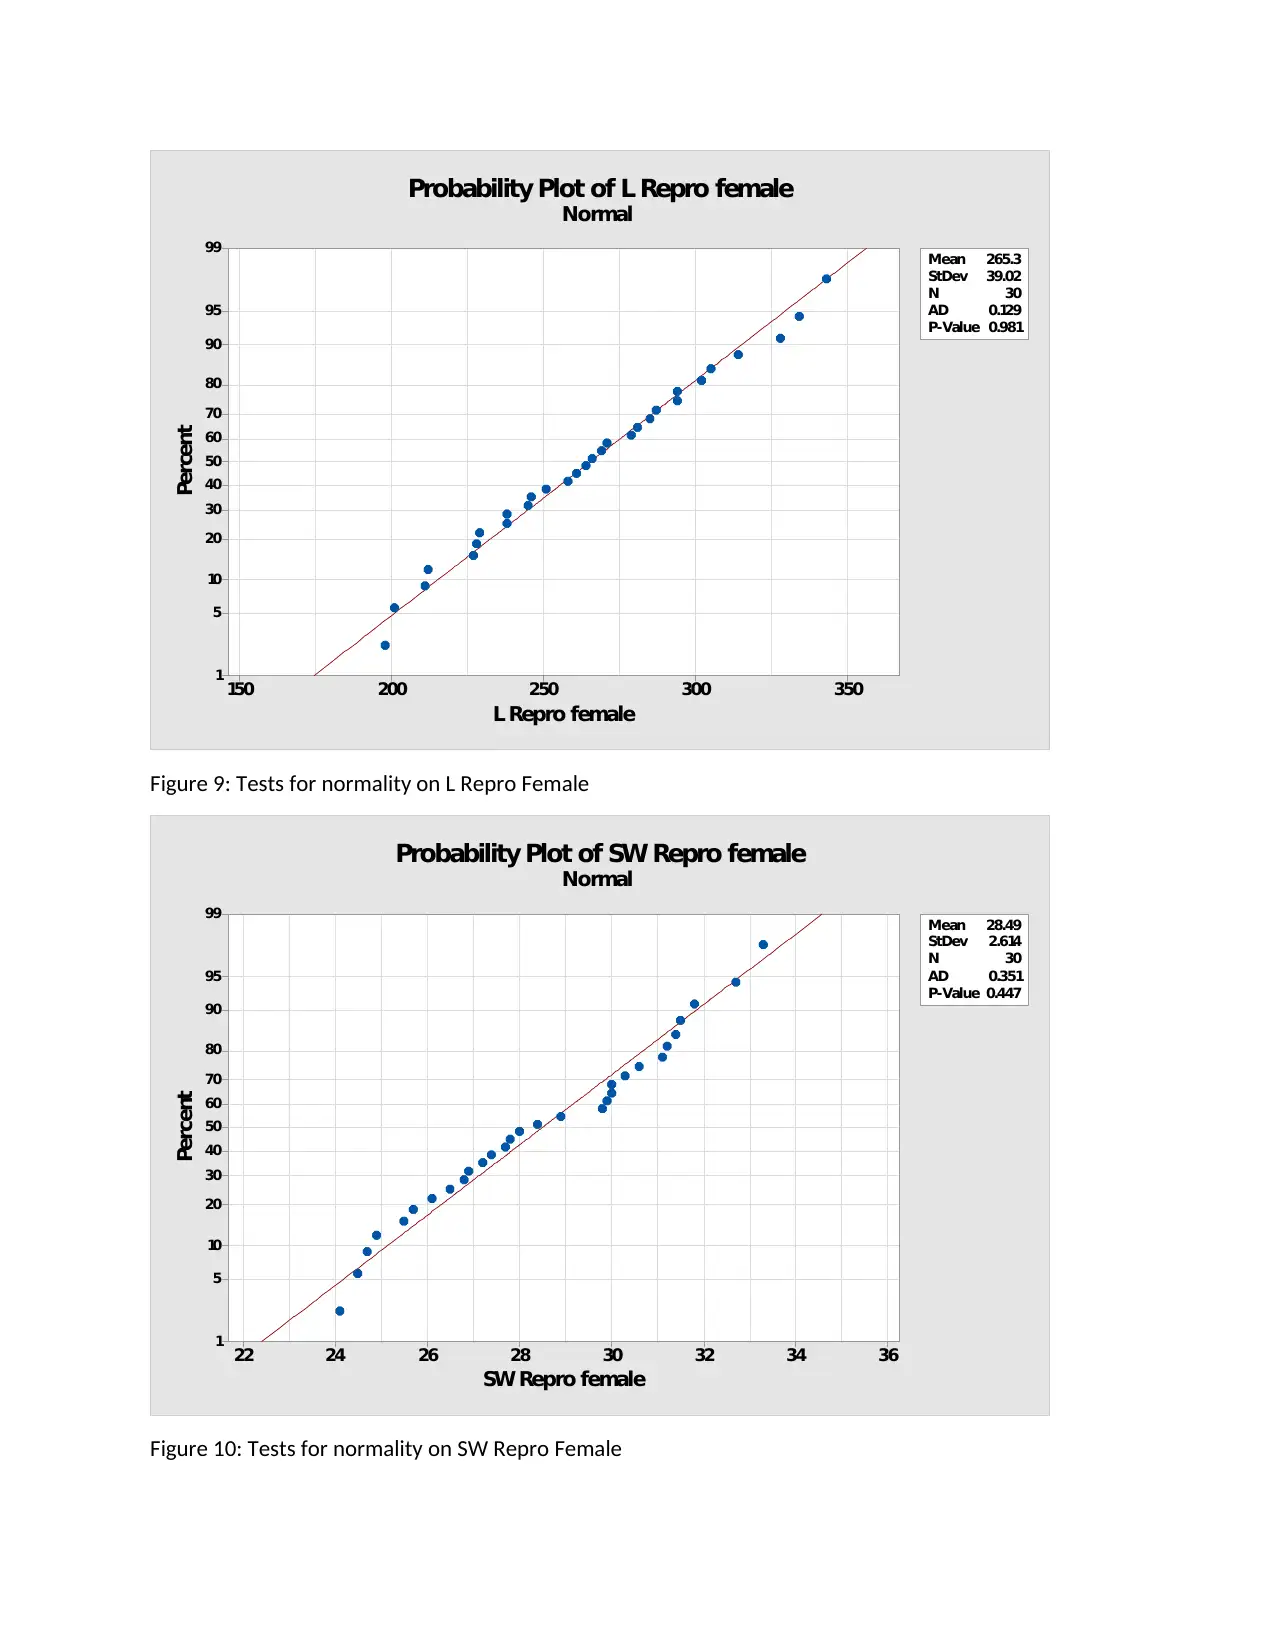
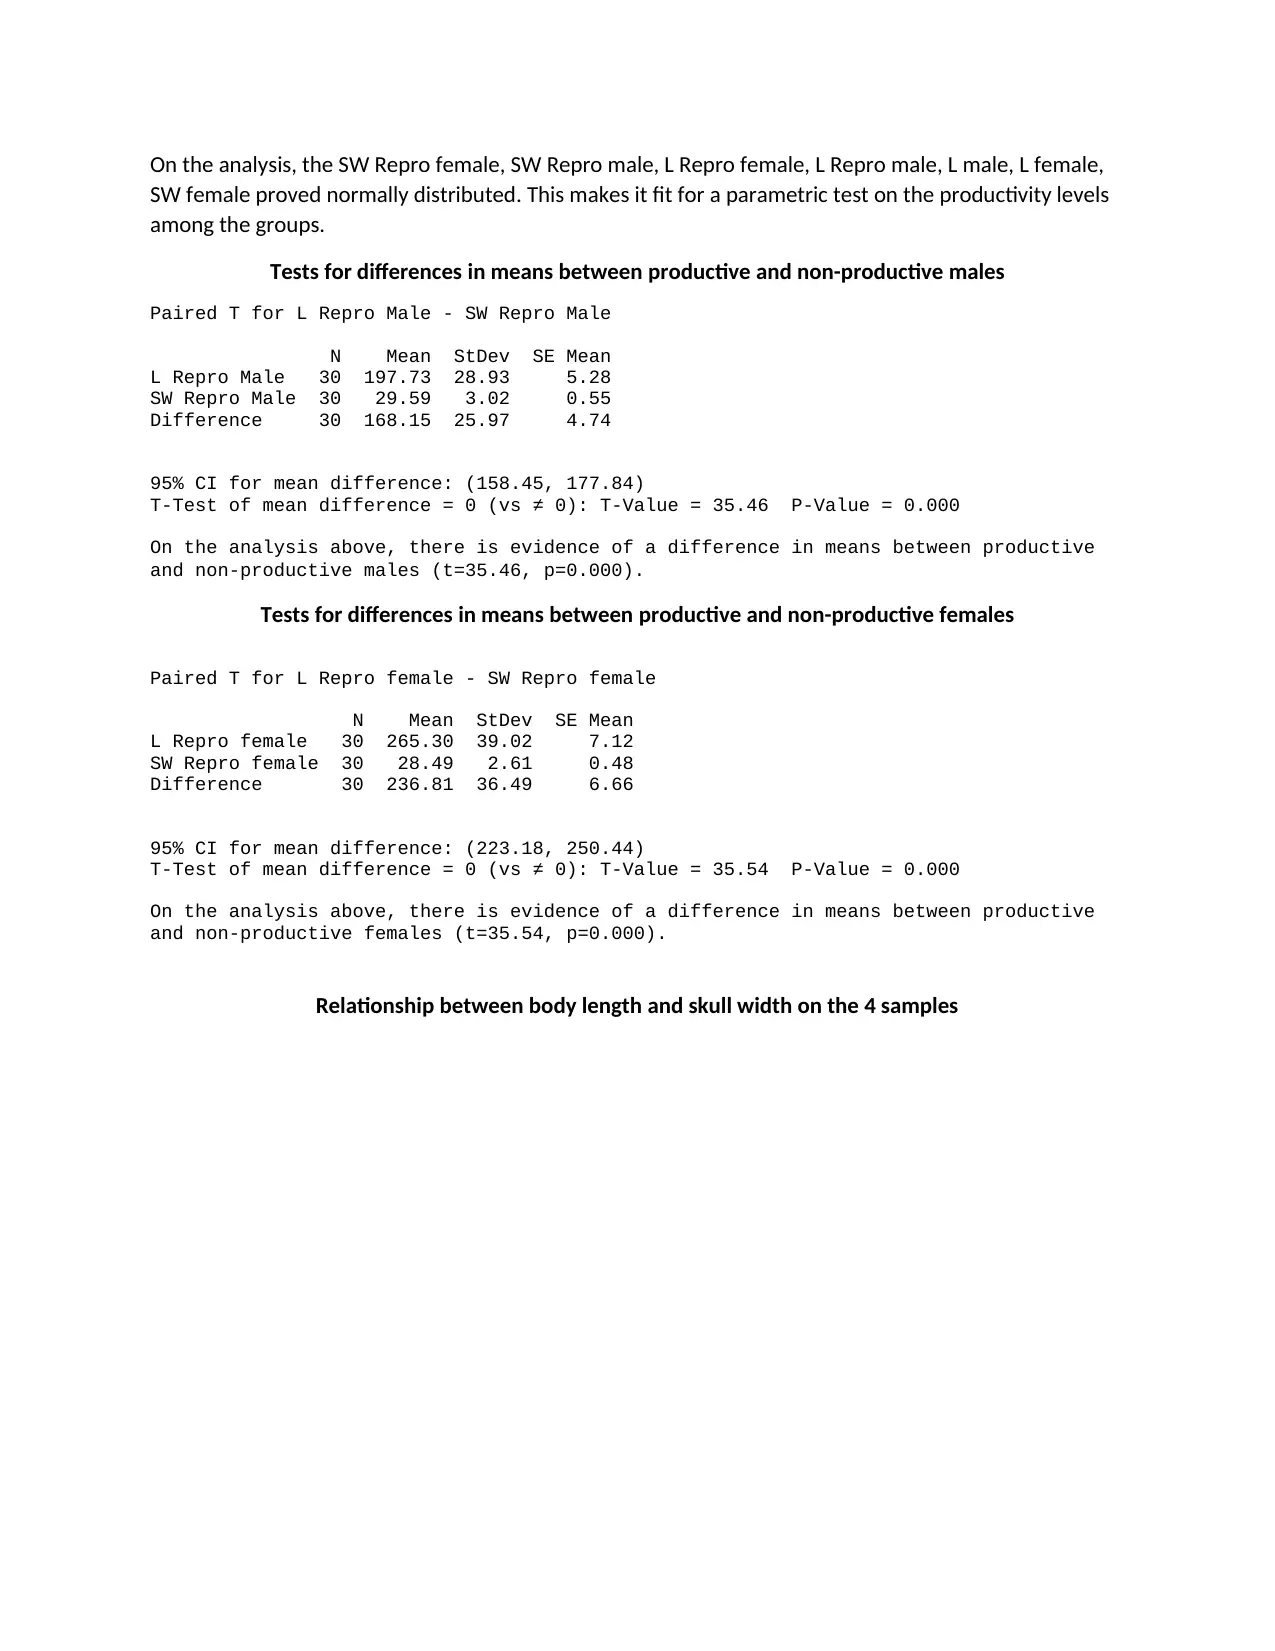
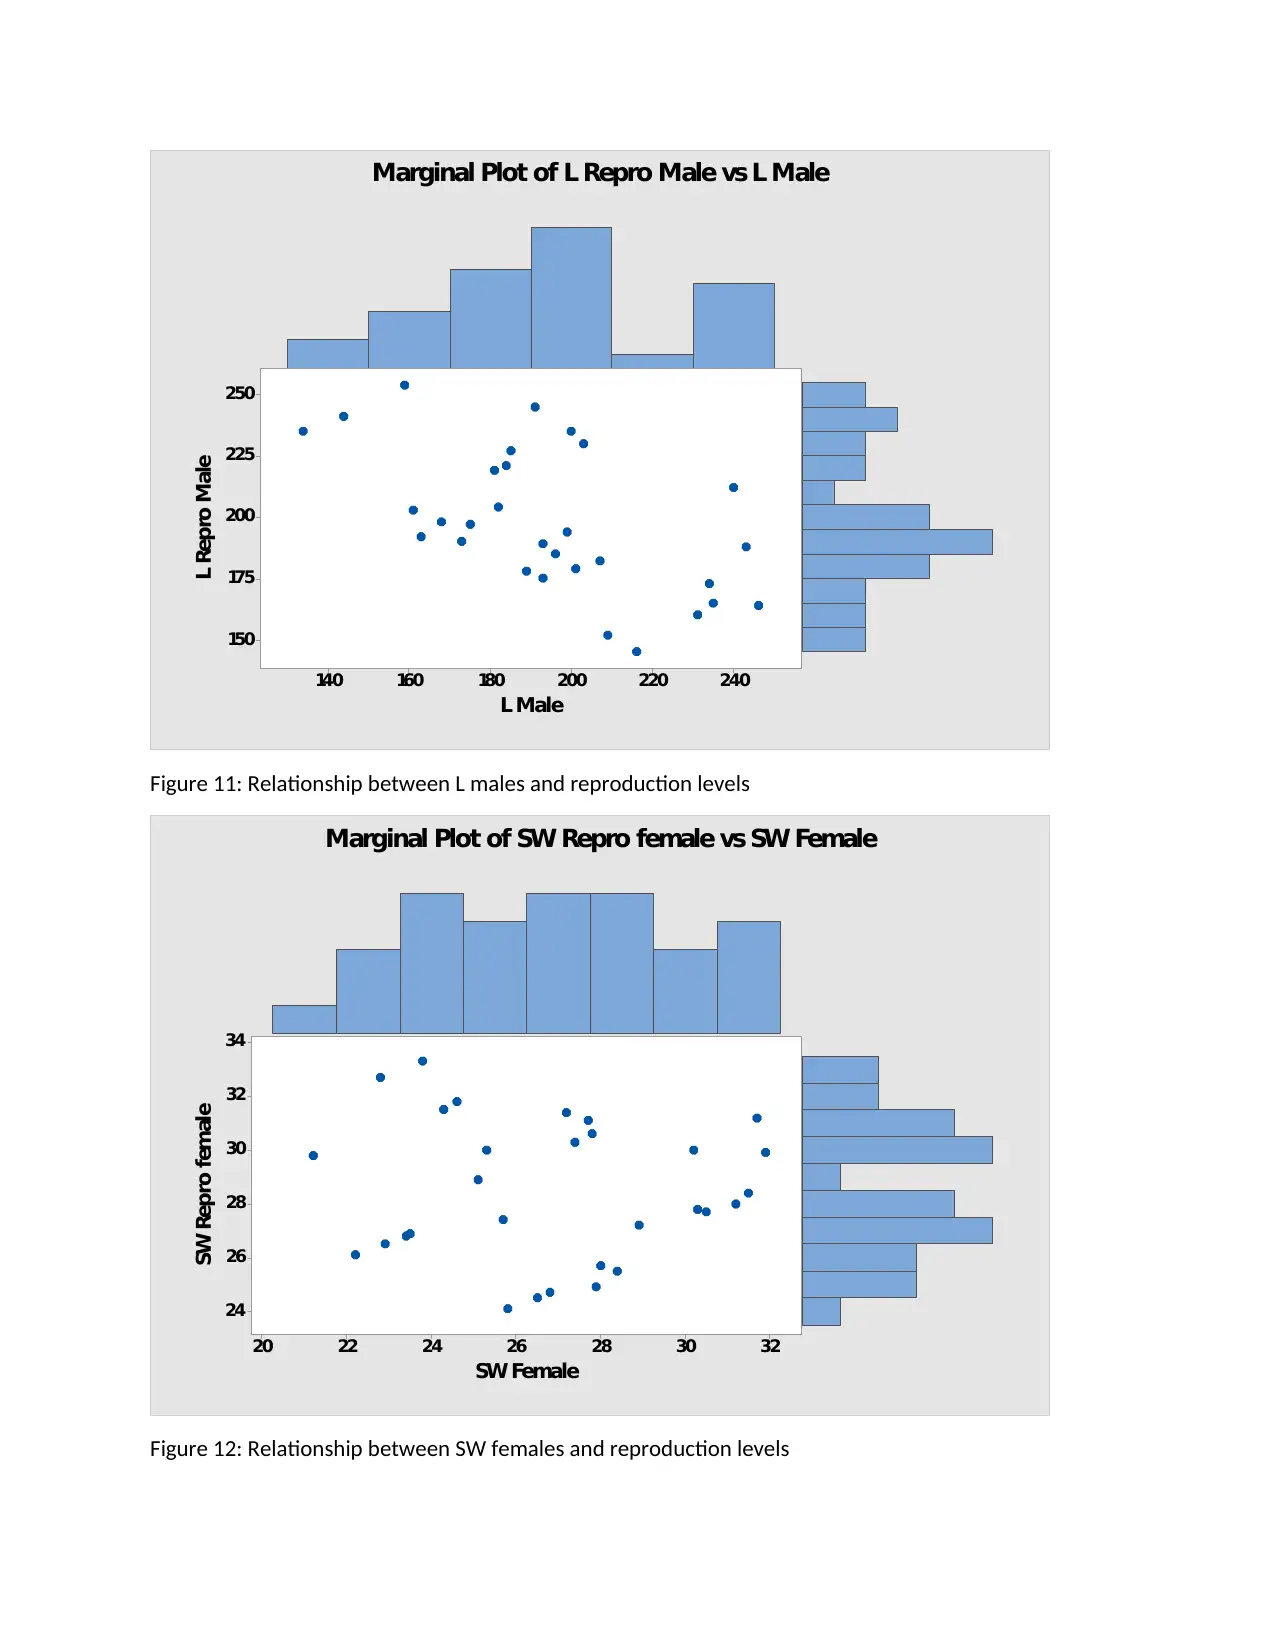
This report presents the analysis of data from a BIO1010 re-sit assignment, focusing on measurements of naked mole rats. The analysis includes summary statistics for body length and skull width across different groups (male, female, reproductive). Normality tests were conducted, and the data was found to be normally distributed for several groups. Paired t-tests were performed to compare means between productive and non-productive males and females, revealing significant differences. The report also includes bar charts and discusses the relationship between body length and skull width. The analysis was conducted using Minitab, following the guidelines provided in the assignment brief. The report provides a detailed account of the statistical methods used and the interpretation of the results, adhering to the format expected in a scientific paper.

1 out of 9
Related Documents


Your All-in-One AI-Powered Toolkit for Academic Success.
+13062052269
info@desklib.com
Available 24*7 on WhatsApp / Email
![[object Object]](/_next/static/media/star-bottom.7253800d.svg)
Copyright © 2020–2026 A2Z Services. All Rights Reserved. Developed and managed by ZUCOL.