Analysis of Supply Chain Management for Vector Valves Ltd, 2018-19
VerifiedAdded on 2023/04/06
|30
|4152
|248
Report
AI Summary
This report analyzes the supply chain management of Vector Valves Ltd, a company specializing in valve manufacturing with operations in the USA and UK. The report examines key aspects including forecasting and demand management, master scheduling, and inventory control. It delves into customer relationships, demand forecasting methods (including weighted average, linear regression, and exponential smoothing), and forecast accuracy. The analysis covers master production schedules, MRP, and inventory control techniques such as fixed order quantity and economic order quantity, as well as ABC analysis. The report aims to understand the current processes and recommend improvements to enhance the company's supply chain efficiency and effectiveness. The report concludes with recommendations for improving Vector Valves' approach to master planning and inventory control, based on the analysis of its current practices.
Supply Chain
Paraphrase This Document
Need a fresh take? Get an instant paraphrase of this document with our AI Paraphraser
Contents
1. Introduction.............................................................................................................................................3
Forecasting and demand management.........................................................................................................3
Understanding Customer relationship and Expectation and Values.....................................................3
Demand forecasting.............................................................................................................................4
Forecasting..................................................................................................................................................7
Demand management..............................................................................................................................7
Forecasting methods...............................................................................................................................7
Short range demand on forecasting........................................................................................................8
Weighted Average methods.................................................................................................................8
Linear regression.................................................................................................................................9
Exponential smoothing......................................................................................................................10
Forecast accuracy..............................................................................................................................12
Master scheduling......................................................................................................................................13
Master production schedule and production plan...................................................................................13
Master scheduling decision....................................................................................................................13
MRP and delivery promise....................................................................................................................14
Inventory control.......................................................................................................................................15
Nature of the inventory control..............................................................................................................15
Need of inventory control......................................................................................................................15
Inventory control techniques.................................................................................................................17
Fixed order quality................................................................................................................................17
Economic order quality.........................................................................................................................18
Making steps of ABC analysis...............................................................................................................18
Control based on ABC classification.....................................................................................................20
Conclusion.................................................................................................................................................21
References.................................................................................................................................................21
List ofFigures
Figure 1-Dependent and independent demand................................................................................6
Figure 2-Analyzing the order product normal distribution..............................................................7
Figure 3-Planning the order stock system.......................................................................................8
Figure 4-Planning Assemble ordering process................................................................................8
Figure 5-master production planning.............................................................................................15
Figure 6-Initial stage of material required planning......................................................................16
Figure 7-Customer account of the material of supply chain demand............................................17
Figure 8- Inventory control of the planning process.....................................................................18
Figure 9-Buffer inventory supply chain demand operation...........................................................19
Figure 10-Inventory control of the supply chain demand of normal distribution.........................20
Figure 11-Ordering process of inventory control demand............................................................21
⊘ This is a preview!⊘
Do you want full access?
Subscribe today to unlock all pages.
Trusted by 1+ million students worldwide
1. Introduction
The aim of this project is to implement and analyze the victory valves Ltd Company
using supply chain management system. Division of vector valves which specifies Murry
Engineering Firm. The manufacture of the valves company cans which specifies in the USA and
the UK Company for the markets in Europe. The vector valves company that can assign different
kind of department for the propose of improving the business of the inventory management for
the main role and responsibility on managing Directors, REG FOX sales manager, Peter nuttall
Finance Director, Engineering Directors, manufacturing manager of the company.
This research’s main objective is to understand and analyze the vector valves supply
chain management process which can use the three methods that includes, the forecasting and
demand management, master scheduling, inventory management of the system. And finally for
analyzing the Vector's major approach to master planning and inventory control and recommend
improvement so it shall be investigated.
Forecasting and demand management
The forecasting of the market place where there exists suppliers who supply the raw
material, parts of the assemblers, and they also assemble the completed product followed by
shipping the products in a large quantity to its distributors. The distributors helps in distributing
the completed products to its retailers. The retailers sell the received products to their customers.
Thus, it is the consumers who are the end users/ final consumers. There even exists some
competitors for competing the similar marketplace with same products or substitute products.
The demand management contains the understanding of basic market and the target of
customer’s expectations, then the value’s definition and demand forecasting and demand
planning’s fundamental overview (CARTER, 2011).
Understanding Customer relationship and Expectation and Values
Forecasting of the customer’s exception values, which are used for the critical importance
for the outbound bycustomer logistics system. Value the increasing requirements of effective
demand management of supply chain system (HITT, 2011).The customer who is aware of the
types of forecasts which are required to understand the collaboration amount trading partners can
support the complete process of forecasting and demand management (Reimann&Ketchen,
Paraphrase This Document
Need a fresh take? Get an instant paraphrase of this document with our AI Paraphraser

2017). Find the primary steps for order fulfillment process, and understand how the effective
order management could create value for the firm along with its customers. Additionally, the
customer service meaning must be realizedby understanding its significance forthe logistics and
supply chain management system ("Special Topic Forum onResources and Supply Chain
Management", 2013).
Demand forecasting
Demand forecasting has been used to enable the vector valves companyto take several
business decisions like production process planning, ordering raw material, managing the funds
and price deciding for every single product to deliver the customer (Svensson, 2010). The
demand forecasting of the vector sales of the standardary valves in 500 types of products. The
customer can order the product for delivery within the demand value of two weeks after placing
the order. Consider the sales by type of valves ranging from £500K and most popular to about
£10K; it is lower volume type of the forecasting demand ("Special Topic Forumon Power in
Supply Chain Management", 2015).
Finding the forecast demand on the new valve sales on 1995, it will analyze 70 percent which is
used for designing and 30percent is used for made to order (Tachizawa& Wong, 2015).
Nature of Demand and Supply chain system
Analyzing the demand supply chain’s demand which contains the following two types,
Dependent demand
Independent demand
Independent demand has been used for the normal distribution of the final product pattern
demands.Dependent demand has been used for the Demand pattern of the highly variable type
components and materials of the product (Priem&Swink, 2012).
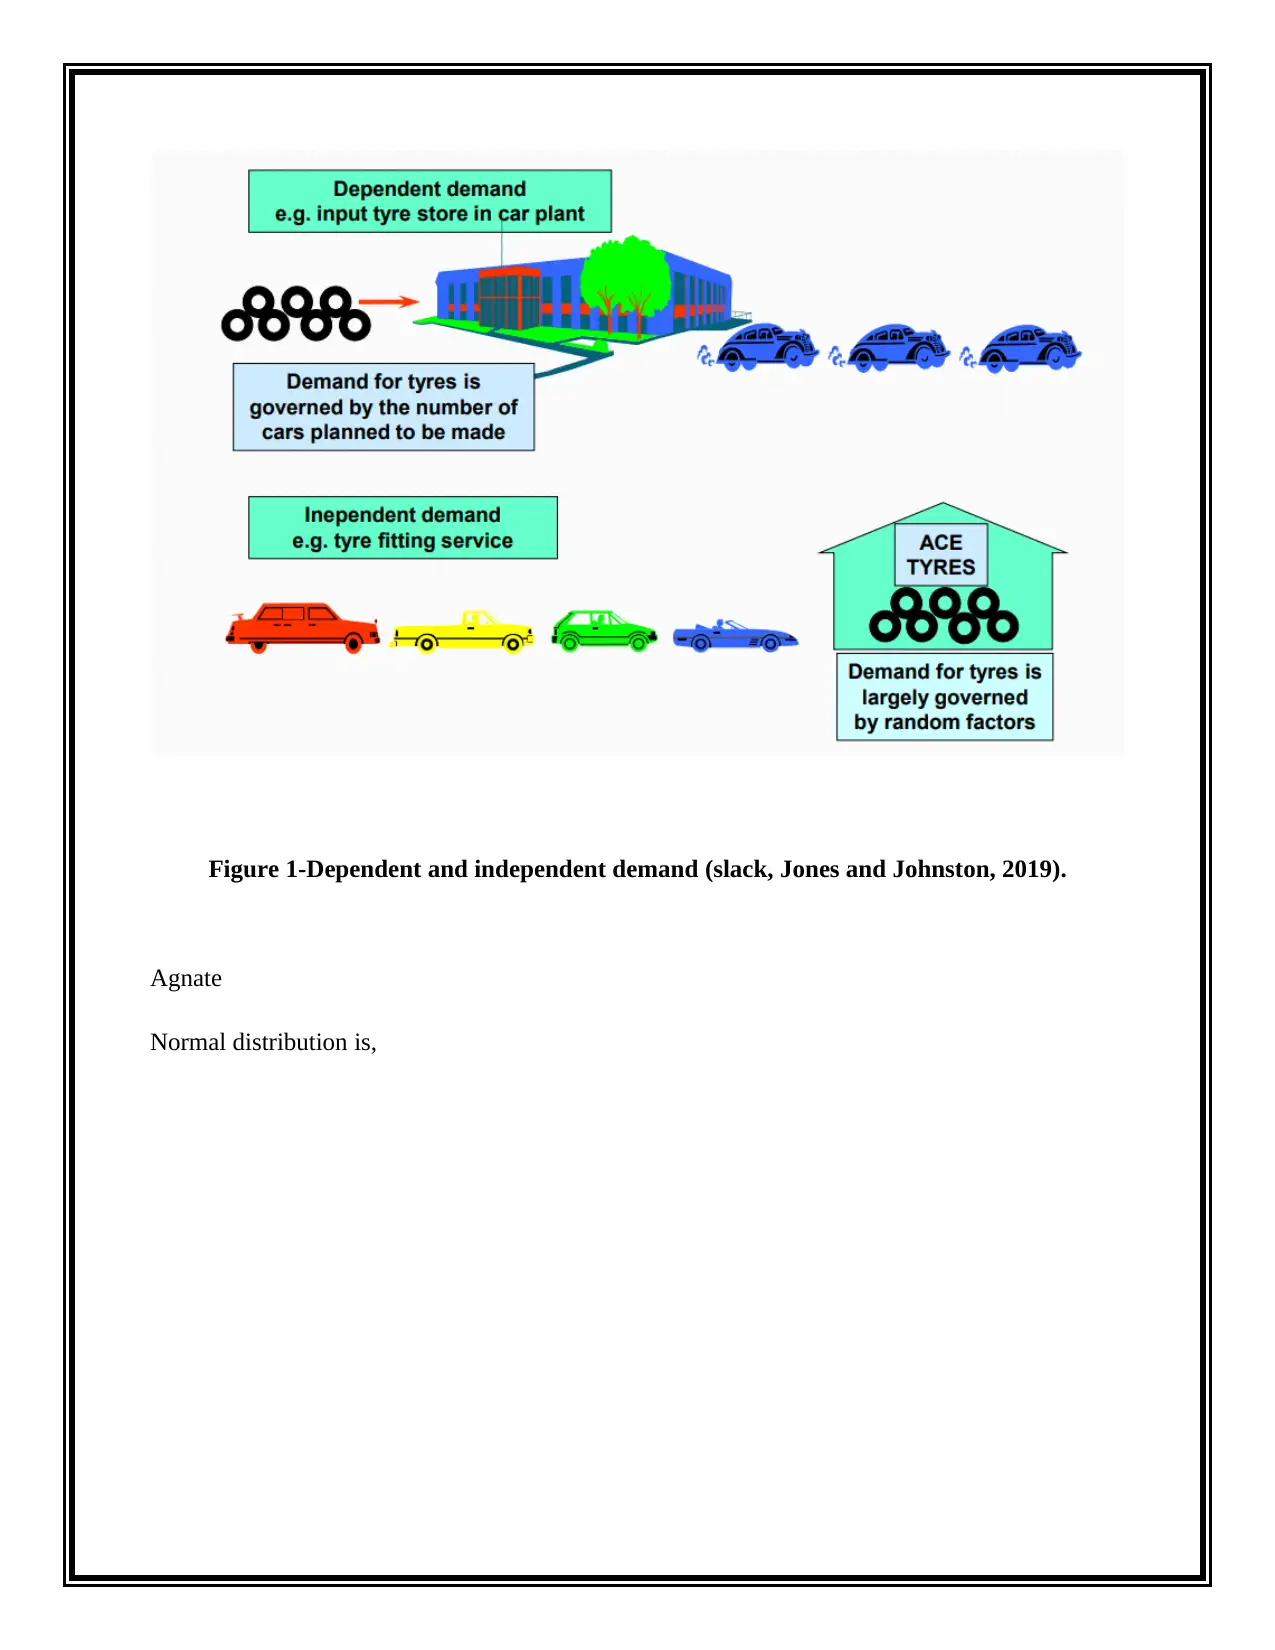
Figure 1-Dependent and independent demand (slack, Jones and Johnston, 2019).
Agnate
Normal distribution is,
Agnate
Normal distribution is,
⊘ This is a preview!⊘
Do you want full access?
Subscribe today to unlock all pages.
Trusted by 1+ million students worldwide

Figure 2-Analyzing the order product normal distribution (slack, Jones and Johnston,
2019).
The dependent and Independent Demands of the Demand Supply Chain specify the
average and the Standard Deviation ("Supply Chain Model on Uncertainty Demand", 2015). The
dependent demand of the forecast is used for production schedule at the same also used to
identify the item demands of the product for the supply chain system. To specify the product
range of the supply chain has been used for the manufacturing lead of the standard deviation
which specifies the three week of the smaller range of products. Assemble to order type product
which is 12 weeks for the larger standard deviation on customized product. The “Make to order”
of the custom product of the raw material is 2500 components and the Product order is 1250 of
the supply chain, which is a very large demand. The engineer who has to order the product on the
large range is 750 unique products on the supply chain system (Yan, 2014).
Paraphrase This Document
Need a fresh take? Get an instant paraphrase of this document with our AI Paraphraser
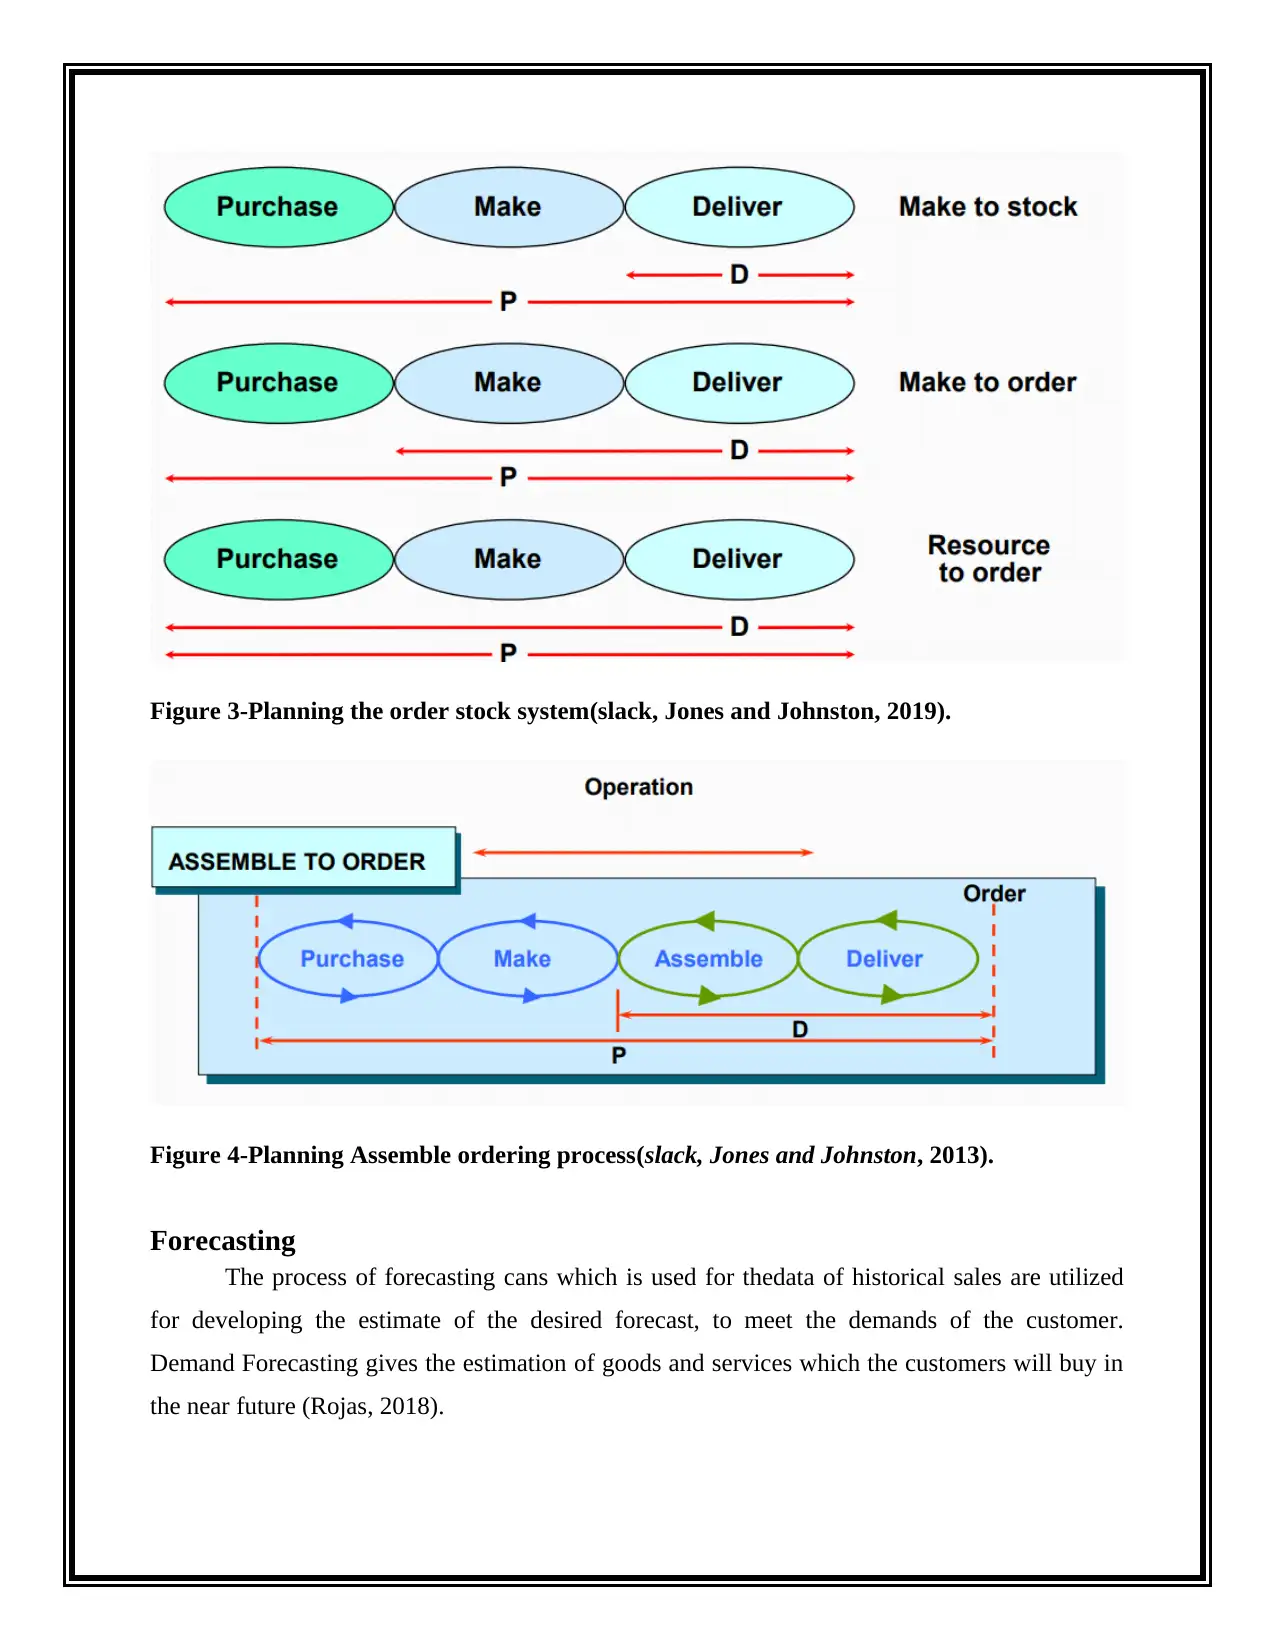
Figure 3-Planning the order stock system(slack, Jones and Johnston, 2019).
Figure 4-Planning Assemble ordering process(slack, Jones and Johnston, 2013).
Forecasting
The process of forecasting cans which is used for thedata of historical sales are utilized
for developing the estimate of the desired forecast, to meet the demands of the customer.
Demand Forecasting gives the estimation of goods and services which the customers will buy in
the near future (Rojas, 2018).
Demand management
The term ‘Demand Management’ refers to the management of both sales forecast and
customer orders processes, which can involveand also includes:
Sales forecasting
Physical distribution
Order promising
Sales order entry
Customer service
Management action of the demand forecasting is,
Increase production
Decrease production
Ease off on selling/promotional effort
Increase selling/promotional effort
Forecasting methods
There contains 4 primary forecasting methods which the financial analysts utilize for
predicting the future revenues, capital costs and expensesof a business. However, there are
various quantitative budget forecasting tools which are utilized frequently. In this article,only the
top 4 methods will be discussed namely- straight-line, simple linear regression, moving average,
and multiple linear regressions (Hong, Xie& Black, 2019).
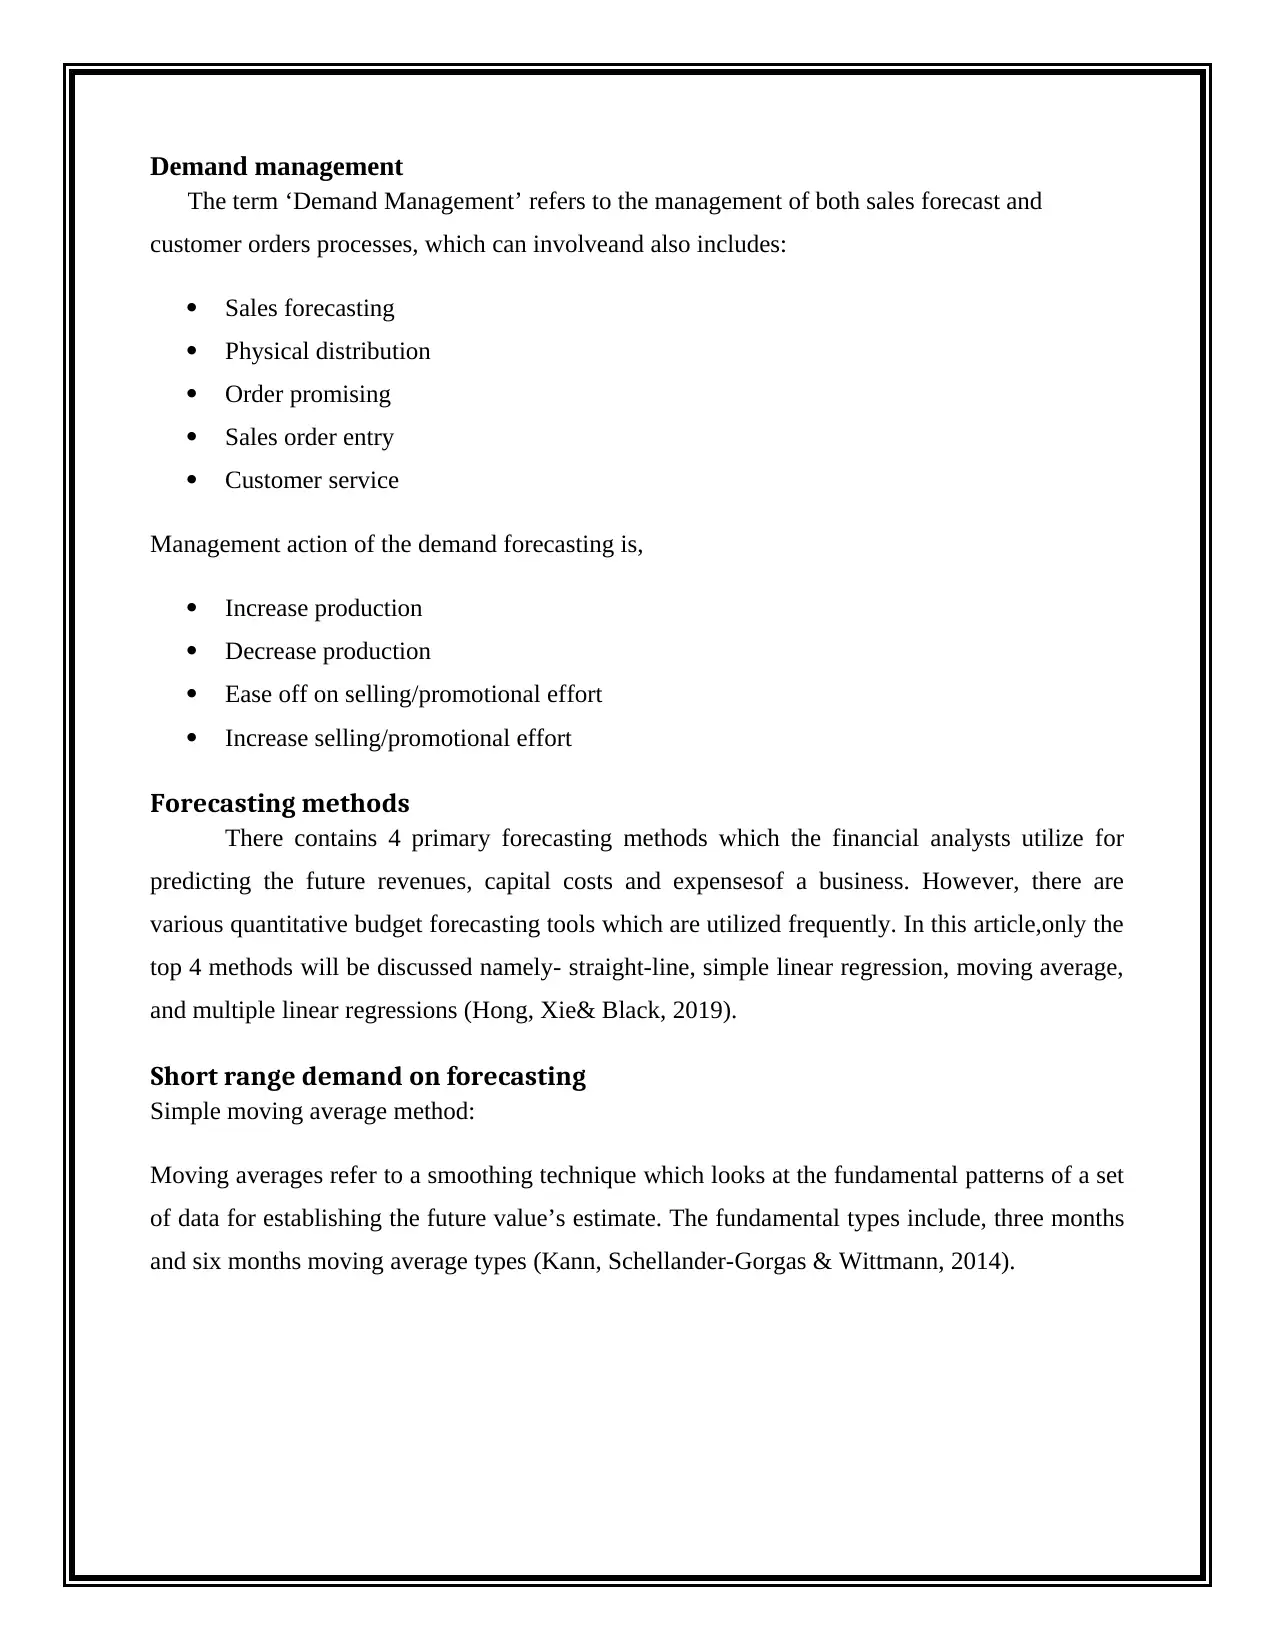
Short range demand on forecasting
Simple moving average method:
Moving averages refer to a smoothing technique which looks at the fundamental patterns of a set
of data for establishing the future value’s estimate. The fundamental types include, three months
and six months moving average types (Kann, Schellander-Gorgas & Wittmann, 2014).
The term ‘Demand Management’ refers to the management of both sales forecast and
customer orders processes, which can involveand also includes:
Sales forecasting
Physical distribution
Order promising
Sales order entry
Customer service
Management action of the demand forecasting is,
Increase production
Decrease production
Ease off on selling/promotional effort
Increase selling/promotional effort
Forecasting methods
There contains 4 primary forecasting methods which the financial analysts utilize for
predicting the future revenues, capital costs and expensesof a business. However, there are
various quantitative budget forecasting tools which are utilized frequently. In this article,only the
top 4 methods will be discussed namely- straight-line, simple linear regression, moving average,
and multiple linear regressions (Hong, Xie& Black, 2019).
Short range demand on forecasting
Simple moving average method:
Moving averages refer to a smoothing technique which looks at the fundamental patterns of a set
of data for establishing the future value’s estimate. The fundamental types include, three months
and six months moving average types (Kann, Schellander-Gorgas & Wittmann, 2014).
⊘ This is a preview!⊘
Do you want full access?
Subscribe today to unlock all pages.
Trusted by 1+ million students worldwide
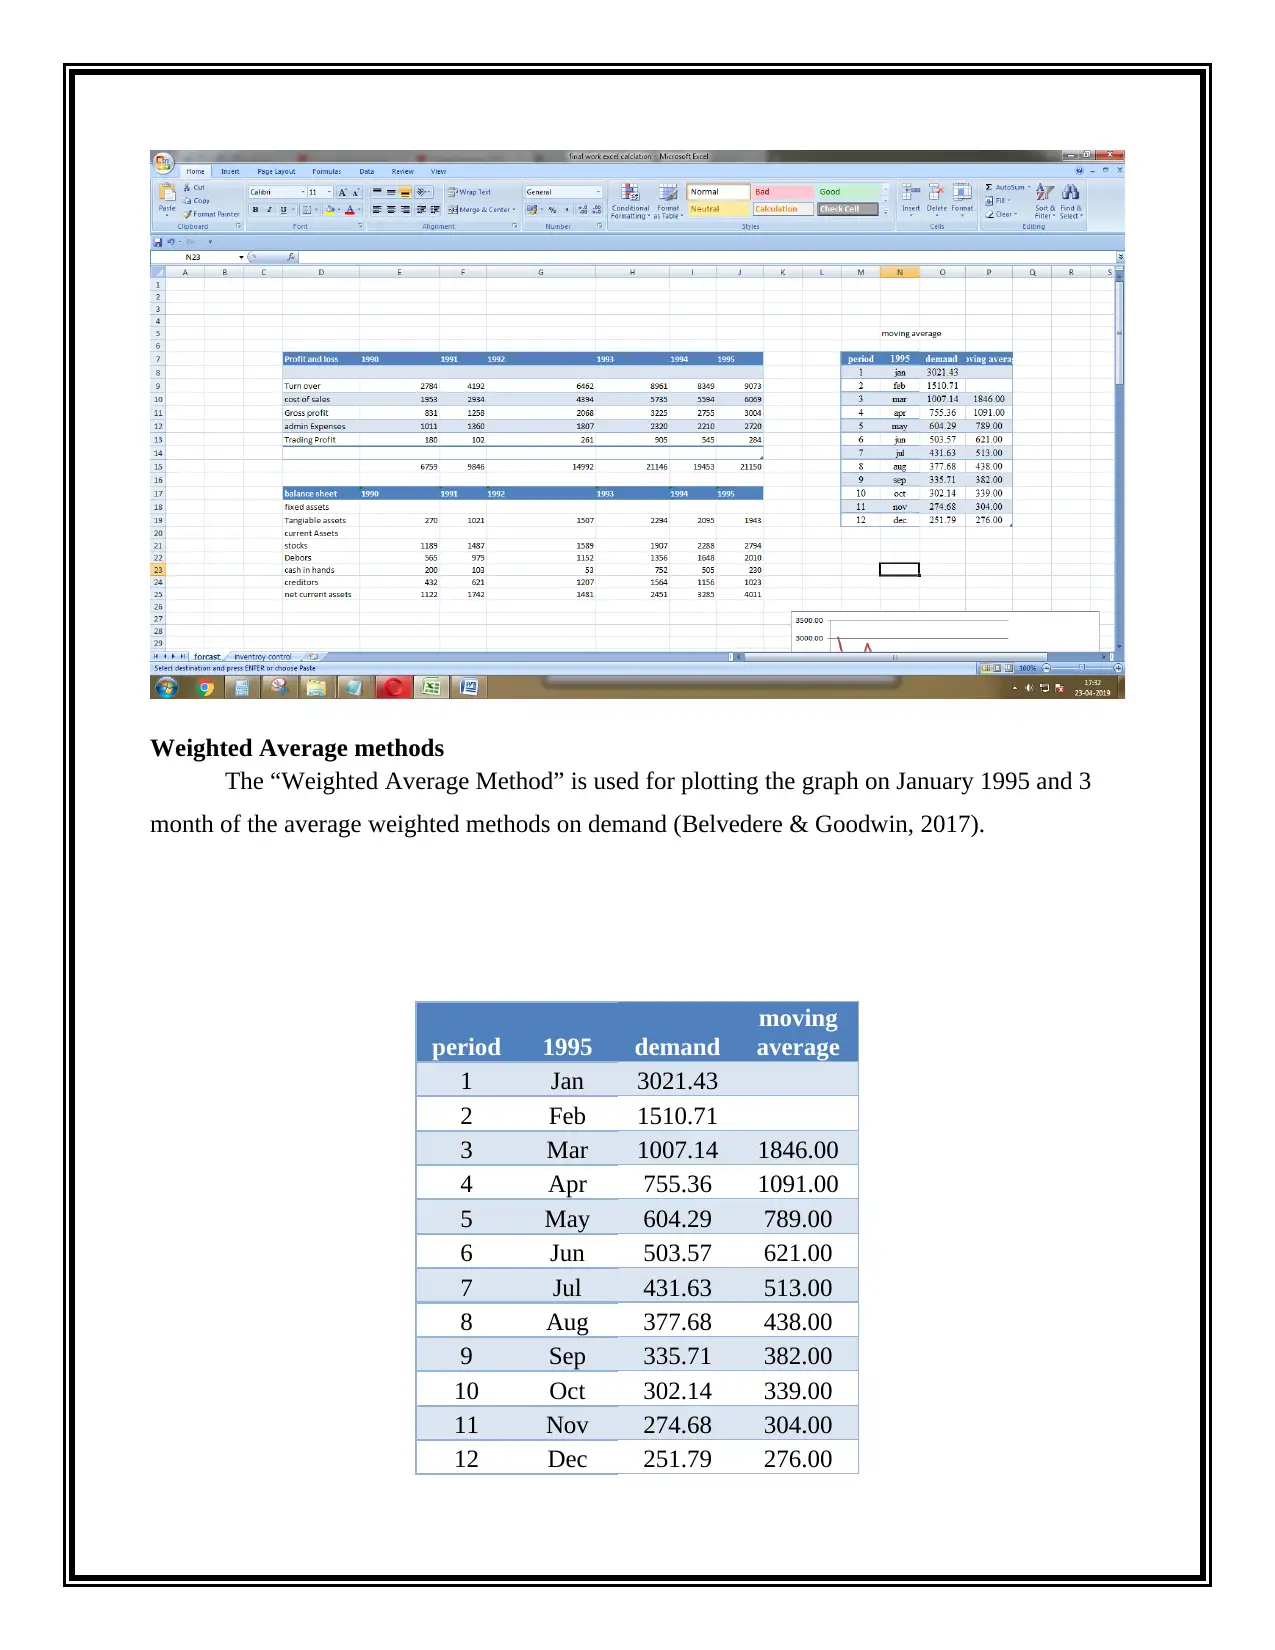
Weighted Average methods
The “Weighted Average Method” is used for plotting the graph on January 1995 and 3
month of the average weighted methods on demand (Belvedere & Goodwin, 2017).
period 1995 demand
moving
average
1 Jan 3021.43
2 Feb 1510.71
3 Mar 1007.14 1846.00
4 Apr 755.36 1091.00
5 May 604.29 789.00
6 Jun 503.57 621.00
7 Jul 431.63 513.00
8 Aug 377.68 438.00
9 Sep 335.71 382.00
10 Oct 302.14 339.00
11 Nov 274.68 304.00
12 Dec 251.79 276.00
Paraphrase This Document
Need a fresh take? Get an instant paraphrase of this document with our AI Paraphraser

Linear regression
“Linear Regression Element” and add both the horizontal axis and vertical axis titles.
Rename the vertical axis as, “Revenue” and the horizontal axis as, “Number of radio ads.”
Change the chart title as, “Relationship between ads and revenue.”March 2015 and the upward
trend from June 1995 of the 6 previous periods as the basis for each month’s forecast of the value
is 251.79 and 276.00 (Huang, 2013).
Exponential smoothing
The exponential smoothing cost which is specified the sales for the next period of the
forecast on of the actual sales demand. The plot the demand graph and consider the alpha lines of
the graph is 0 and 1 the constant alpha value is 0.3 and find the demand forecast value.
Previous demand value+ alpha constant value*new demand value-previous demand value
week Actual demand demand forcast
1 3021.43 782.80
2 1510.71 1454.39
3 1007.41 1187.95
4 755.36 1187.95
5 604.29 1249.26
6 503.57 1249.26
7 431.63 1423.09
8 377.68 1423.09
9 355.71 1762.57
10 302.14 1762.57
11 271.68 2479.39
12 251.99 942.04
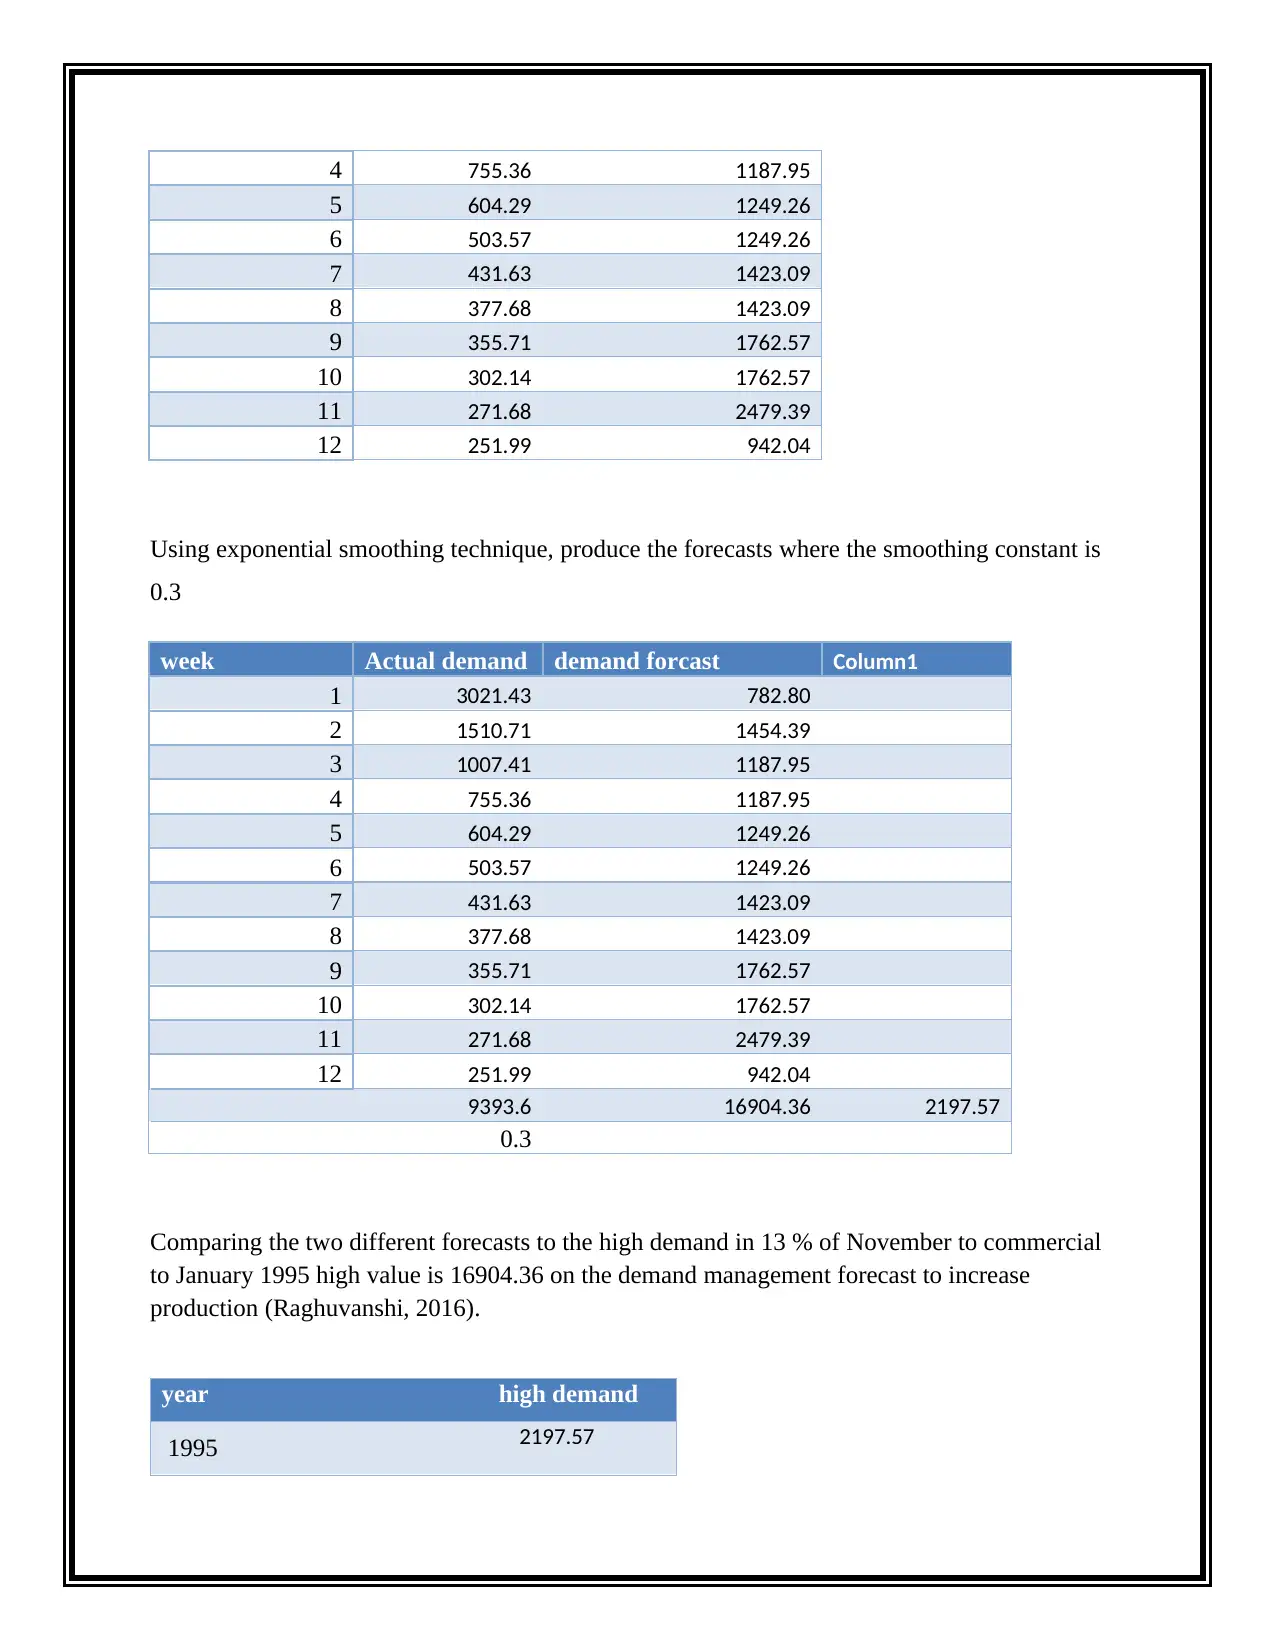
Using exponential smoothing technique, produce the forecasts where the smoothing constant is
0.3
week Actual demand demand forcast Column1
1 3021.43 782.80
2 1510.71 1454.39
3 1007.41 1187.95
4 755.36 1187.95
5 604.29 1249.26
6 503.57 1249.26
7 431.63 1423.09
8 377.68 1423.09
9 355.71 1762.57
10 302.14 1762.57
11 271.68 2479.39
12 251.99 942.04
9393.6 16904.36 2197.57
0.3
Comparing the two different forecasts to the high demand in 13 % of November to commercial
to January 1995 high value is 16904.36 on the demand management forecast to increase
production (Raghuvanshi, 2016).
year high demand
1995 2197.57
5 604.29 1249.26
6 503.57 1249.26
7 431.63 1423.09
8 377.68 1423.09
9 355.71 1762.57
10 302.14 1762.57
11 271.68 2479.39
12 251.99 942.04
Using exponential smoothing technique, produce the forecasts where the smoothing constant is
0.3
week Actual demand demand forcast Column1
1 3021.43 782.80
2 1510.71 1454.39
3 1007.41 1187.95
4 755.36 1187.95
5 604.29 1249.26
6 503.57 1249.26
7 431.63 1423.09
8 377.68 1423.09
9 355.71 1762.57
10 302.14 1762.57
11 271.68 2479.39
12 251.99 942.04
9393.6 16904.36 2197.57
0.3
Comparing the two different forecasts to the high demand in 13 % of November to commercial
to January 1995 high value is 16904.36 on the demand management forecast to increase
production (Raghuvanshi, 2016).
year high demand
1995 2197.57
⊘ This is a preview!⊘
Do you want full access?
Subscribe today to unlock all pages.
Trusted by 1+ million students worldwide
1 out of 30
Related Documents


Your All-in-One AI-Powered Toolkit for Academic Success.
+13062052269
info@desklib.com
Available 24*7 on WhatsApp / Email
![[object Object]](/_next/static/media/star-bottom.7253800d.svg)
Unlock your academic potential
Copyright © 2020–2025 A2Z Services. All Rights Reserved. Developed and managed by ZUCOL.