Supply Chain Financial Analysis: Evaluating NikoTech's Performance
VerifiedAdded on 2023/06/05
|16
|3494
|77
Homework Assignment
AI Summary
This assignment provides a detailed financial analysis of NikoTech's supply chain management performance across two years. It calculates and interprets key performance indicators such as Days of Inventory (DOI), Days of Receivables (DRO), length of the operating cycle, days of payables, and cash-to-cash cycle. The analysis identifies factors driving changes in these metrics, including the impact of cost of goods sold and average receivables. Furthermore, the assignment evaluates the implications of inventory turnover and net profit margin, offering insights into the company's efficiency and profitability. The document concludes by assessing whether changes in inventory turnover indicate positive management performance and how average turnover can help managers.
Running head: SUPPLY CHAIN MANAGEMENT 1
Supply Chain Management
Name of the student:
Name of the University:
Authors Note:
Supply Chain Management
Name of the student:
Name of the University:
Authors Note:
Paraphrase This Document
Need a fresh take? Get an instant paraphrase of this document with our AI Paraphraser
1SUPPLY CHAIN MANAGEMENT
Assignment Questions: Part 1
Question 1.
a) Days of inventory. (DOI). This measures the performance of the business through
using the annual costs from the sales and mean of inventory. Days of receivables
are equal to the company’s year end account receivables divided by the daily
average sales made by the business (Barroso e tal. 2016).
Year 1
Therefore, DOI = (average inventory/COGS) *365
DoI = (495/3266) *365(Natarajarathinam e t al., 2009).
= 55.3
Therefore, it takes the company 55.3 days to sell its average inventory.
Year 2.
DOI = (789/5426) *365
DOI = 53.1.
Thus, it takes the company 53.1 days to sell its average inventory.
b)Days of receivables (DRO).
It simply measures the number of days taken by the company to get all its cash from
the credit sales. It also shows the efficiency and the liquidity of a firm’s collection
departments.
Year 2.
Days of receivables equals to the mean of all the sales divided by the receivables.
DRO = 450/ (1698/365)
DRO = 97 days (Musanzikwa., and Ramchander, 2018).
Therefore, it takes 97 days for the company to get its cash from its credit sales.
2SUPPLY CHAIN MANAGEMENT
Year 1.
DRO = 285/ (1440/365)
DRO = 72 days.
Thus, it takes 72 days for the company to get its cash from its credit sales.
C) Length of the Operating cycle (John and Gardner, 2003).
This simply means the time taken for an inventory to be turned into cash by the
retailers.
Length of the Operating Cycle can be obtained by the summation of receivables and
average inventory.
Year 1.
Inventory turnover = 2.06
Inventory period = 365/2.06 = 177.18
Receivables turnover = 1440/285 = 5.05
Accounts receivable period = 365/5.05 = 72.278
Hence, length of operating cycle = 177.18 + 72.278 = 249.457
Hence, it takes 249 days for the company to get its inventories and real money.
Inventory turnover = 1239/360 = 1.9
Inventory period = 365/1.9 = 192.105 (John and Gardner, 2003).
Receivables turnover = 1698/450 = 3.8
Accounts receivable period = 365/3.8 = 96.052
Hence, length of operating cycle = 1.9 + 96.052 = 97.95
Therefore, it takes approximately 98 days for the company’s inventories and money
from the sales to be received.
Year 1.
DRO = 285/ (1440/365)
DRO = 72 days.
Thus, it takes 72 days for the company to get its cash from its credit sales.
C) Length of the Operating cycle (John and Gardner, 2003).
This simply means the time taken for an inventory to be turned into cash by the
retailers.
Length of the Operating Cycle can be obtained by the summation of receivables and
average inventory.
Year 1.
Inventory turnover = 2.06
Inventory period = 365/2.06 = 177.18
Receivables turnover = 1440/285 = 5.05
Accounts receivable period = 365/5.05 = 72.278
Hence, length of operating cycle = 177.18 + 72.278 = 249.457
Hence, it takes 249 days for the company to get its inventories and real money.
Inventory turnover = 1239/360 = 1.9
Inventory period = 365/1.9 = 192.105 (John and Gardner, 2003).
Receivables turnover = 1698/450 = 3.8
Accounts receivable period = 365/3.8 = 96.052
Hence, length of operating cycle = 1.9 + 96.052 = 97.95
Therefore, it takes approximately 98 days for the company’s inventories and money
from the sales to be received.
⊘ This is a preview!⊘
Do you want full access?
Subscribe today to unlock all pages.
Trusted by 1+ million students worldwide
3SUPPLY CHAIN MANAGEMENT
Question 2.
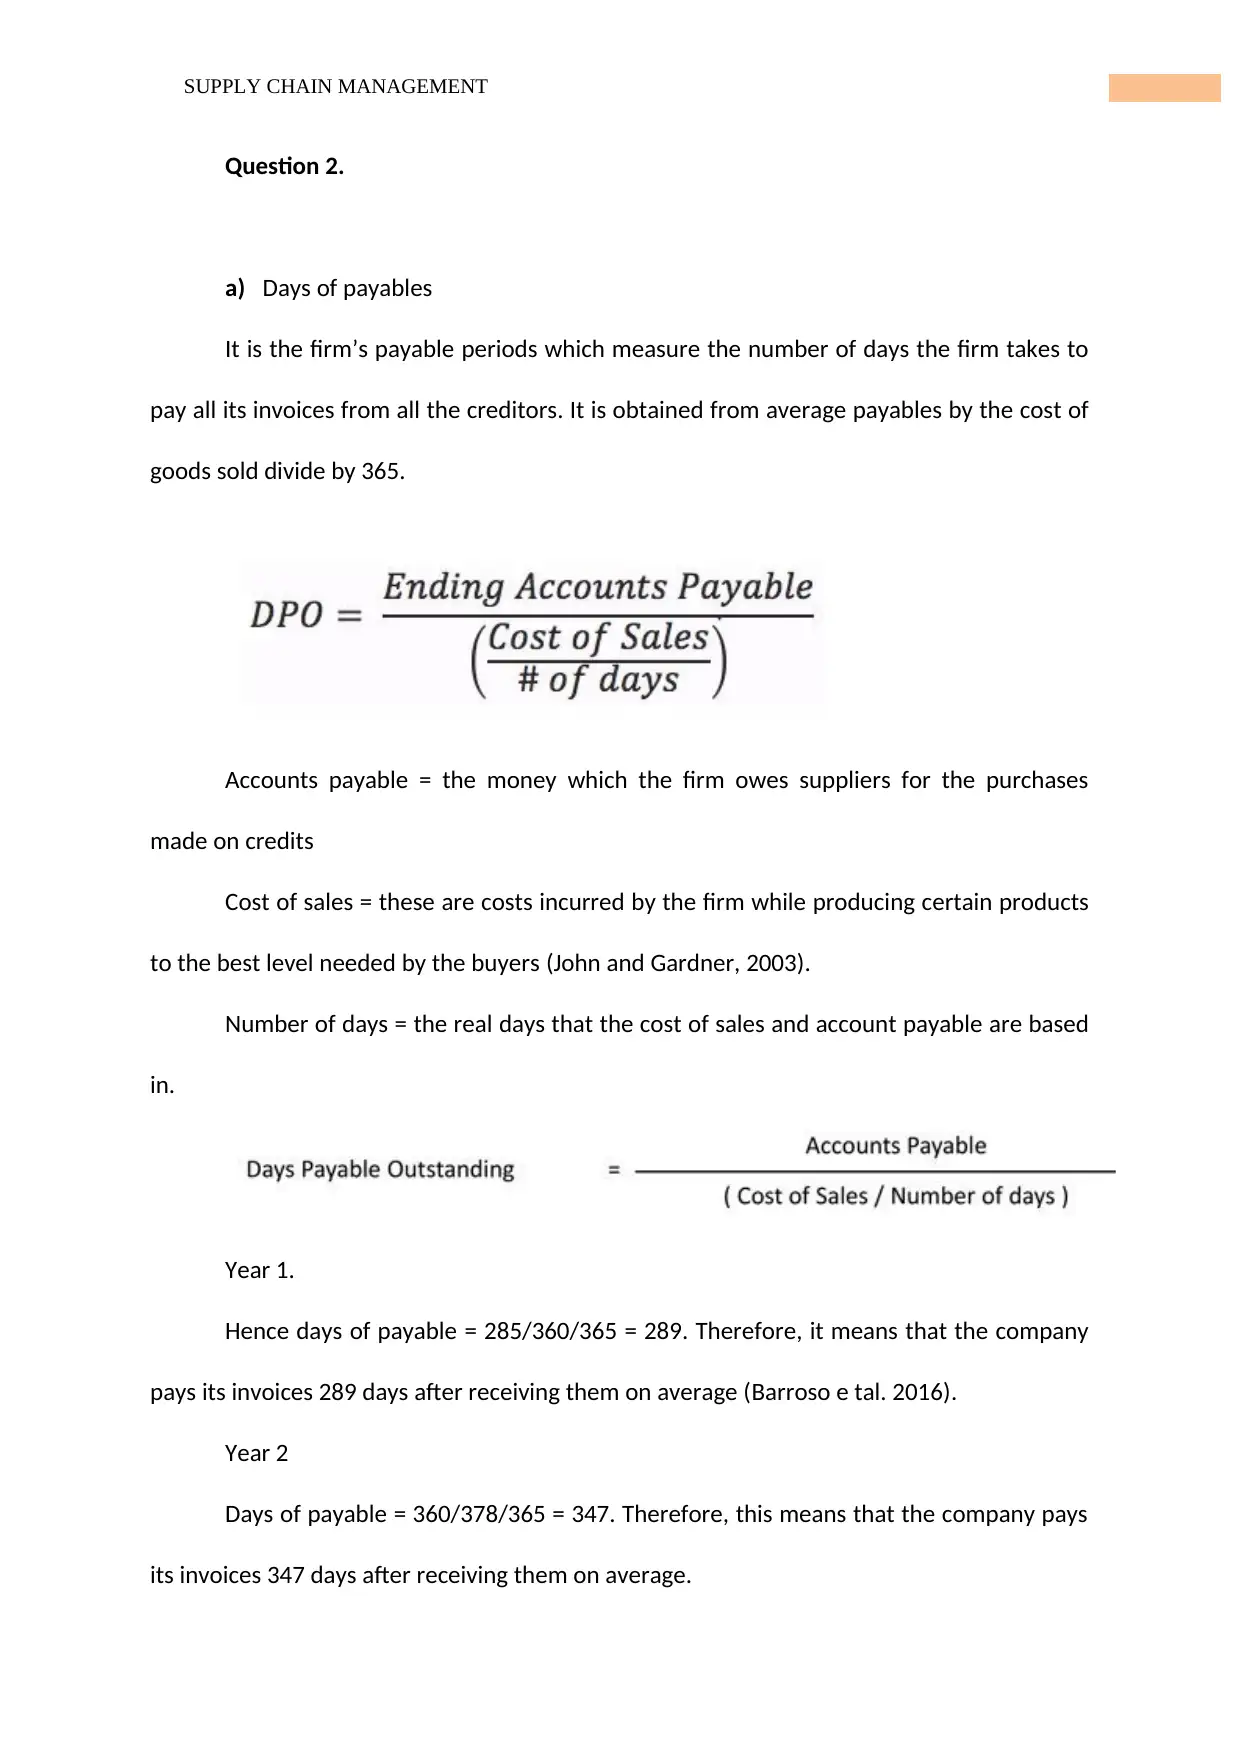
a) Days of payables
It is the firm’s payable periods which measure the number of days the firm takes to
pay all its invoices from all the creditors. It is obtained from average payables by the cost of
goods sold divide by 365.
Accounts payable = the money which the firm owes suppliers for the purchases
made on credits
Cost of sales = these are costs incurred by the firm while producing certain products
to the best level needed by the buyers (John and Gardner, 2003).
Number of days = the real days that the cost of sales and account payable are based
in.
Year 1.
Hence days of payable = 285/360/365 = 289. Therefore, it means that the company
pays its invoices 289 days after receiving them on average (Barroso e tal. 2016).
Year 2
Days of payable = 360/378/365 = 347. Therefore, this means that the company pays
its invoices 347 days after receiving them on average.
Question 2.
a) Days of payables
It is the firm’s payable periods which measure the number of days the firm takes to
pay all its invoices from all the creditors. It is obtained from average payables by the cost of
goods sold divide by 365.
Accounts payable = the money which the firm owes suppliers for the purchases
made on credits
Cost of sales = these are costs incurred by the firm while producing certain products
to the best level needed by the buyers (John and Gardner, 2003).
Number of days = the real days that the cost of sales and account payable are based
in.
Year 1.
Hence days of payable = 285/360/365 = 289. Therefore, it means that the company
pays its invoices 289 days after receiving them on average (Barroso e tal. 2016).
Year 2
Days of payable = 360/378/365 = 347. Therefore, this means that the company pays
its invoices 347 days after receiving them on average.
Paraphrase This Document
Need a fresh take? Get an instant paraphrase of this document with our AI Paraphraser
4SUPPLY CHAIN MANAGEMENT
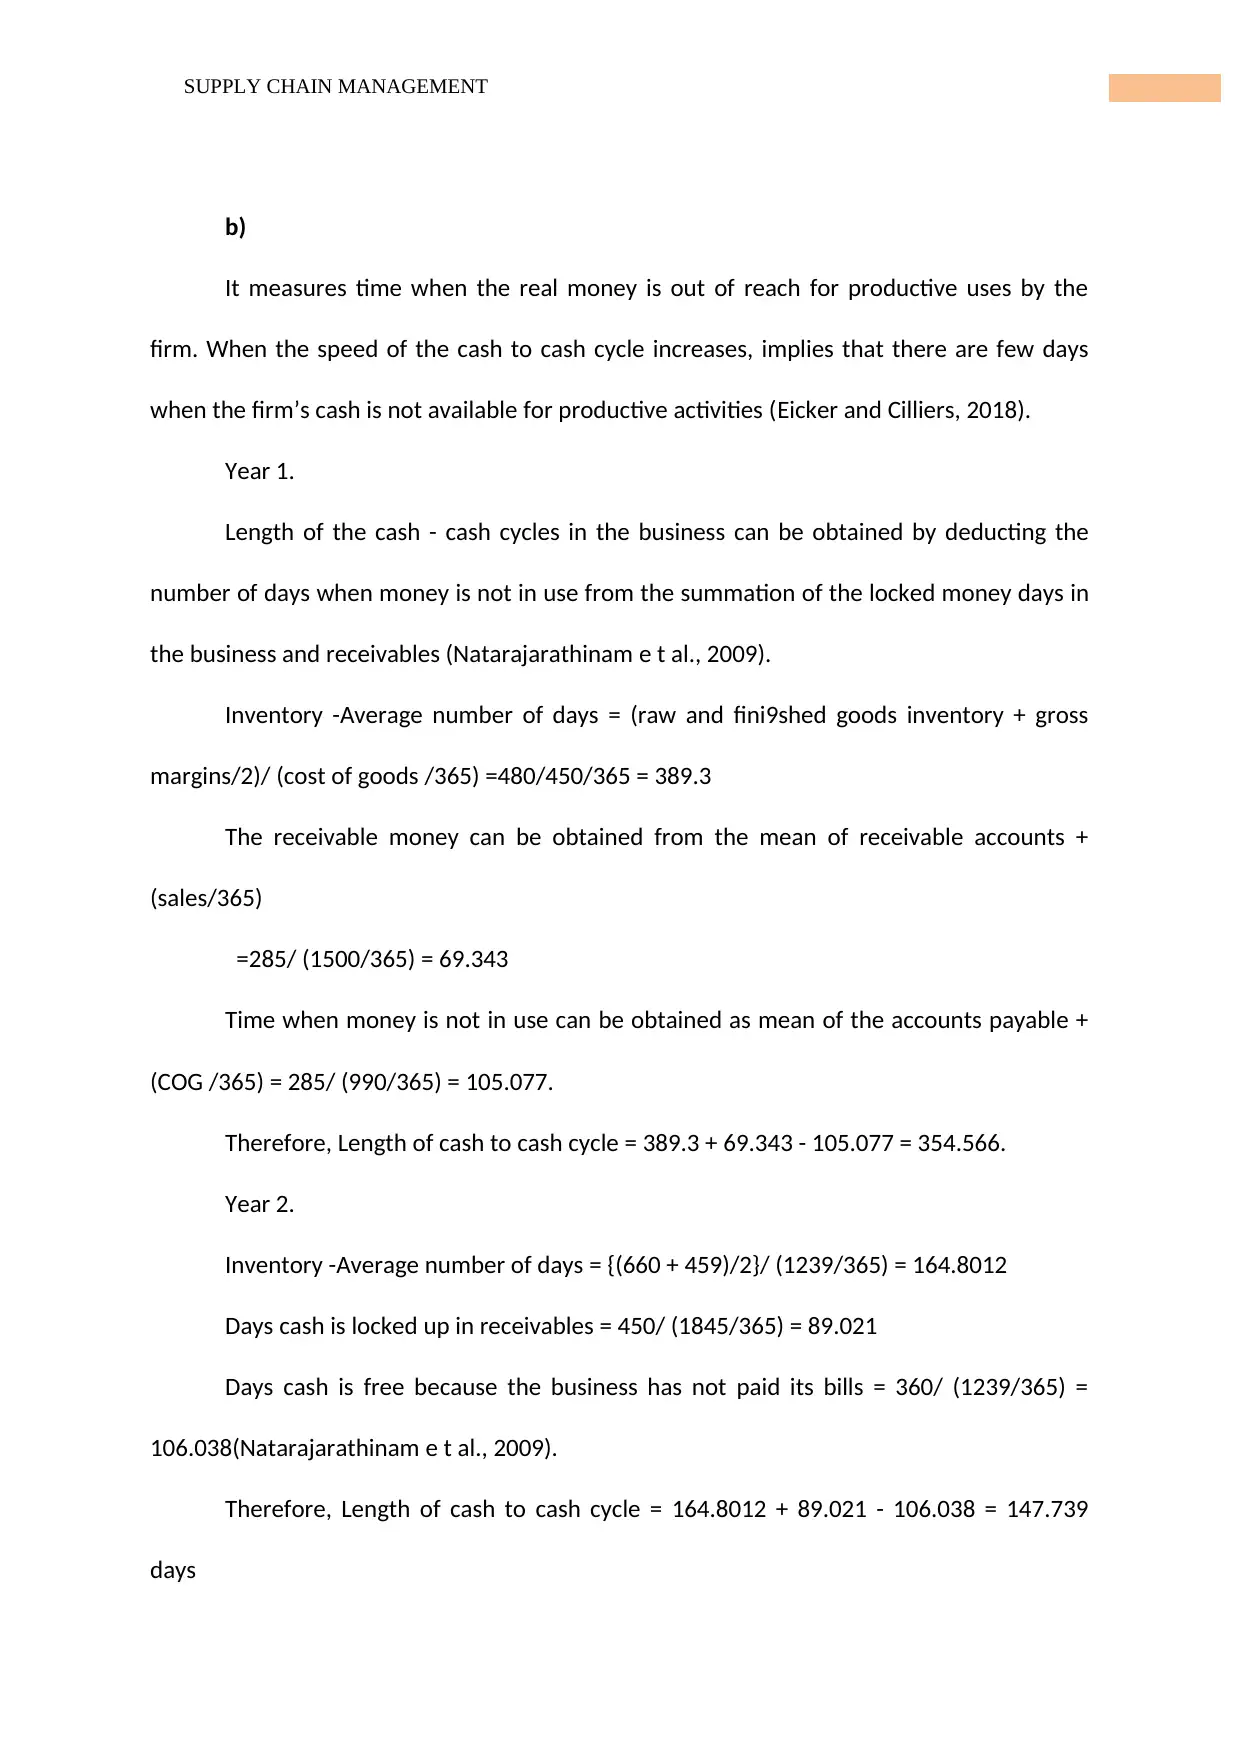
b)
It measures time when the real money is out of reach for productive uses by the
firm. When the speed of the cash to cash cycle increases, implies that there are few days
when the firm’s cash is not available for productive activities (Eicker and Cilliers, 2018).
Year 1.
Length of the cash - cash cycles in the business can be obtained by deducting the
number of days when money is not in use from the summation of the locked money days in
the business and receivables (Natarajarathinam e t al., 2009).
Inventory -Average number of days = (raw and fini9shed goods inventory + gross
margins/2)/ (cost of goods /365) =480/450/365 = 389.3
The receivable money can be obtained from the mean of receivable accounts +
(sales/365)
=285/ (1500/365) = 69.343
Time when money is not in use can be obtained as mean of the accounts payable +
(COG /365) = 285/ (990/365) = 105.077.
Therefore, Length of cash to cash cycle = 389.3 + 69.343 - 105.077 = 354.566.
Year 2.
Inventory -Average number of days = {(660 + 459)/2}/ (1239/365) = 164.8012
Days cash is locked up in receivables = 450/ (1845/365) = 89.021
Days cash is free because the business has not paid its bills = 360/ (1239/365) =
106.038(Natarajarathinam e t al., 2009).
Therefore, Length of cash to cash cycle = 164.8012 + 89.021 - 106.038 = 147.739
days
5SUPPLY CHAIN MANAGEMENT
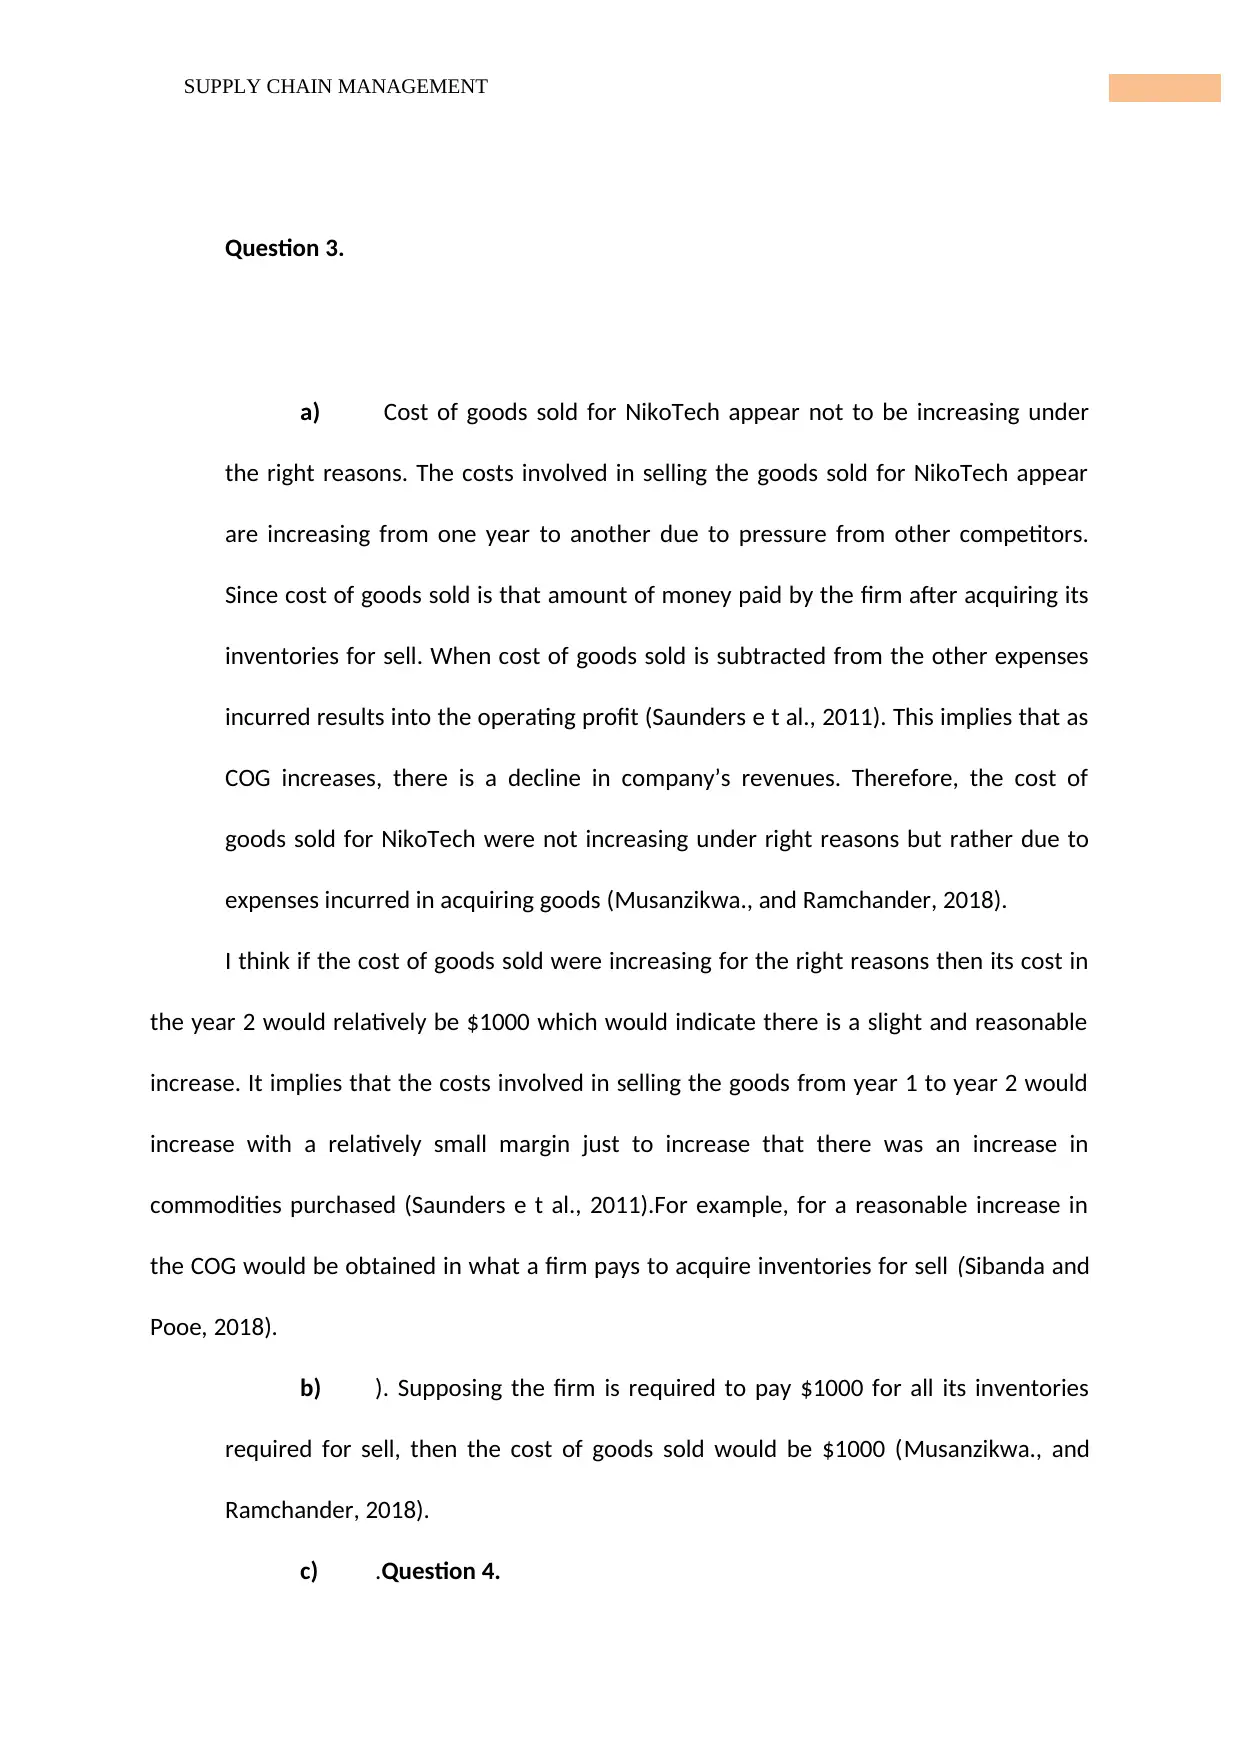
Question 3.
a) Cost of goods sold for NikoTech appear not to be increasing under
the right reasons. The costs involved in selling the goods sold for NikoTech appear
are increasing from one year to another due to pressure from other competitors.
Since cost of goods sold is that amount of money paid by the firm after acquiring its
inventories for sell. When cost of goods sold is subtracted from the other expenses
incurred results into the operating profit (Saunders e t al., 2011). This implies that as
COG increases, there is a decline in company’s revenues. Therefore, the cost of
goods sold for NikoTech were not increasing under right reasons but rather due to
expenses incurred in acquiring goods (Musanzikwa., and Ramchander, 2018).
I think if the cost of goods sold were increasing for the right reasons then its cost in
the year 2 would relatively be $1000 which would indicate there is a slight and reasonable
increase. It implies that the costs involved in selling the goods from year 1 to year 2 would
increase with a relatively small margin just to increase that there was an increase in
commodities purchased (Saunders e t al., 2011).For example, for a reasonable increase in
the COG would be obtained in what a firm pays to acquire inventories for sell (Sibanda and
Pooe, 2018).
b) ). Supposing the firm is required to pay $1000 for all its inventories
required for sell, then the cost of goods sold would be $1000 (Musanzikwa., and
Ramchander, 2018).
c) .Question 4.
⊘ This is a preview!⊘
Do you want full access?
Subscribe today to unlock all pages.
Trusted by 1+ million students worldwide
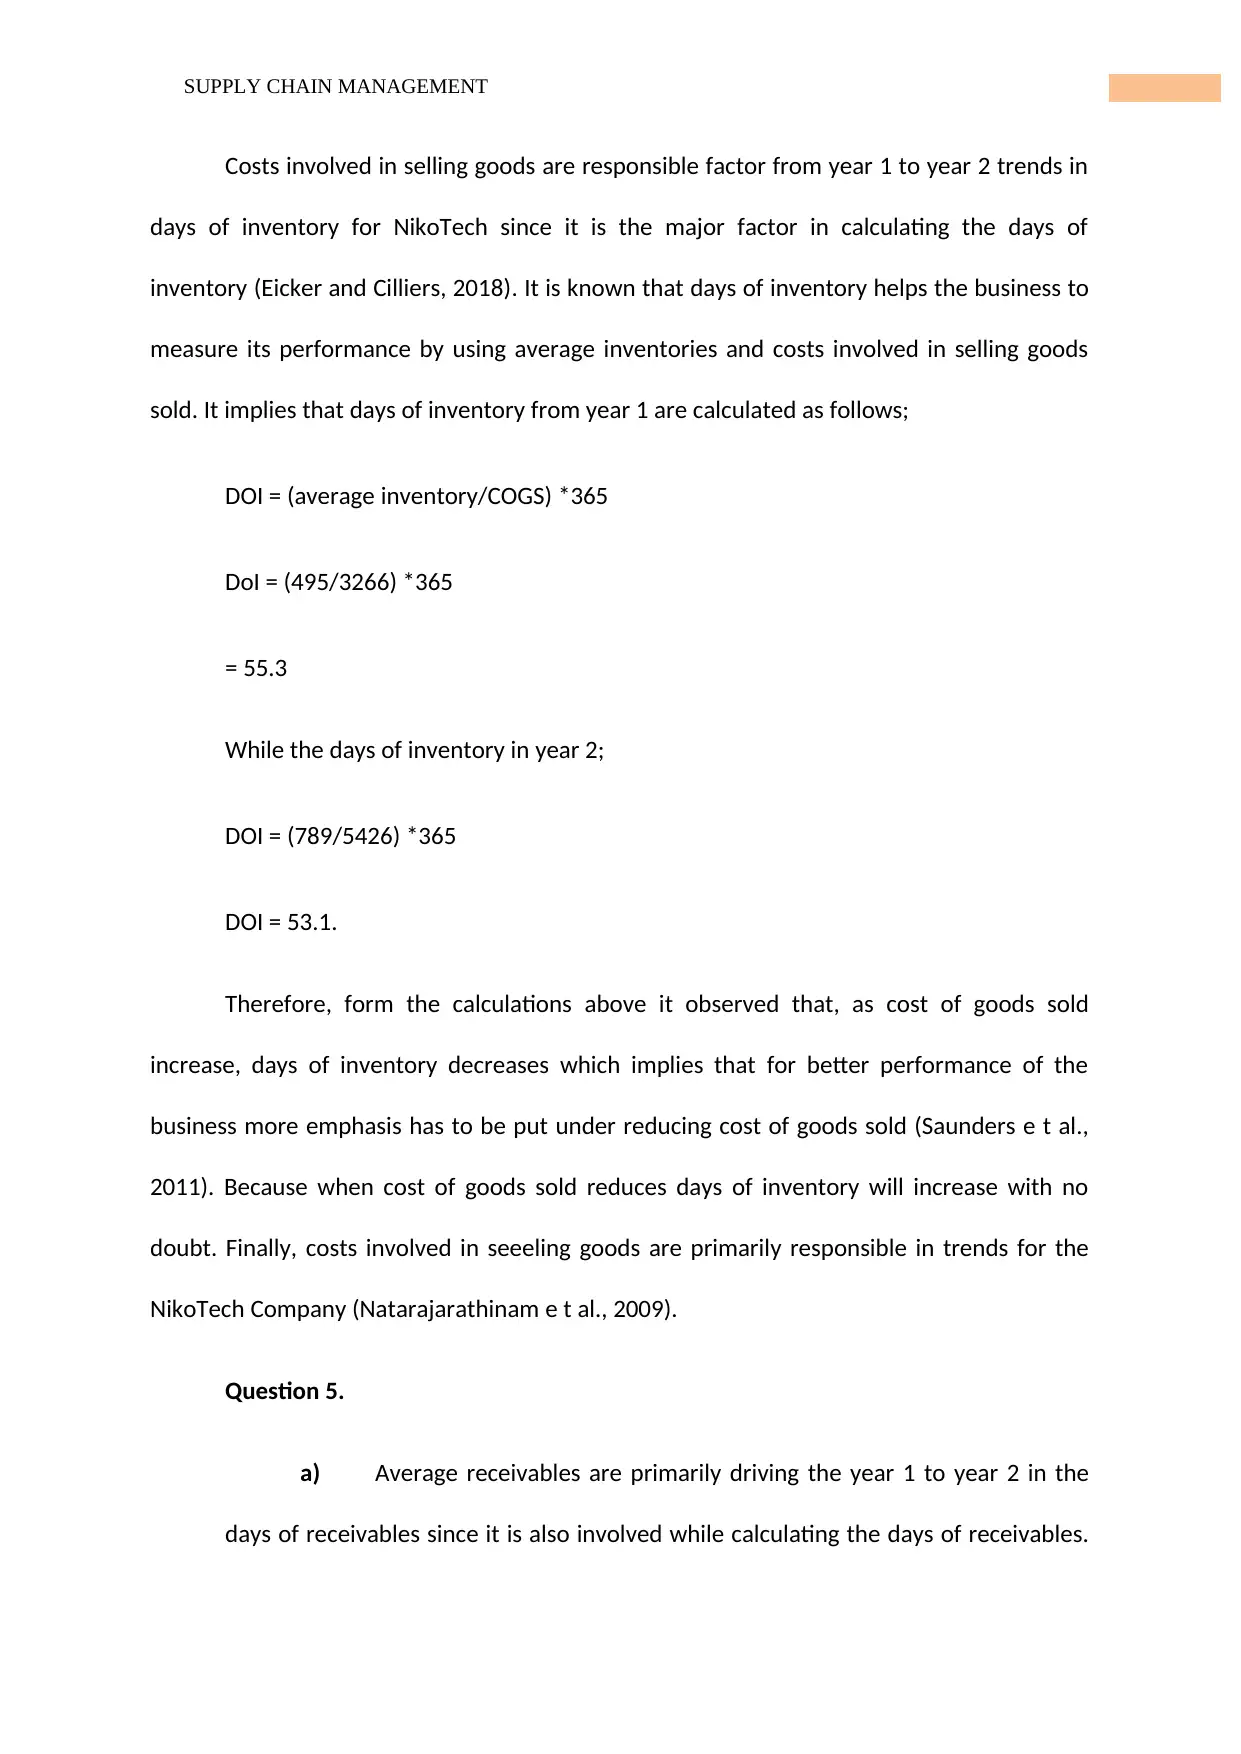
6SUPPLY CHAIN MANAGEMENT
Costs involved in selling goods are responsible factor from year 1 to year 2 trends in
days of inventory for NikoTech since it is the major factor in calculating the days of
inventory (Eicker and Cilliers, 2018). It is known that days of inventory helps the business to
measure its performance by using average inventories and costs involved in selling goods
sold. It implies that days of inventory from year 1 are calculated as follows;
DOI = (average inventory/COGS) *365
DoI = (495/3266) *365
= 55.3
While the days of inventory in year 2;
DOI = (789/5426) *365
DOI = 53.1.
Therefore, form the calculations above it observed that, as cost of goods sold
increase, days of inventory decreases which implies that for better performance of the
business more emphasis has to be put under reducing cost of goods sold (Saunders e t al.,
2011). Because when cost of goods sold reduces days of inventory will increase with no
doubt. Finally, costs involved in seeeling goods are primarily responsible in trends for the
NikoTech Company (Natarajarathinam e t al., 2009).
Question 5.
a) Average receivables are primarily driving the year 1 to year 2 in the
days of receivables since it is also involved while calculating the days of receivables.
Paraphrase This Document
Need a fresh take? Get an instant paraphrase of this document with our AI Paraphraser
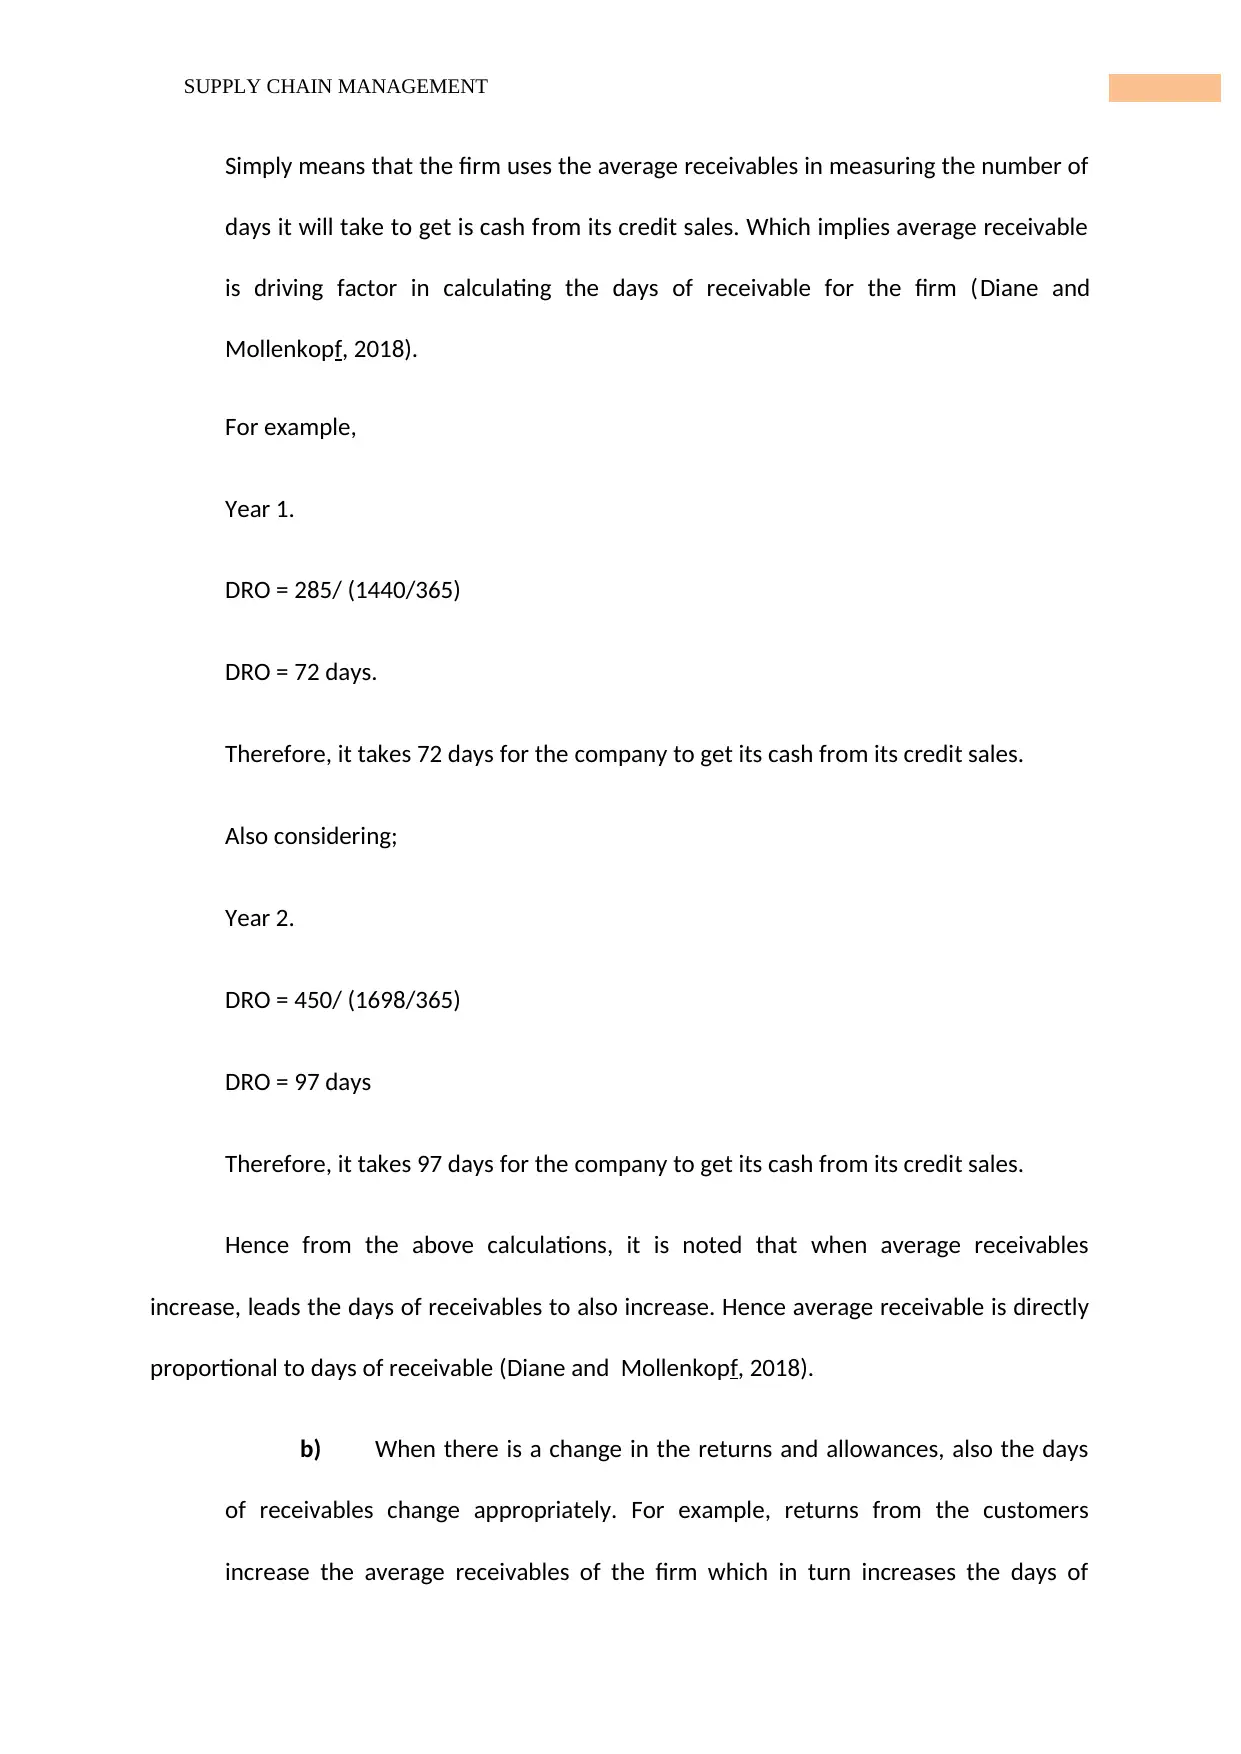
7SUPPLY CHAIN MANAGEMENT
Simply means that the firm uses the average receivables in measuring the number of
days it will take to get is cash from its credit sales. Which implies average receivable
is driving factor in calculating the days of receivable for the firm (Diane and
Mollenkopf, 2018).
For example,
Year 1.
DRO = 285/ (1440/365)
DRO = 72 days.
Therefore, it takes 72 days for the company to get its cash from its credit sales.
Also considering;
Year 2.
DRO = 450/ (1698/365)
DRO = 97 days
Therefore, it takes 97 days for the company to get its cash from its credit sales.
Hence from the above calculations, it is noted that when average receivables
increase, leads the days of receivables to also increase. Hence average receivable is directly
proportional to days of receivable (Diane and Mollenkopf, 2018).
b) When there is a change in the returns and allowances, also the days
of receivables change appropriately. For example, returns from the customers
increase the average receivables of the firm which in turn increases the days of
8SUPPLY CHAIN MANAGEMENT
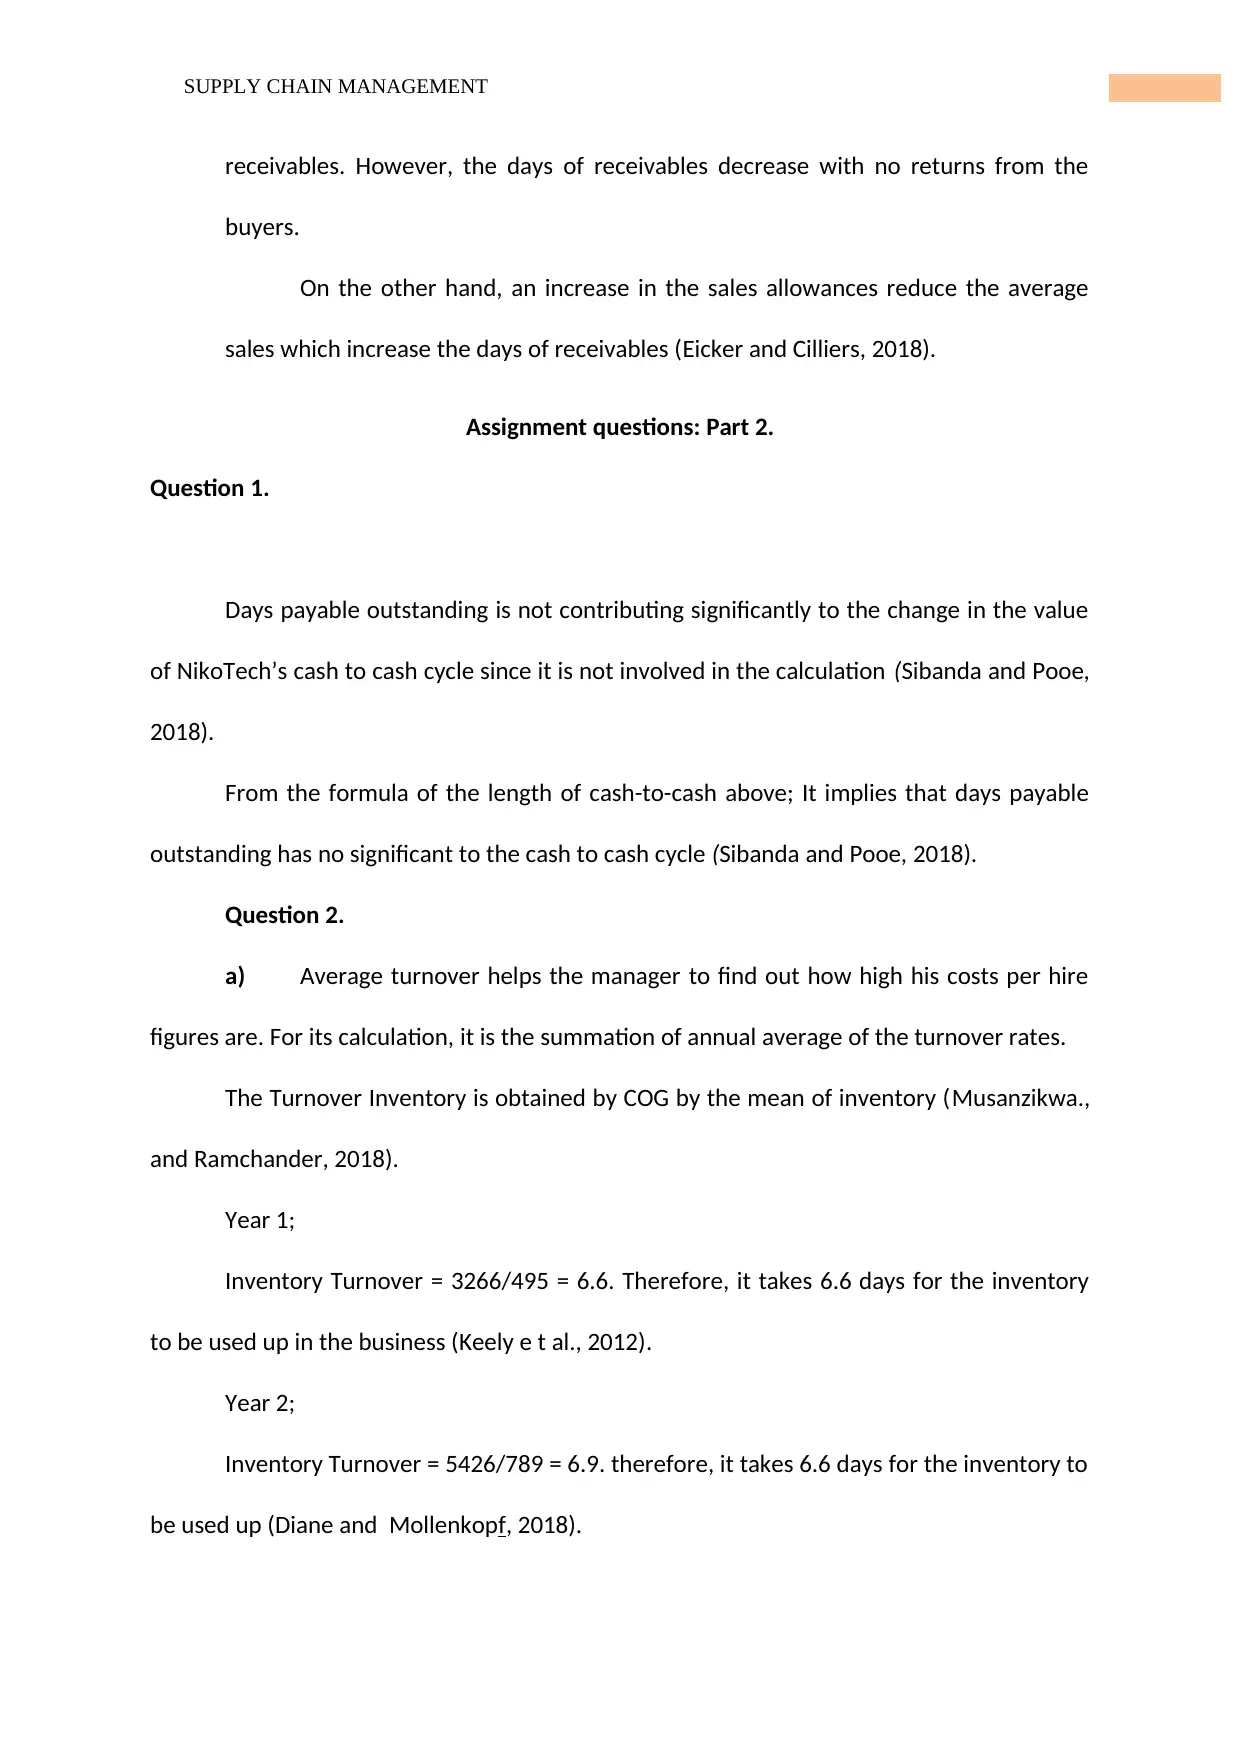
receivables. However, the days of receivables decrease with no returns from the
buyers.
On the other hand, an increase in the sales allowances reduce the average
sales which increase the days of receivables (Eicker and Cilliers, 2018).
Assignment questions: Part 2.
Question 1.
Days payable outstanding is not contributing significantly to the change in the value
of NikoTech’s cash to cash cycle since it is not involved in the calculation (Sibanda and Pooe,
2018).
From the formula of the length of cash-to-cash above; It implies that days payable
outstanding has no significant to the cash to cash cycle (Sibanda and Pooe, 2018).
Question 2.
a) Average turnover helps the manager to find out how high his costs per hire
figures are. For its calculation, it is the summation of annual average of the turnover rates.
The Turnover Inventory is obtained by COG by the mean of inventory (Musanzikwa.,
and Ramchander, 2018).
Year 1;
Inventory Turnover = 3266/495 = 6.6. Therefore, it takes 6.6 days for the inventory
to be used up in the business (Keely e t al., 2012).
Year 2;
Inventory Turnover = 5426/789 = 6.9. therefore, it takes 6.6 days for the inventory to
be used up (Diane and Mollenkopf, 2018).
⊘ This is a preview!⊘
Do you want full access?
Subscribe today to unlock all pages.
Trusted by 1+ million students worldwide
9SUPPLY CHAIN MANAGEMENT
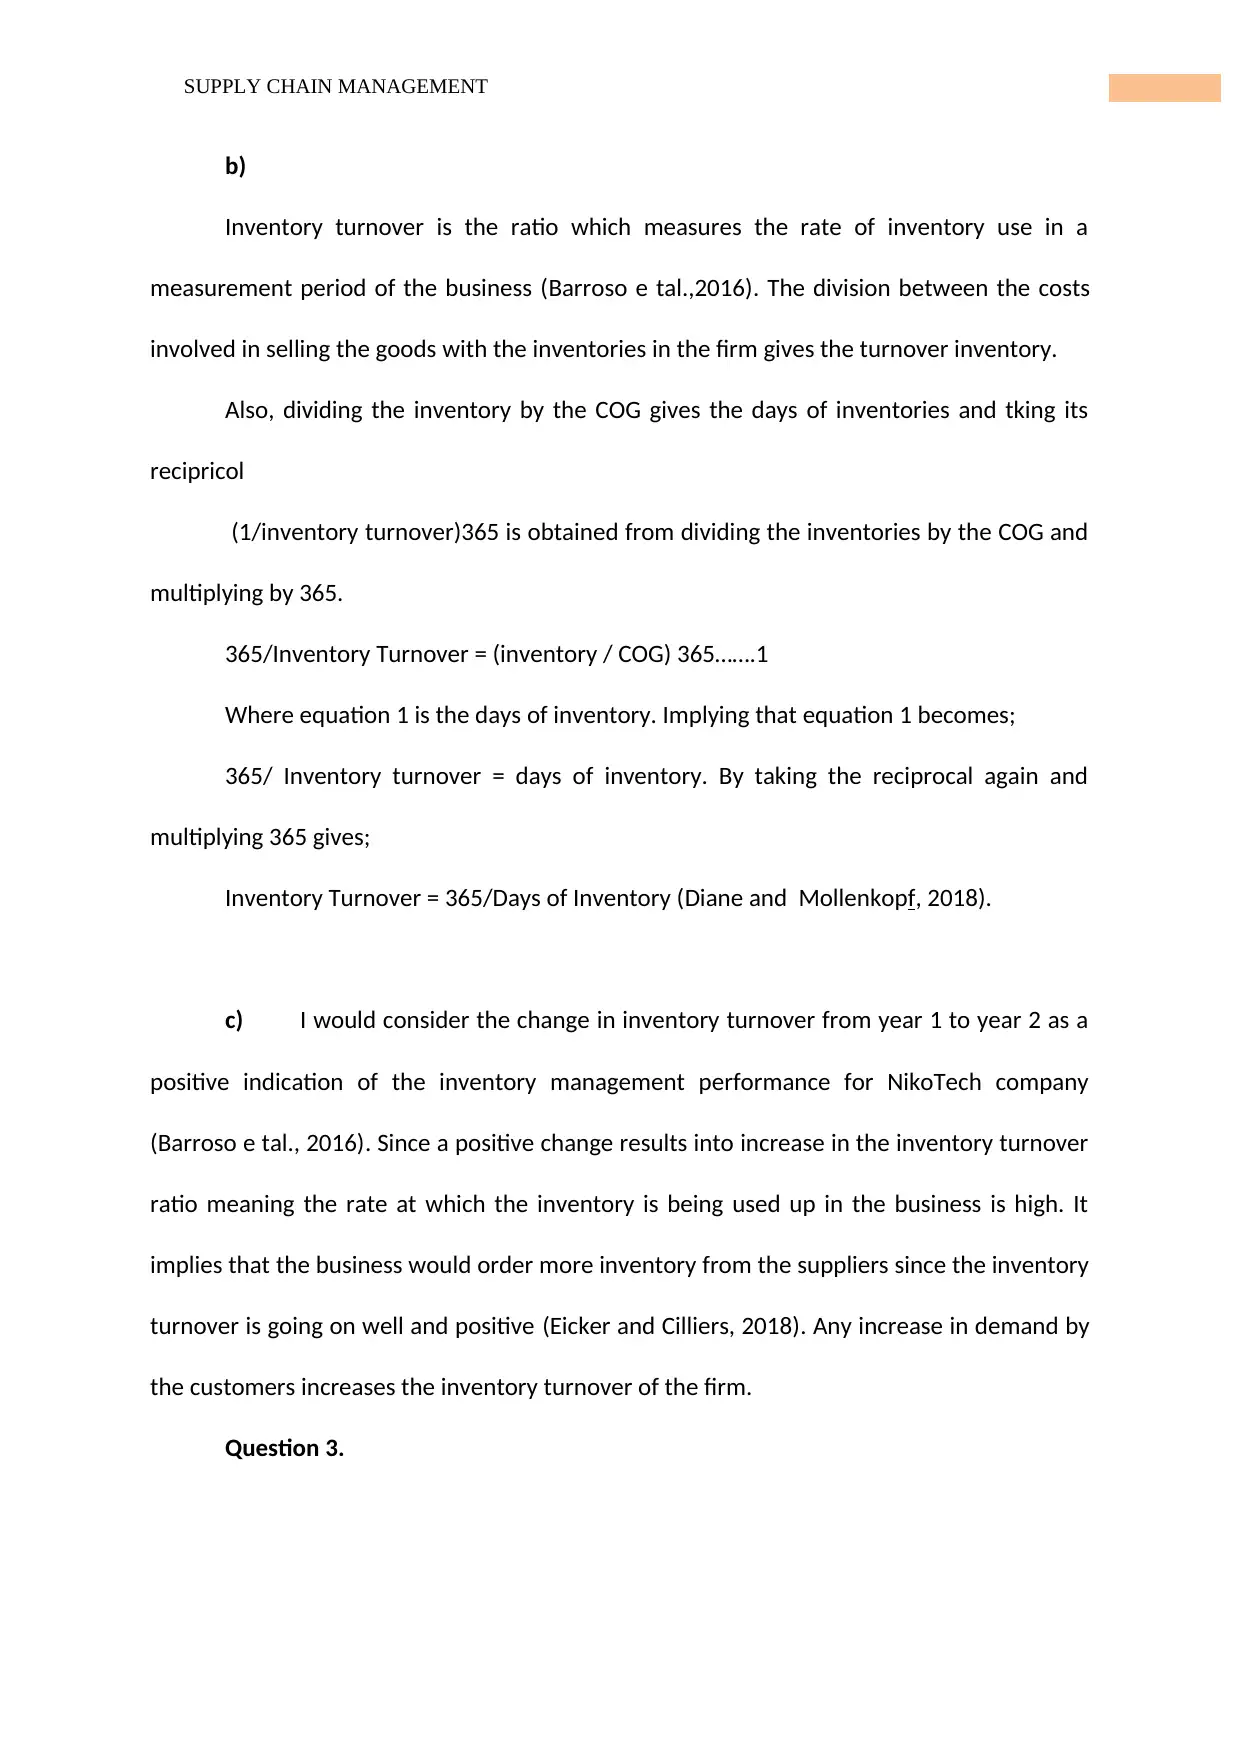
b)
Inventory turnover is the ratio which measures the rate of inventory use in a
measurement period of the business (Barroso e tal.,2016). The division between the costs
involved in selling the goods with the inventories in the firm gives the turnover inventory.
Also, dividing the inventory by the COG gives the days of inventories and tking its
recipricol
(1/inventory turnover)365 is obtained from dividing the inventories by the COG and
multiplying by 365.
365/Inventory Turnover = (inventory / COG) 365…….1
Where equation 1 is the days of inventory. Implying that equation 1 becomes;
365/ Inventory turnover = days of inventory. By taking the reciprocal again and
multiplying 365 gives;
Inventory Turnover = 365/Days of Inventory (Diane and Mollenkopf, 2018).
c) I would consider the change in inventory turnover from year 1 to year 2 as a
positive indication of the inventory management performance for NikoTech company
(Barroso e tal., 2016). Since a positive change results into increase in the inventory turnover
ratio meaning the rate at which the inventory is being used up in the business is high. It
implies that the business would order more inventory from the suppliers since the inventory
turnover is going on well and positive (Eicker and Cilliers, 2018). Any increase in demand by
the customers increases the inventory turnover of the firm.
Question 3.
Paraphrase This Document
Need a fresh take? Get an instant paraphrase of this document with our AI Paraphraser
10SUPPLY CHAIN MANAGEMENT
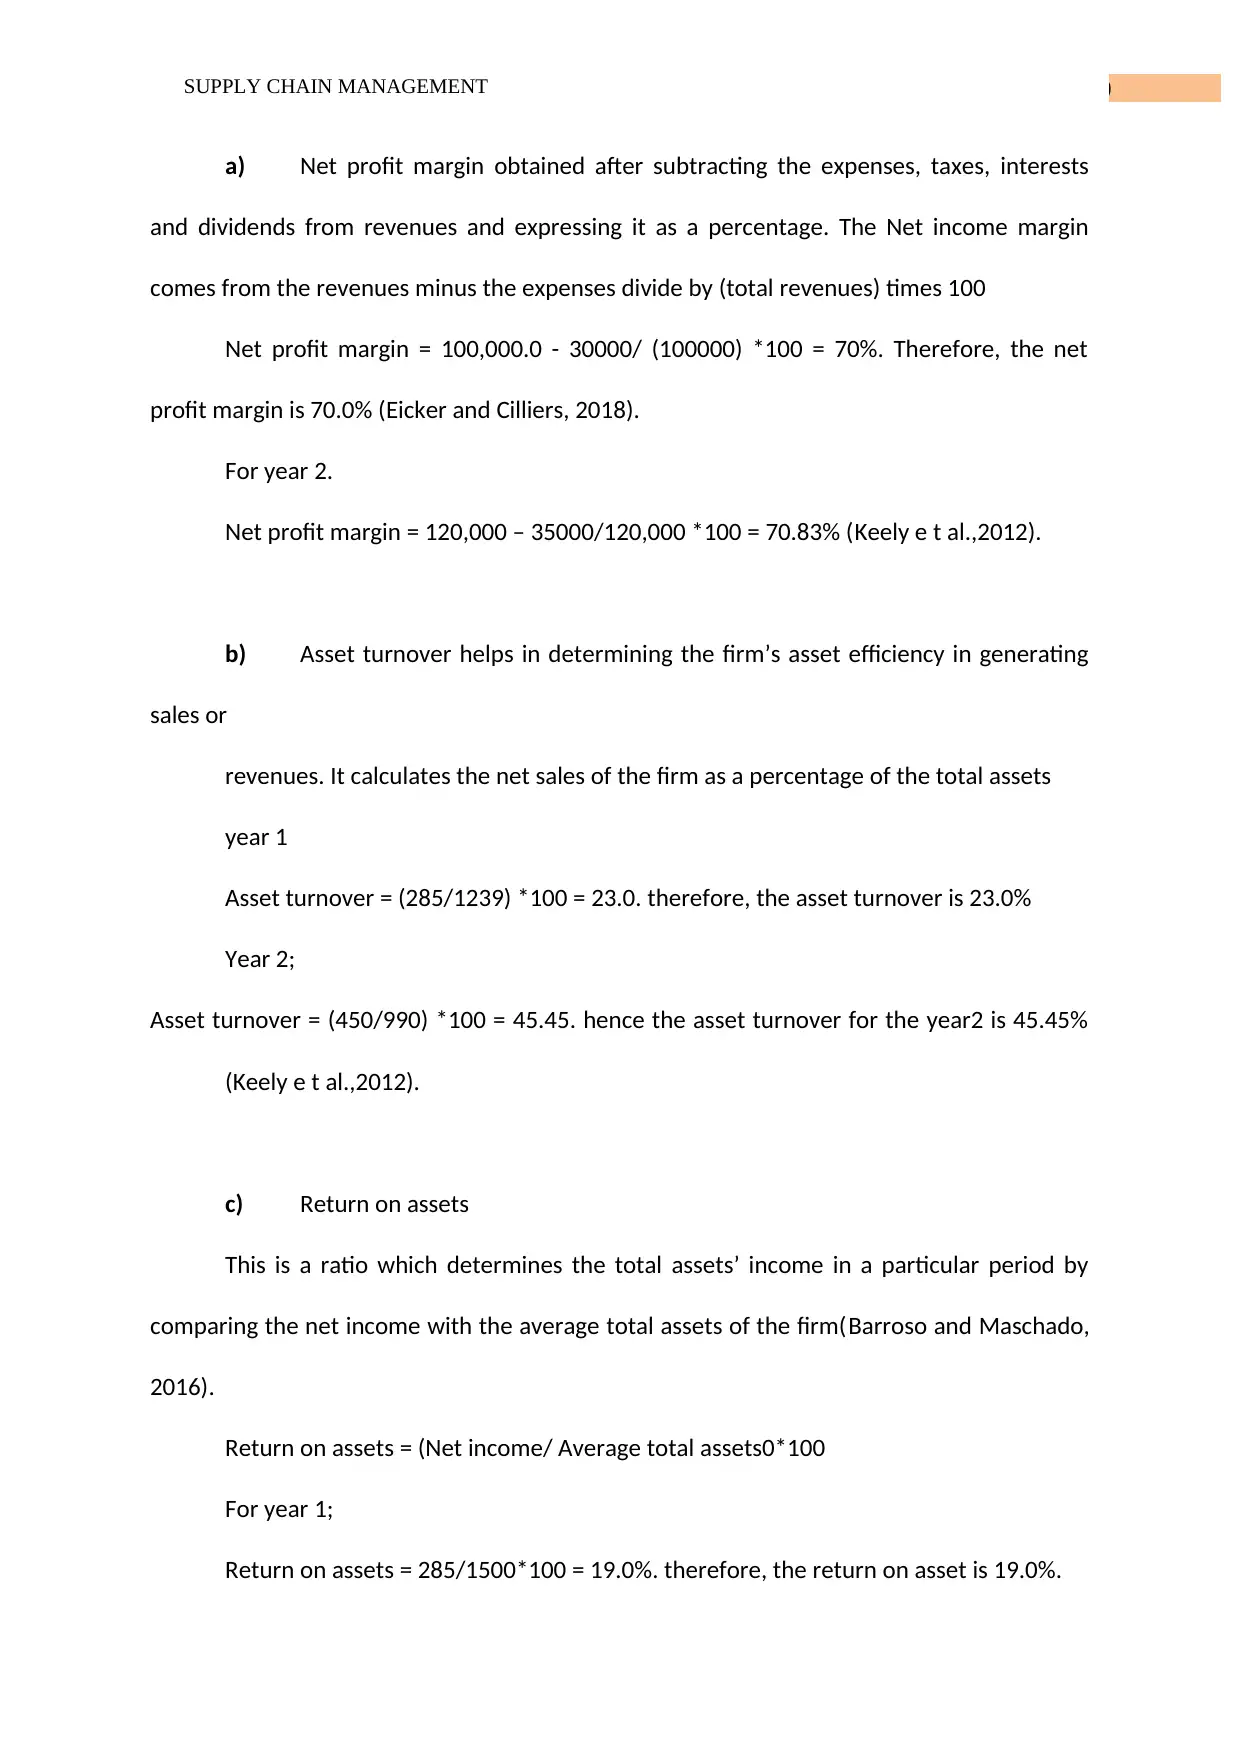
a) Net profit margin obtained after subtracting the expenses, taxes, interests
and dividends from revenues and expressing it as a percentage. The Net income margin
comes from the revenues minus the expenses divide by (total revenues) times 100
Net profit margin = 100,000.0 - 30000/ (100000) *100 = 70%. Therefore, the net
profit margin is 70.0% (Eicker and Cilliers, 2018).
For year 2.
Net profit margin = 120,000 – 35000/120,000 *100 = 70.83% (Keely e t al.,2012).
b) Asset turnover helps in determining the firm’s asset efficiency in generating
sales or
revenues. It calculates the net sales of the firm as a percentage of the total assets
year 1
Asset turnover = (285/1239) *100 = 23.0. therefore, the asset turnover is 23.0%
Year 2;
Asset turnover = (450/990) *100 = 45.45. hence the asset turnover for the year2 is 45.45%
(Keely e t al.,2012).
c) Return on assets
This is a ratio which determines the total assets’ income in a particular period by
comparing the net income with the average total assets of the firm(Barroso and Maschado,
2016).
Return on assets = (Net income/ Average total assets0*100
For year 1;
Return on assets = 285/1500*100 = 19.0%. therefore, the return on asset is 19.0%.
11SUPPLY CHAIN MANAGEMENT
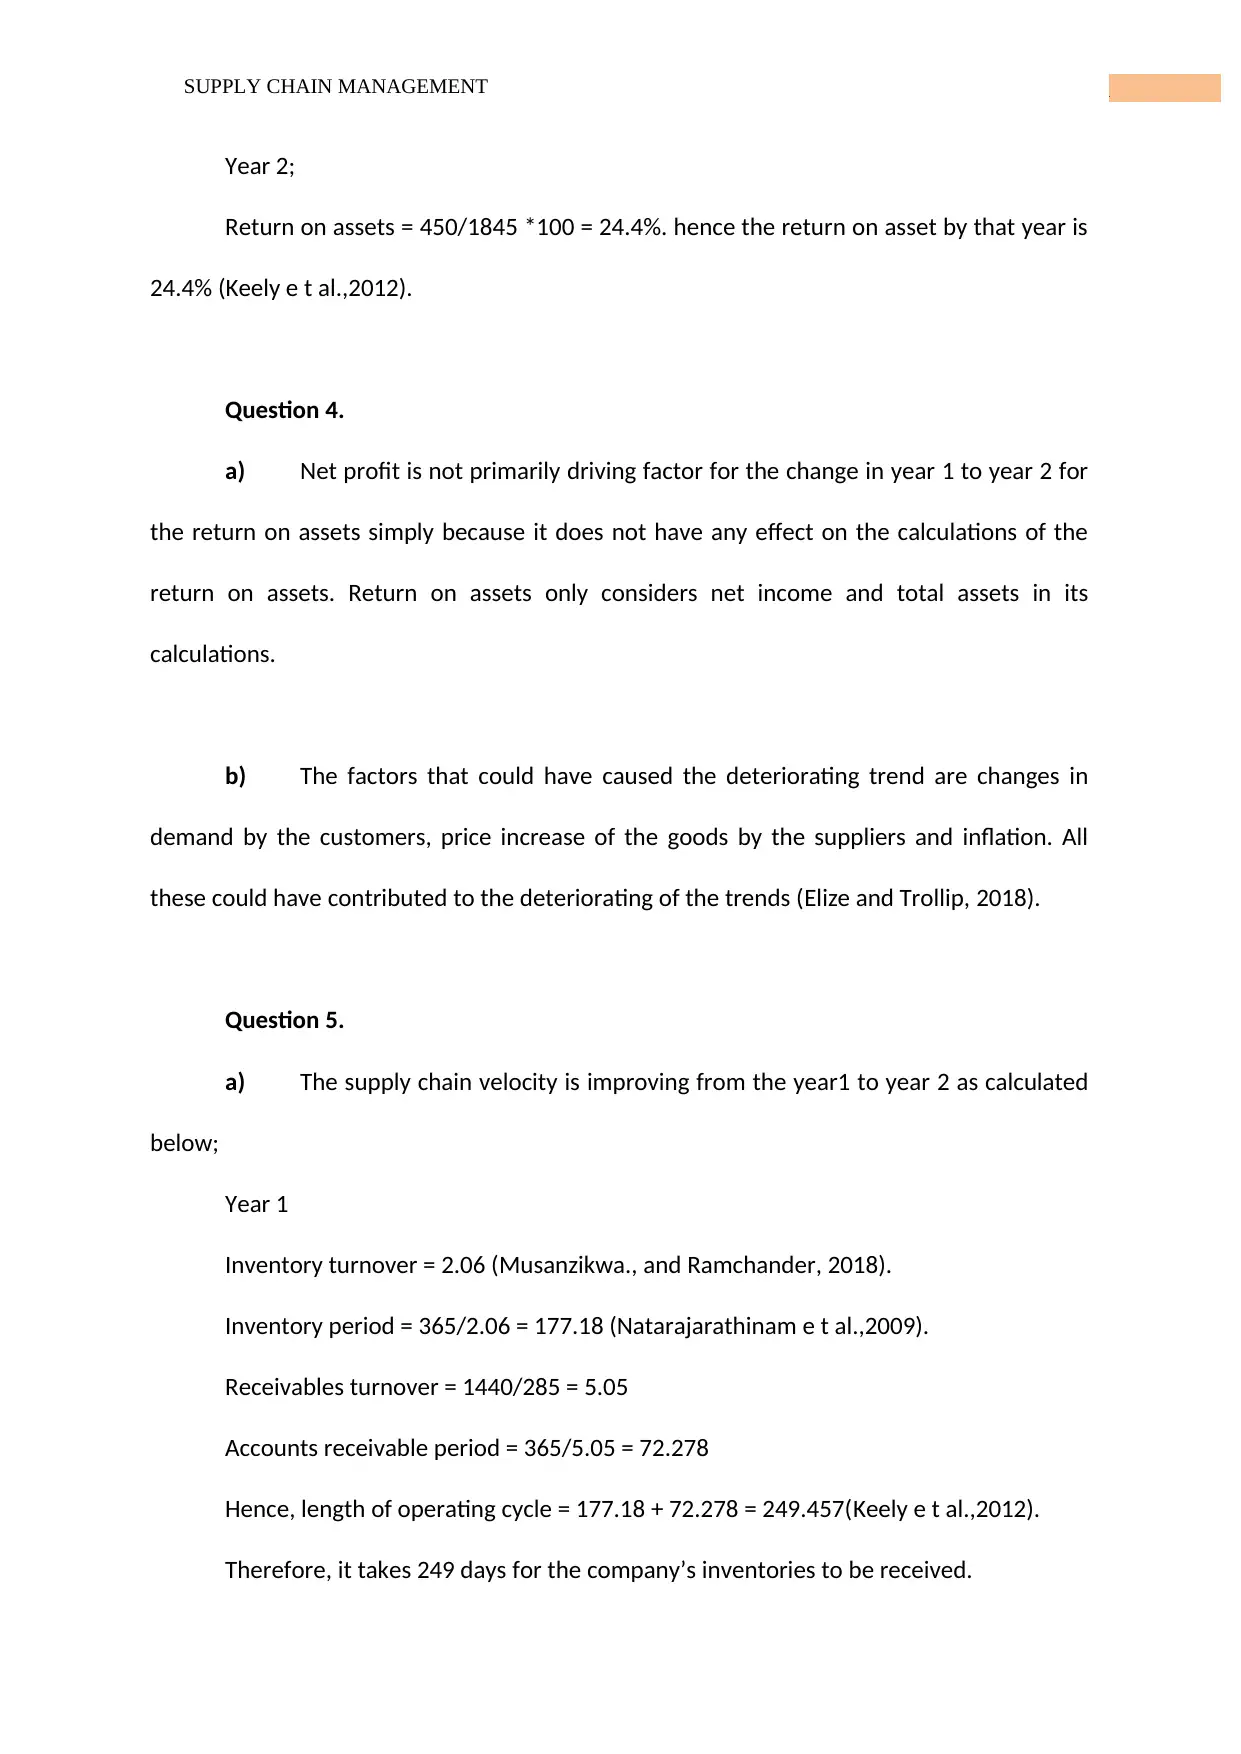
Year 2;
Return on assets = 450/1845 *100 = 24.4%. hence the return on asset by that year is
24.4% (Keely e t al.,2012).
Question 4.
a) Net profit is not primarily driving factor for the change in year 1 to year 2 for
the return on assets simply because it does not have any effect on the calculations of the
return on assets. Return on assets only considers net income and total assets in its
calculations.
b) The factors that could have caused the deteriorating trend are changes in
demand by the customers, price increase of the goods by the suppliers and inflation. All
these could have contributed to the deteriorating of the trends (Elize and Trollip, 2018).
Question 5.
a) The supply chain velocity is improving from the year1 to year 2 as calculated
below;
Year 1
Inventory turnover = 2.06 (Musanzikwa., and Ramchander, 2018).
Inventory period = 365/2.06 = 177.18 (Natarajarathinam e t al.,2009).
Receivables turnover = 1440/285 = 5.05
Accounts receivable period = 365/5.05 = 72.278
Hence, length of operating cycle = 177.18 + 72.278 = 249.457(Keely e t al.,2012).
Therefore, it takes 249 days for the company’s inventories to be received.
⊘ This is a preview!⊘
Do you want full access?
Subscribe today to unlock all pages.
Trusted by 1+ million students worldwide
1 out of 16

Your All-in-One AI-Powered Toolkit for Academic Success.
+13062052269
info@desklib.com
Available 24*7 on WhatsApp / Email
![[object Object]](/_next/static/media/star-bottom.7253800d.svg)
Unlock your academic potential
Copyright © 2020–2025 A2Z Services. All Rights Reserved. Developed and managed by ZUCOL.