7108IBA Supply Chain Modelling: Optimizing Dronautics Ltd.
VerifiedAdded on 2023/03/21
|18
|4342
|26
Report
AI Summary
This report focuses on designing an efficient supply chain model for Dronautics Ltd, a drone manufacturing firm with three sites in Australia, which is experiencing increased demand and rising transport costs. The analysis involves selecting optimal production sites (Cairns, Darwin, or Mandurah) and determining the most cost-effective transportation methods to distribution centers in Adelaide or Newcastle, considering both unit and pallet shipments. The model prioritizes minimizing production and transport costs, recommending Darwin as the sole production center, with pallet shipments to Adelaide and Newcastle. Further analysis optimizes market distribution from the distribution centers to various markets, favoring pallet shipments and assigning markets to either Adelaide or Newcastle based on cost efficiency. The report also discusses the rationality of the distribution center policy and explores the potential benefits and drawbacks of breaking down pallets and relocating production sites to distribution centers, concluding with a cost-benefit analysis of these strategic decisions.
Running Head: SUPPLY CHAIN MODELLING
1
SUPPLY CHAIN MODELLING
Name of Student:
Name of Institution:
Date:
1
SUPPLY CHAIN MODELLING
Name of Student:
Name of Institution:
Date:
Paraphrase This Document
Need a fresh take? Get an instant paraphrase of this document with our AI Paraphraser
SUPPLY CHAIN MODELLING
2
Introduction
Modelling of the most efficient supply chain is a very vital part of developing and
validating the entire supply chain as well as the distribution network of an organization. By
definition supply chain is a web of individuals, resources, organisations, technology and
activities that are involved with the product creation and sales (Bottani, et al., 2015). This line
stretches from the delivery of raw materials to the organizations production sites to the supply of
the finished goods to the consumers (Bilgen, Bilge, & Yelda, 2013). Management of the supply
chain therefore involved an oversight of information, materials and the finances as they move
across the network from the supplier of raw materials to the consumer of the finished goods. The
three major flows under the supply chain is the information flow, product flow and finance flow.
The focus of the supply chain is therefore the coordination of this flows within and among
outside firms dealing with the organization (Acar, et al., 2010).
The trading that normally do take place within a supply chain is composed of several firm
each trying to optimize its profits with little knowledge or interest in the other players. To enable
fair competition and ethical considerations firms have come up with codes of conduct that assist
guide transactions within parties. These ethical boundaries have made corporations to make
demands from their suppliers to comply with social needs (Alzaman & Chaher, 2014). Lack of
transparency in the supply chain defined as mystification bars consumers from gaining
significant knowledge of product generation line and can allow socially irresponsible practices in
the supply chain (Charkha, Pranav, Jaju, & Santosh, 2014).
In this report the focus is to design a supply chain for Dronautics Ltd. This is a drone
manufacturing firm that undertakes its activities in three manufacturing sites across Australia. In
SUPPLY CHAIN MODELLING
3
the recent period the firm has experienced a rampant growth in the demand for its products
(Clodia, Angeloantonio, & Francesco, 2009). Even though their production capacity was flexible
enough and have managed to meet the new demands, the problem the firm is facing is the
increased transport cost. Initially drones were transported as single units but due to the
emergence of a new cheaper method that is transporting the drones as pallets consisting of 240
units, the management of Dronautics is reconsidering the supply chain network. Will therefore
model the most cost-effective supply chain and make recommendations that can assist the
Dronautics management minimize its operational cost (Gabriela & Jorge, 2011).
1. Selection of the optimal production sites
The first step towards cost minimisation will be to decide on the number of drones that ought
to be produced at each of the manufacturing sites. In making this decision consideration has to be
taken to minimize the cost of production as well as the transport expenses (Hamila, Jukka, Vilko,
& Jyri, 2015). Currently the policy of the firm is to generate the goods at the various
manufacturing sites then transport them to the distribution centres prior to distributing the goods
to the final markets. The firm currently have an option of producing the drones in either Cairns,
Darwin or Mandurah. After the production is complete the goods are supposed to be transported
to either Adelaide or Newcastle as singe units or pallets (Gonzalo & Ignacio, 2010).
The model defined below is meant to obtain the most cost-efficient manufacturing site and
the means of transport that minimizes the cost of moving the products to the distribution centres.
⊘ This is a preview!⊘
Do you want full access?
Subscribe today to unlock all pages.
Trusted by 1+ million students worldwide
SUPPLY CHAIN MODELLING
4
Cost of transport from the manufacturing point to the
distribution centre
4
Cost of transport from the manufacturing point to the
distribution centre
Paraphrase This Document
Need a fresh take? Get an instant paraphrase of this document with our AI Paraphraser
SUPPLY CHAIN MODELLING
5
Per Pallet ($) Per Unit
($)
Adelaide Newcastle Adelaide Newcastle
Cairns $790 $660 $6 $5
Darwin $530 $920 $4 $7
Mandurah $790 $1,190 $6 $9
Units moved to each distribution
centre
Per Pallet ($) Per Unit
($)
Adelaide Newcastle Adelaide Newcas
tle
Total units
produced
Cairns 0 0 0 0 0
Darwin 368 406 0 0 185870
Mandurah 0 0 0 0 0
Total 368 406 0 0
Equals Equals Equals Equals
Total Market supply 368 406 0 0
Total cost of supply to the
distribution centre
$568,819.1
7
Cost of production per unit
Plant cost
Cairns 43
Darwin 40
Mandurah 42
Total production cost $7,434,800
.00
Objective function
SUPPLY CHAIN MODELLING
6
Production and transport to the distribution
centres
$8,003,619
.17
Constraints
Quantity Supplied to each
distribution point
Equals Total quantity from the point to the
market
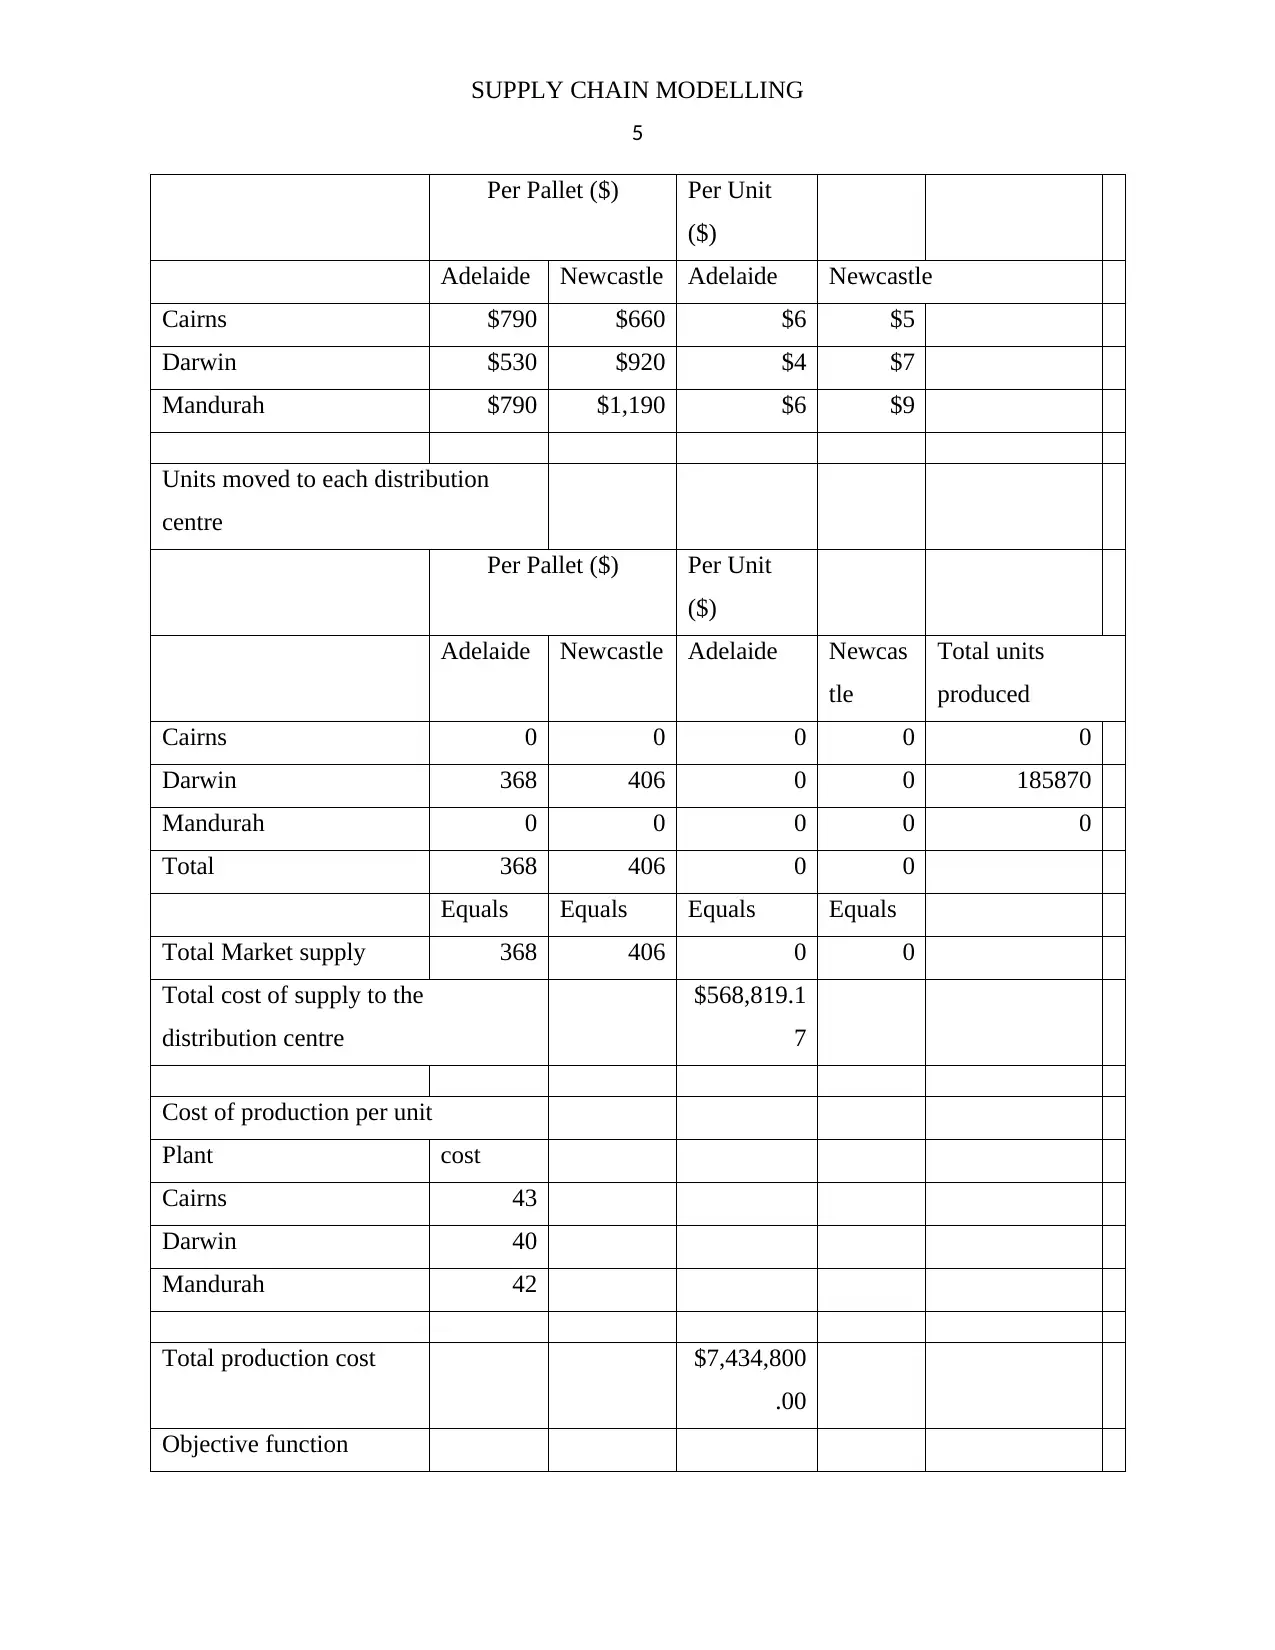
From the model displayed above, it’s evident that the production cost is the major
component of the overall operation cost. Minimising this cost is thus the top priority for the firm.
From the model output the firm should only manufacture the drones at the Darwin centre. This
will mean incurring the minimal production cost of $ 7,434,800. After the completion of the
manufacturing process the goods should be transferred to either the Adelaide or the Newcastle
distribution centre in pallet packs (Niu, et al., 2013). In total 368 pallets need to be transferred
from Darwin to Adelaide while another 406 pallets be transported to Newcastle. From the
distribution points the goods will be efficient to supply the entire market (Motawa, Ibrahim,
Kaka, & Ammar, 2009).
The table below summarises the production and movement of goods to the distribution centres.
Units moved to each distribution centre
Per Pallet ($)
Adelaide Newcastle
Cairns 0 0
Darwin 368 406
Mandurah 0 0
Total 368 406
2. Market distribution network
6
Production and transport to the distribution
centres
$8,003,619
.17
Constraints
Quantity Supplied to each
distribution point
Equals Total quantity from the point to the
market
From the model displayed above, it’s evident that the production cost is the major
component of the overall operation cost. Minimising this cost is thus the top priority for the firm.
From the model output the firm should only manufacture the drones at the Darwin centre. This
will mean incurring the minimal production cost of $ 7,434,800. After the completion of the
manufacturing process the goods should be transferred to either the Adelaide or the Newcastle
distribution centre in pallet packs (Niu, et al., 2013). In total 368 pallets need to be transferred
from Darwin to Adelaide while another 406 pallets be transported to Newcastle. From the
distribution points the goods will be efficient to supply the entire market (Motawa, Ibrahim,
Kaka, & Ammar, 2009).
The table below summarises the production and movement of goods to the distribution centres.
Units moved to each distribution centre
Per Pallet ($)
Adelaide Newcastle
Cairns 0 0
Darwin 368 406
Mandurah 0 0
Total 368 406
2. Market distribution network
⊘ This is a preview!⊘
Do you want full access?
Subscribe today to unlock all pages.
Trusted by 1+ million students worldwide
SUPPLY CHAIN MODELLING
7
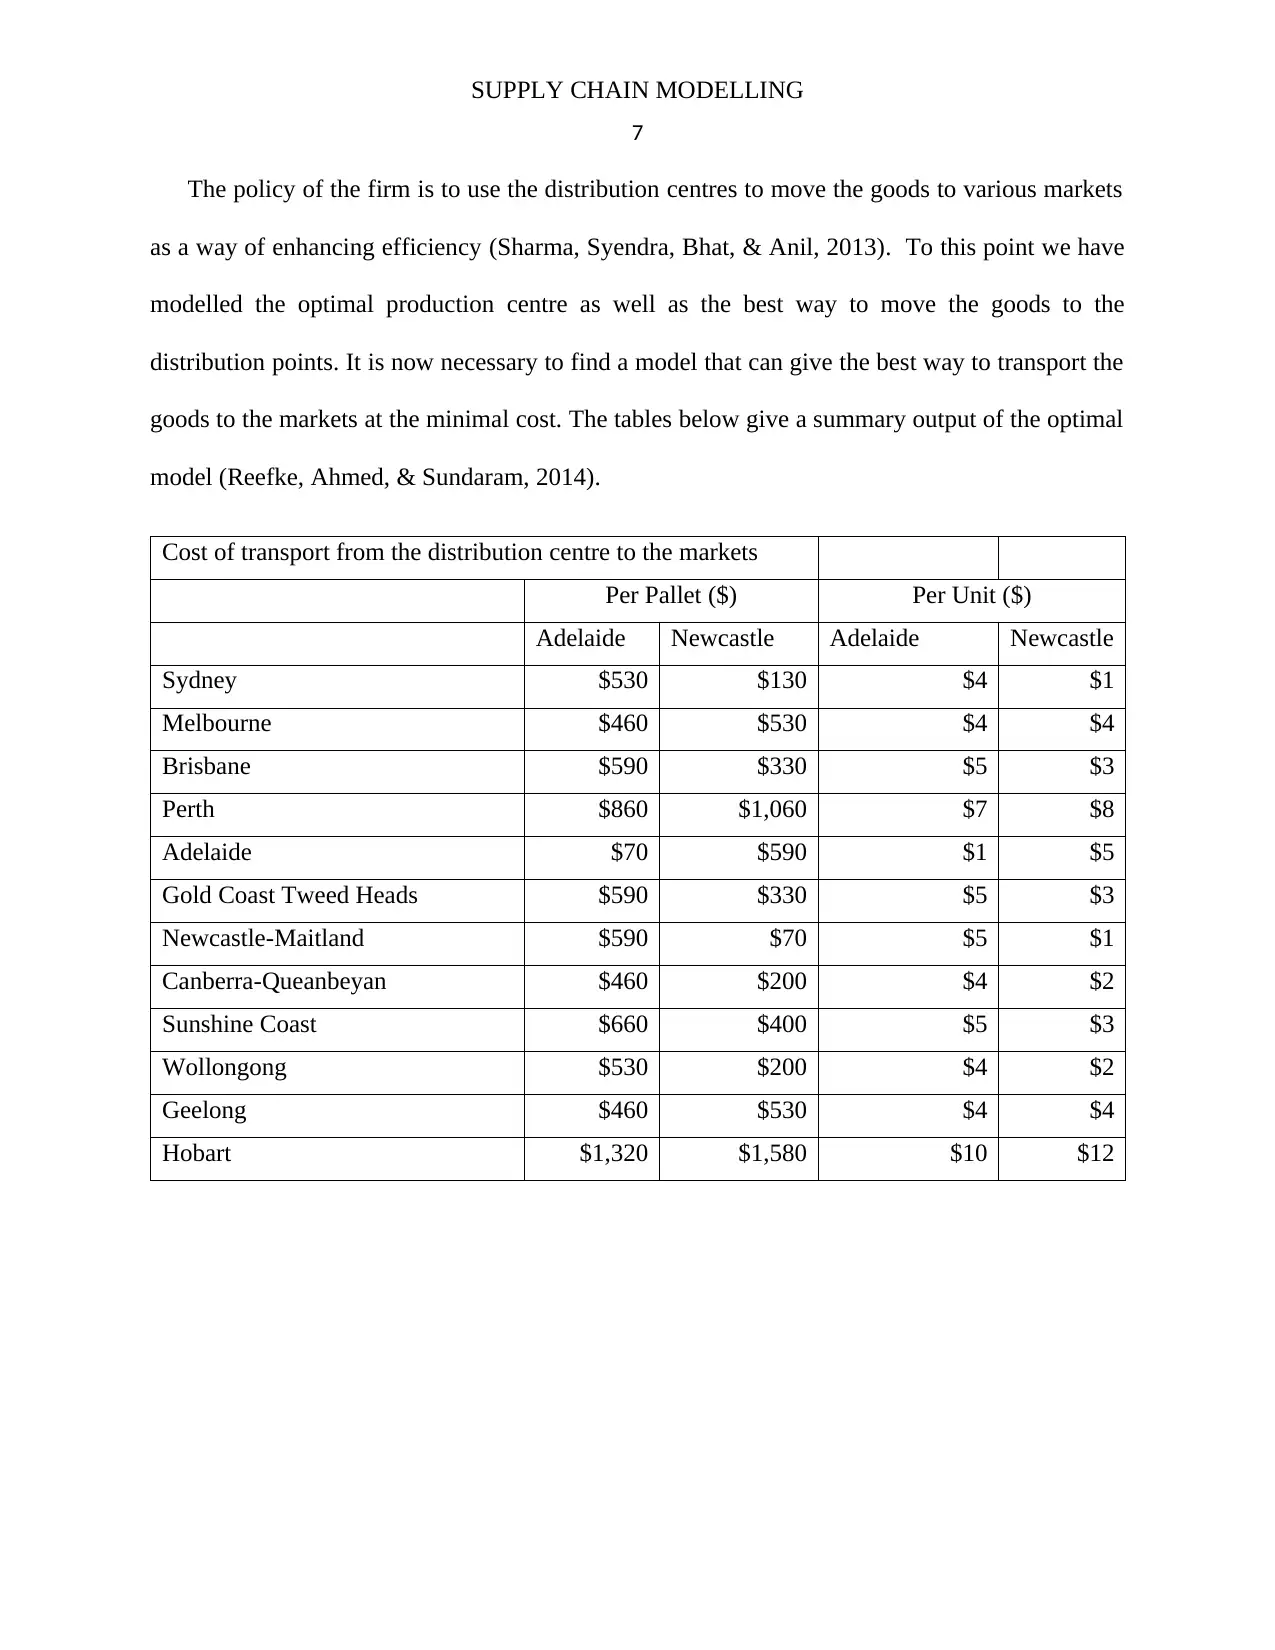
The policy of the firm is to use the distribution centres to move the goods to various markets
as a way of enhancing efficiency (Sharma, Syendra, Bhat, & Anil, 2013). To this point we have
modelled the optimal production centre as well as the best way to move the goods to the
distribution points. It is now necessary to find a model that can give the best way to transport the
goods to the markets at the minimal cost. The tables below give a summary output of the optimal
model (Reefke, Ahmed, & Sundaram, 2014).
Cost of transport from the distribution centre to the markets
Per Pallet ($) Per Unit ($)
Adelaide Newcastle Adelaide Newcastle
Sydney $530 $130 $4 $1
Melbourne $460 $530 $4 $4
Brisbane $590 $330 $5 $3
Perth $860 $1,060 $7 $8
Adelaide $70 $590 $1 $5
Gold Coast Tweed Heads $590 $330 $5 $3
Newcastle-Maitland $590 $70 $5 $1
Canberra-Queanbeyan $460 $200 $4 $2
Sunshine Coast $660 $400 $5 $3
Wollongong $530 $200 $4 $2
Geelong $460 $530 $4 $4
Hobart $1,320 $1,580 $10 $12
7
The policy of the firm is to use the distribution centres to move the goods to various markets
as a way of enhancing efficiency (Sharma, Syendra, Bhat, & Anil, 2013). To this point we have
modelled the optimal production centre as well as the best way to move the goods to the
distribution points. It is now necessary to find a model that can give the best way to transport the
goods to the markets at the minimal cost. The tables below give a summary output of the optimal
model (Reefke, Ahmed, & Sundaram, 2014).
Cost of transport from the distribution centre to the markets
Per Pallet ($) Per Unit ($)
Adelaide Newcastle Adelaide Newcastle
Sydney $530 $130 $4 $1
Melbourne $460 $530 $4 $4
Brisbane $590 $330 $5 $3
Perth $860 $1,060 $7 $8
Adelaide $70 $590 $1 $5
Gold Coast Tweed Heads $590 $330 $5 $3
Newcastle-Maitland $590 $70 $5 $1
Canberra-Queanbeyan $460 $200 $4 $2
Sunshine Coast $660 $400 $5 $3
Wollongong $530 $200 $4 $2
Geelong $460 $530 $4 $4
Hobart $1,320 $1,580 $10 $12
Paraphrase This Document
Need a fresh take? Get an instant paraphrase of this document with our AI Paraphraser
SUPPLY CHAIN MODELLING
8
Units transported to the various market centres
Adelaide Newcastle Adelaide NewcastleTotal supply Total demand
Sydney 0 209 0 0 50230 >= 50230
Melbourne 206 0 0 0 49360 >= 49360
Brisbane 0 103 0 0 24630 >= 24630
Perth 86 0 0 0 20590 >= 20590
Adelaide 56 0 0 0 13460 >= 13460
Gold Coast Tweed Heads 0 28 0 0 6790 >= 6790
Newcstle-Maitland 0 20 0 0 4870 >= 4870
Canberra-Queanbeyan 0 19 0 0 4580 >= 4580
Sunshine Coast 0 14 0 0 3330 >= 3330
Wollongong 0 13 0 0 3020 >= 3020
Geelong 11 0 0 0 2680 >= 2680
Hobart 10 0 0 0 2330 >= 2330
Total 368 406 0 0
Per Pallet ($) Per Unit ($)
Objective function
Total market distribution cost $273,979.17
Constraints
Total Supply >= Total demand
Distributed units is integer
Based on the model developed above its evident that transporting drones as units is very
expensive and thus the pallet method needs to be prioritized. The supply of the markets will be
either done from Newcastle or Adelaide based on the cost incurred to move the goods from
either of the distribution centre to the respective market. In summary the table below describes
away to supply the market from the distribution points (Sato-Silva, et al., 2015).
Per Pallet ($)
Adelaide Newcastle
Sydney 0 209
Melbourne 206 0
Brisbane 0 103
Perth 86 0
Adelaide 56 0
Gold Coast Tweed Heads 0 28
SUPPLY CHAIN MODELLING
9
Newcastle-Maitland 0 20
Canberra-Queanbeyan 0 19
Sunshine Coast 0 14
Wollongong 0 13
Geelong 11 0
Hobart 10 0
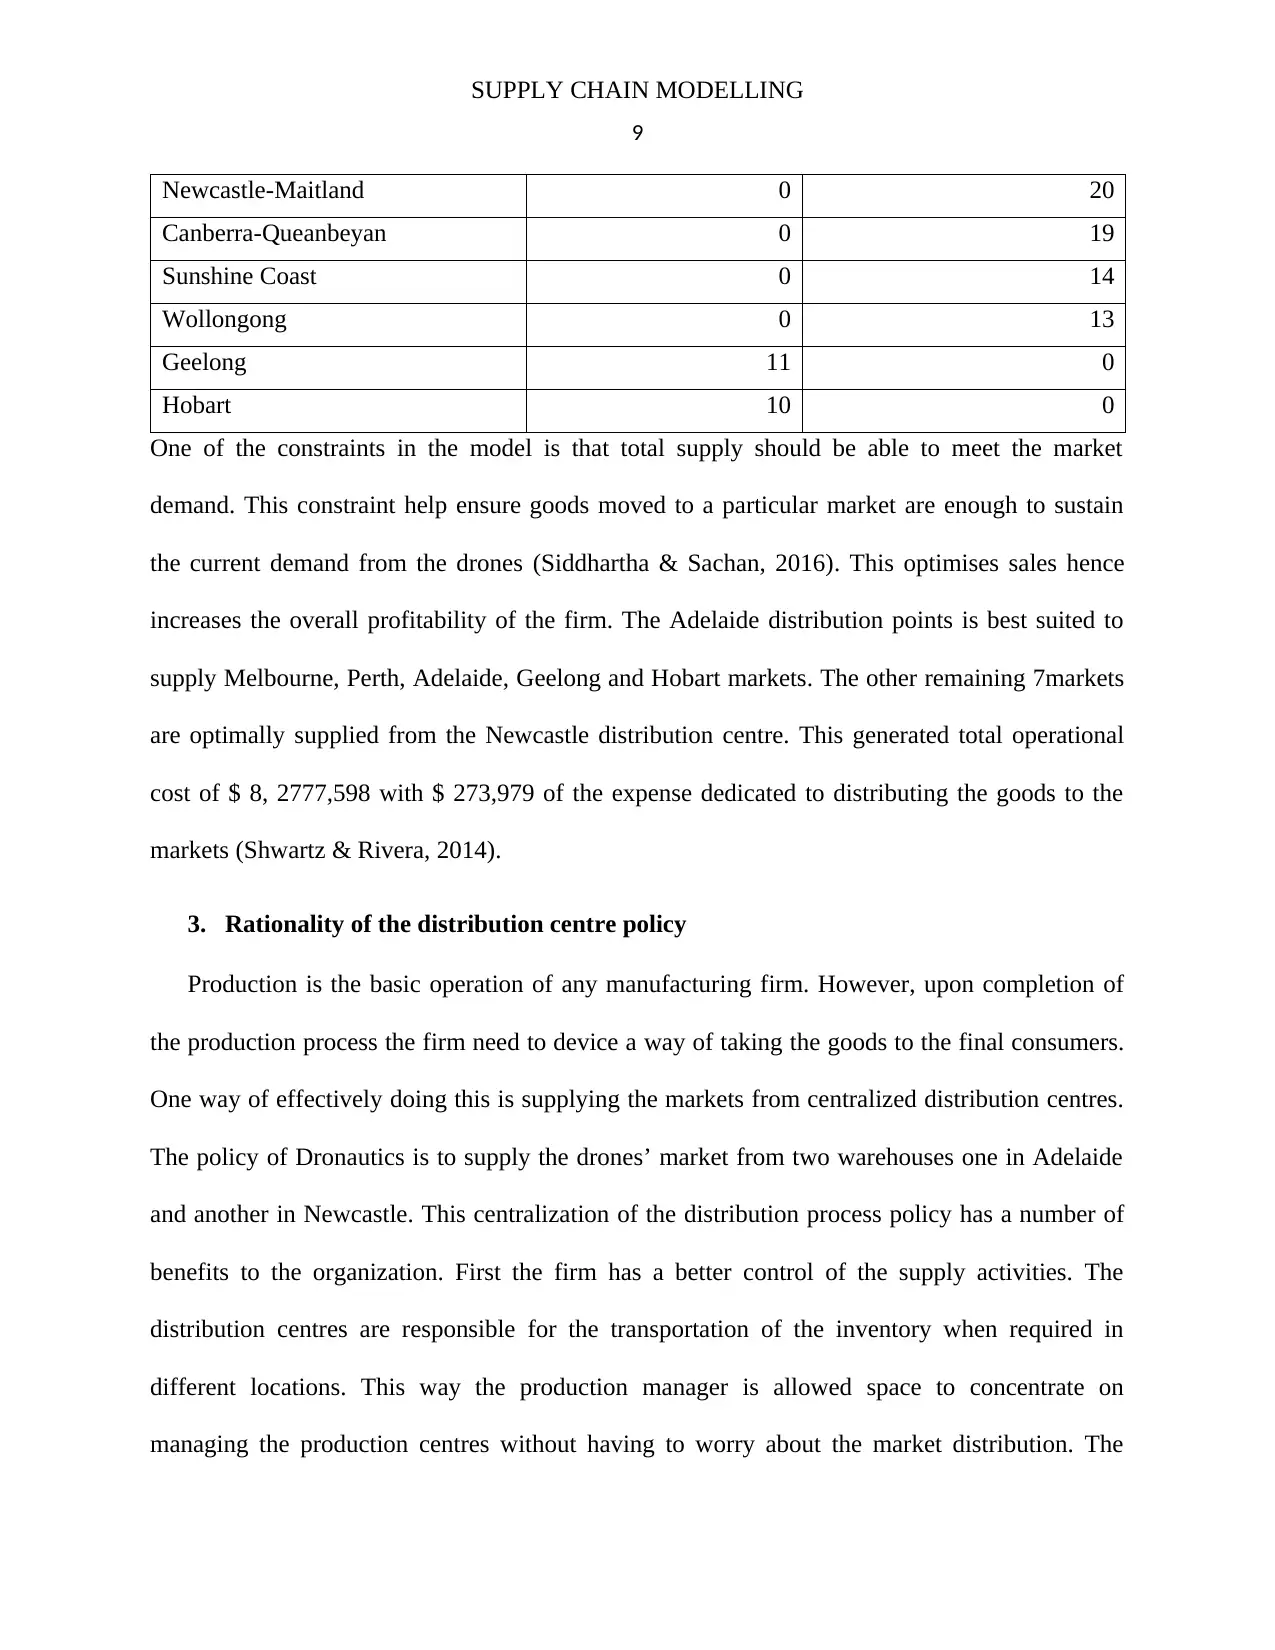
One of the constraints in the model is that total supply should be able to meet the market
demand. This constraint help ensure goods moved to a particular market are enough to sustain
the current demand from the drones (Siddhartha & Sachan, 2016). This optimises sales hence
increases the overall profitability of the firm. The Adelaide distribution points is best suited to
supply Melbourne, Perth, Adelaide, Geelong and Hobart markets. The other remaining 7markets
are optimally supplied from the Newcastle distribution centre. This generated total operational
cost of $ 8, 2777,598 with $ 273,979 of the expense dedicated to distributing the goods to the
markets (Shwartz & Rivera, 2014).
3. Rationality of the distribution centre policy
Production is the basic operation of any manufacturing firm. However, upon completion of
the production process the firm need to device a way of taking the goods to the final consumers.
One way of effectively doing this is supplying the markets from centralized distribution centres.
The policy of Dronautics is to supply the drones’ market from two warehouses one in Adelaide
and another in Newcastle. This centralization of the distribution process policy has a number of
benefits to the organization. First the firm has a better control of the supply activities. The
distribution centres are responsible for the transportation of the inventory when required in
different locations. This way the production manager is allowed space to concentrate on
managing the production centres without having to worry about the market distribution. The
9
Newcastle-Maitland 0 20
Canberra-Queanbeyan 0 19
Sunshine Coast 0 14
Wollongong 0 13
Geelong 11 0
Hobart 10 0
One of the constraints in the model is that total supply should be able to meet the market
demand. This constraint help ensure goods moved to a particular market are enough to sustain
the current demand from the drones (Siddhartha & Sachan, 2016). This optimises sales hence
increases the overall profitability of the firm. The Adelaide distribution points is best suited to
supply Melbourne, Perth, Adelaide, Geelong and Hobart markets. The other remaining 7markets
are optimally supplied from the Newcastle distribution centre. This generated total operational
cost of $ 8, 2777,598 with $ 273,979 of the expense dedicated to distributing the goods to the
markets (Shwartz & Rivera, 2014).
3. Rationality of the distribution centre policy
Production is the basic operation of any manufacturing firm. However, upon completion of
the production process the firm need to device a way of taking the goods to the final consumers.
One way of effectively doing this is supplying the markets from centralized distribution centres.
The policy of Dronautics is to supply the drones’ market from two warehouses one in Adelaide
and another in Newcastle. This centralization of the distribution process policy has a number of
benefits to the organization. First the firm has a better control of the supply activities. The
distribution centres are responsible for the transportation of the inventory when required in
different locations. This way the production manager is allowed space to concentrate on
managing the production centres without having to worry about the market distribution. The
⊘ This is a preview!⊘
Do you want full access?
Subscribe today to unlock all pages.
Trusted by 1+ million students worldwide
SUPPLY CHAIN MODELLING
10
distribution centre also allows for economical storage of the products as well as ease of accessing
the products from the markets (Soni, et al., 2014). The policy to operate two centralised
distribution centres is thus significant in cost minimization. Suppose the firm was to make some
changes to the policy, I will suggest they move the production sites to the distribution centres.
This way the firm can cut down the cost of transporting the products to the distribution enter as
well as enhance information flow from the distribution manager to the production manager. By
making this change am expecting the total cost of running the supply chain network to drop
significantly to the benefit of the company’s shareholders (Taghipour, Atour, Frayret, & Jean,
2013).
4. Breaking down of pallets
Allowing breaking down of pallets means goods transported to a specific market can be in
either pallet packs of 240 drones or less. This strategy allows the firm to eliminate any form of
transportation that involve moving the goods as single units to reduce the cost of transport. In the
model generated above, the firm is to transport the goods from the production point to the
distribution centres as pallets only. A similar technique is also applied in moving the drones from
the distribution centres to the markets. Being that the firm is already transporting in pallets only
the breaking down of the pallets will yield no cost advantage as the cost of transport is already at
its optimal points given the current operating policies and the market product demand (Wang, et
al., 2013).
5. Production relocation
Maintaining distribution points away from the production sites means incurring additional
transport charges. Also shifting the production points to the distribution centres means ensuring
Paraphrase This Document
Need a fresh take? Get an instant paraphrase of this document with our AI Paraphraser
SUPPLY CHAIN MODELLING
11
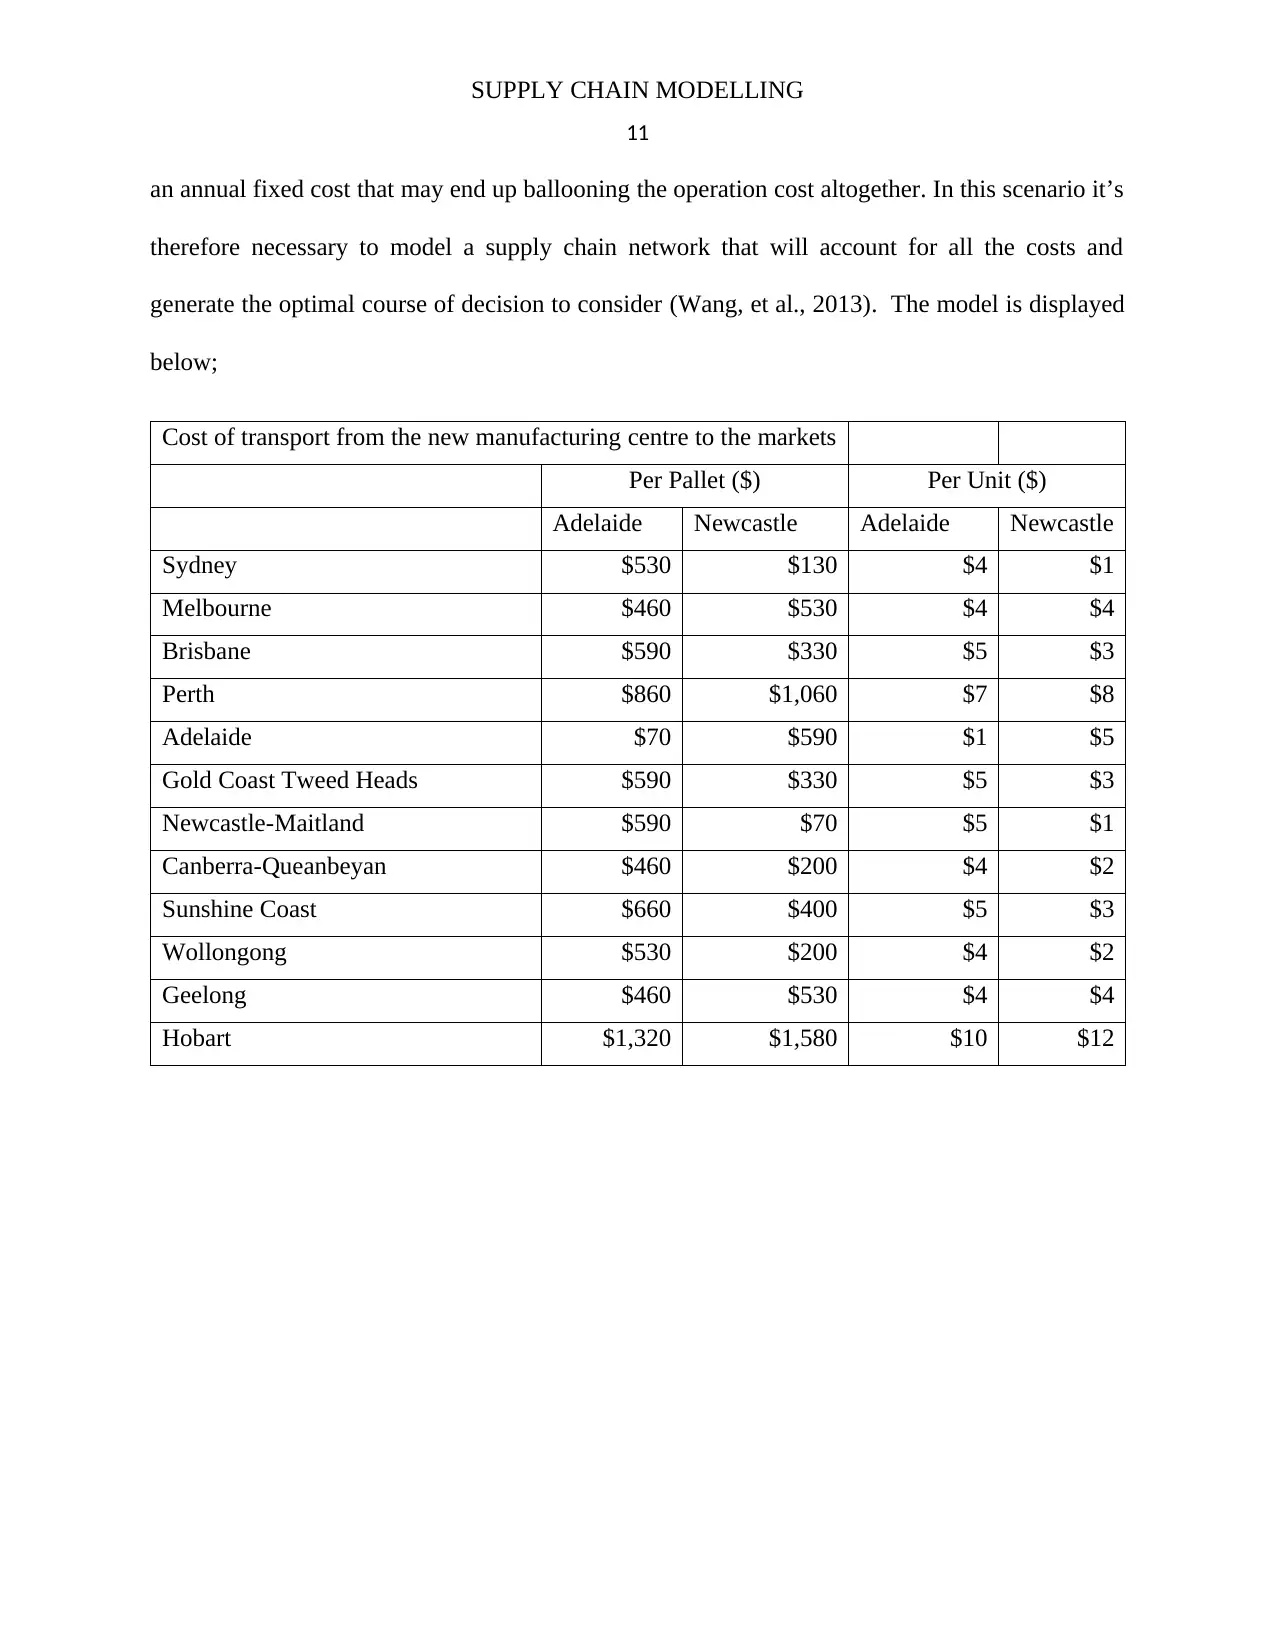
an annual fixed cost that may end up ballooning the operation cost altogether. In this scenario it’s
therefore necessary to model a supply chain network that will account for all the costs and
generate the optimal course of decision to consider (Wang, et al., 2013). The model is displayed
below;
Cost of transport from the new manufacturing centre to the markets
Per Pallet ($) Per Unit ($)
Adelaide Newcastle Adelaide Newcastle
Sydney $530 $130 $4 $1
Melbourne $460 $530 $4 $4
Brisbane $590 $330 $5 $3
Perth $860 $1,060 $7 $8
Adelaide $70 $590 $1 $5
Gold Coast Tweed Heads $590 $330 $5 $3
Newcastle-Maitland $590 $70 $5 $1
Canberra-Queanbeyan $460 $200 $4 $2
Sunshine Coast $660 $400 $5 $3
Wollongong $530 $200 $4 $2
Geelong $460 $530 $4 $4
Hobart $1,320 $1,580 $10 $12
11
an annual fixed cost that may end up ballooning the operation cost altogether. In this scenario it’s
therefore necessary to model a supply chain network that will account for all the costs and
generate the optimal course of decision to consider (Wang, et al., 2013). The model is displayed
below;
Cost of transport from the new manufacturing centre to the markets
Per Pallet ($) Per Unit ($)
Adelaide Newcastle Adelaide Newcastle
Sydney $530 $130 $4 $1
Melbourne $460 $530 $4 $4
Brisbane $590 $330 $5 $3
Perth $860 $1,060 $7 $8
Adelaide $70 $590 $1 $5
Gold Coast Tweed Heads $590 $330 $5 $3
Newcastle-Maitland $590 $70 $5 $1
Canberra-Queanbeyan $460 $200 $4 $2
Sunshine Coast $660 $400 $5 $3
Wollongong $530 $200 $4 $2
Geelong $460 $530 $4 $4
Hobart $1,320 $1,580 $10 $12
SUPPLY CHAIN MODELLING
12
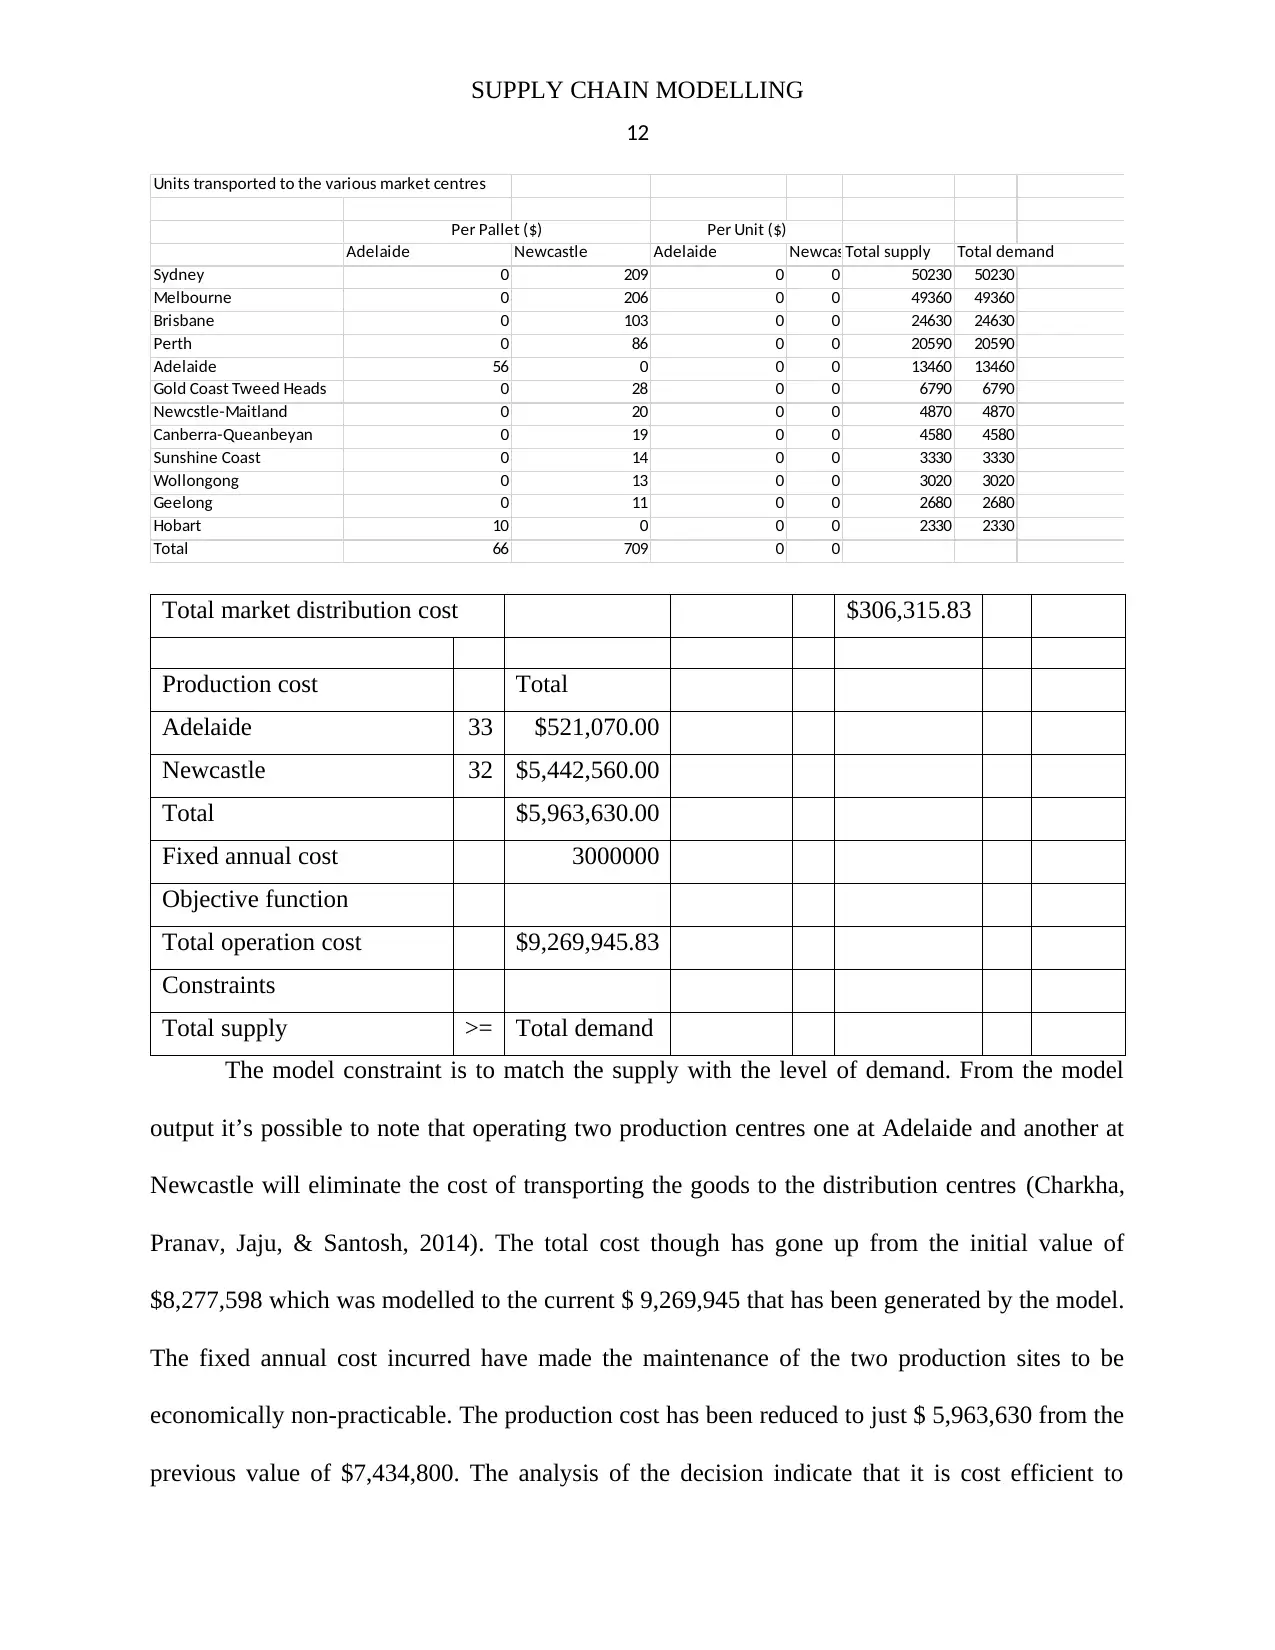
Units transported to the various market centres
Adelaide Newcastle Adelaide NewcastleTotal supply Total demand
Sydney 0 209 0 0 50230 50230
Melbourne 0 206 0 0 49360 49360
Brisbane 0 103 0 0 24630 24630
Perth 0 86 0 0 20590 20590
Adelaide 56 0 0 0 13460 13460
Gold Coast Tweed Heads 0 28 0 0 6790 6790
Newcstle-Maitland 0 20 0 0 4870 4870
Canberra-Queanbeyan 0 19 0 0 4580 4580
Sunshine Coast 0 14 0 0 3330 3330
Wollongong 0 13 0 0 3020 3020
Geelong 0 11 0 0 2680 2680
Hobart 10 0 0 0 2330 2330
Total 66 709 0 0
Per Pallet ($) Per Unit ($)
Total market distribution cost $306,315.83
Production cost Total
Adelaide 33 $521,070.00
Newcastle 32 $5,442,560.00
Total $5,963,630.00
Fixed annual cost 3000000
Objective function
Total operation cost $9,269,945.83
Constraints
Total supply >= Total demand
The model constraint is to match the supply with the level of demand. From the model
output it’s possible to note that operating two production centres one at Adelaide and another at
Newcastle will eliminate the cost of transporting the goods to the distribution centres (Charkha,
Pranav, Jaju, & Santosh, 2014). The total cost though has gone up from the initial value of
$8,277,598 which was modelled to the current $ 9,269,945 that has been generated by the model.
The fixed annual cost incurred have made the maintenance of the two production sites to be
economically non-practicable. The production cost has been reduced to just $ 5,963,630 from the
previous value of $7,434,800. The analysis of the decision indicate that it is cost efficient to
12
Units transported to the various market centres
Adelaide Newcastle Adelaide NewcastleTotal supply Total demand
Sydney 0 209 0 0 50230 50230
Melbourne 0 206 0 0 49360 49360
Brisbane 0 103 0 0 24630 24630
Perth 0 86 0 0 20590 20590
Adelaide 56 0 0 0 13460 13460
Gold Coast Tweed Heads 0 28 0 0 6790 6790
Newcstle-Maitland 0 20 0 0 4870 4870
Canberra-Queanbeyan 0 19 0 0 4580 4580
Sunshine Coast 0 14 0 0 3330 3330
Wollongong 0 13 0 0 3020 3020
Geelong 0 11 0 0 2680 2680
Hobart 10 0 0 0 2330 2330
Total 66 709 0 0
Per Pallet ($) Per Unit ($)
Total market distribution cost $306,315.83
Production cost Total
Adelaide 33 $521,070.00
Newcastle 32 $5,442,560.00
Total $5,963,630.00
Fixed annual cost 3000000
Objective function
Total operation cost $9,269,945.83
Constraints
Total supply >= Total demand
The model constraint is to match the supply with the level of demand. From the model
output it’s possible to note that operating two production centres one at Adelaide and another at
Newcastle will eliminate the cost of transporting the goods to the distribution centres (Charkha,
Pranav, Jaju, & Santosh, 2014). The total cost though has gone up from the initial value of
$8,277,598 which was modelled to the current $ 9,269,945 that has been generated by the model.
The fixed annual cost incurred have made the maintenance of the two production sites to be
economically non-practicable. The production cost has been reduced to just $ 5,963,630 from the
previous value of $7,434,800. The analysis of the decision indicate that it is cost efficient to
⊘ This is a preview!⊘
Do you want full access?
Subscribe today to unlock all pages.
Trusted by 1+ million students worldwide
1 out of 18
Related Documents


Your All-in-One AI-Powered Toolkit for Academic Success.
+13062052269
info@desklib.com
Available 24*7 on WhatsApp / Email
![[object Object]](/_next/static/media/star-bottom.7253800d.svg)
Unlock your academic potential
Copyright © 2020–2025 A2Z Services. All Rights Reserved. Developed and managed by ZUCOL.