Determination of the Ka for an Indicator by Spectrophotometry
Added on 2023-02-01
7 Pages1218 Words23 Views
Surname 1
Name
Instructor
Course
Date
Determination of the Ka for an Indicator by Spectrophotometry
Introduction
This is an experiment to determine the pKa of an acid-base indicator using the
spectrophotometry method. An indicator tells the end of a titration (Daniella, and Burkina, p. 9-
4). For the acid-base titrations, either a weak acid or a weak base detects the end of the titration.
A sharp change in the color of the indicator due to a steep in the pH of the solution closer to the
equivalence point of the titration indicates the end of an acid-base titration (Danilla, and Buskina,
p. 9-4). The use and application of spectrophotometry in this experiment are to determine the
concentration of the ionized base and unionized acid forms of the indicator. In addition to that,
spectrophotometry also helps to determine the dissociation constant of the acid by using the
Henderson –Hasselbach equation (Danilla, and Buskina, p. 9-4). The main objectives of the
experiment are to determine the pKa of the acid-base indicator. Methyl red indicator, for example,
is a weak organic acid, which is red in acidic solution but changes to yellow in ionized basic
solution. Methyl red indicator is a weak acid represented as HMR dissociates in both the ionized
and unionized solution as:
Surname 2
HMR ↔H+ MR-
Procedure
The wavelength of maximum absorption was first determined for the unionized and
ionized forms of the indicator both of the two solutions A and B against 0.01HCl and0.01
sodium acetate respectively and recorded. A plot the absorbance as a function of the wavelength
showing various spectrum for the indicator under study was drawn (Zayed, Mohamed, and
Mahmoud, P. 1135-1149). 30cm3, 20cm3 and 10cm3 of solution A was pipetted into three
separate 50cm3 and each solution topped up with 0.01 HCl .Similar procedure was done to
solution B but topped up with 0.01 sodium acetate solution instead and the absorbance for each
solution measured.
Results and calculations.
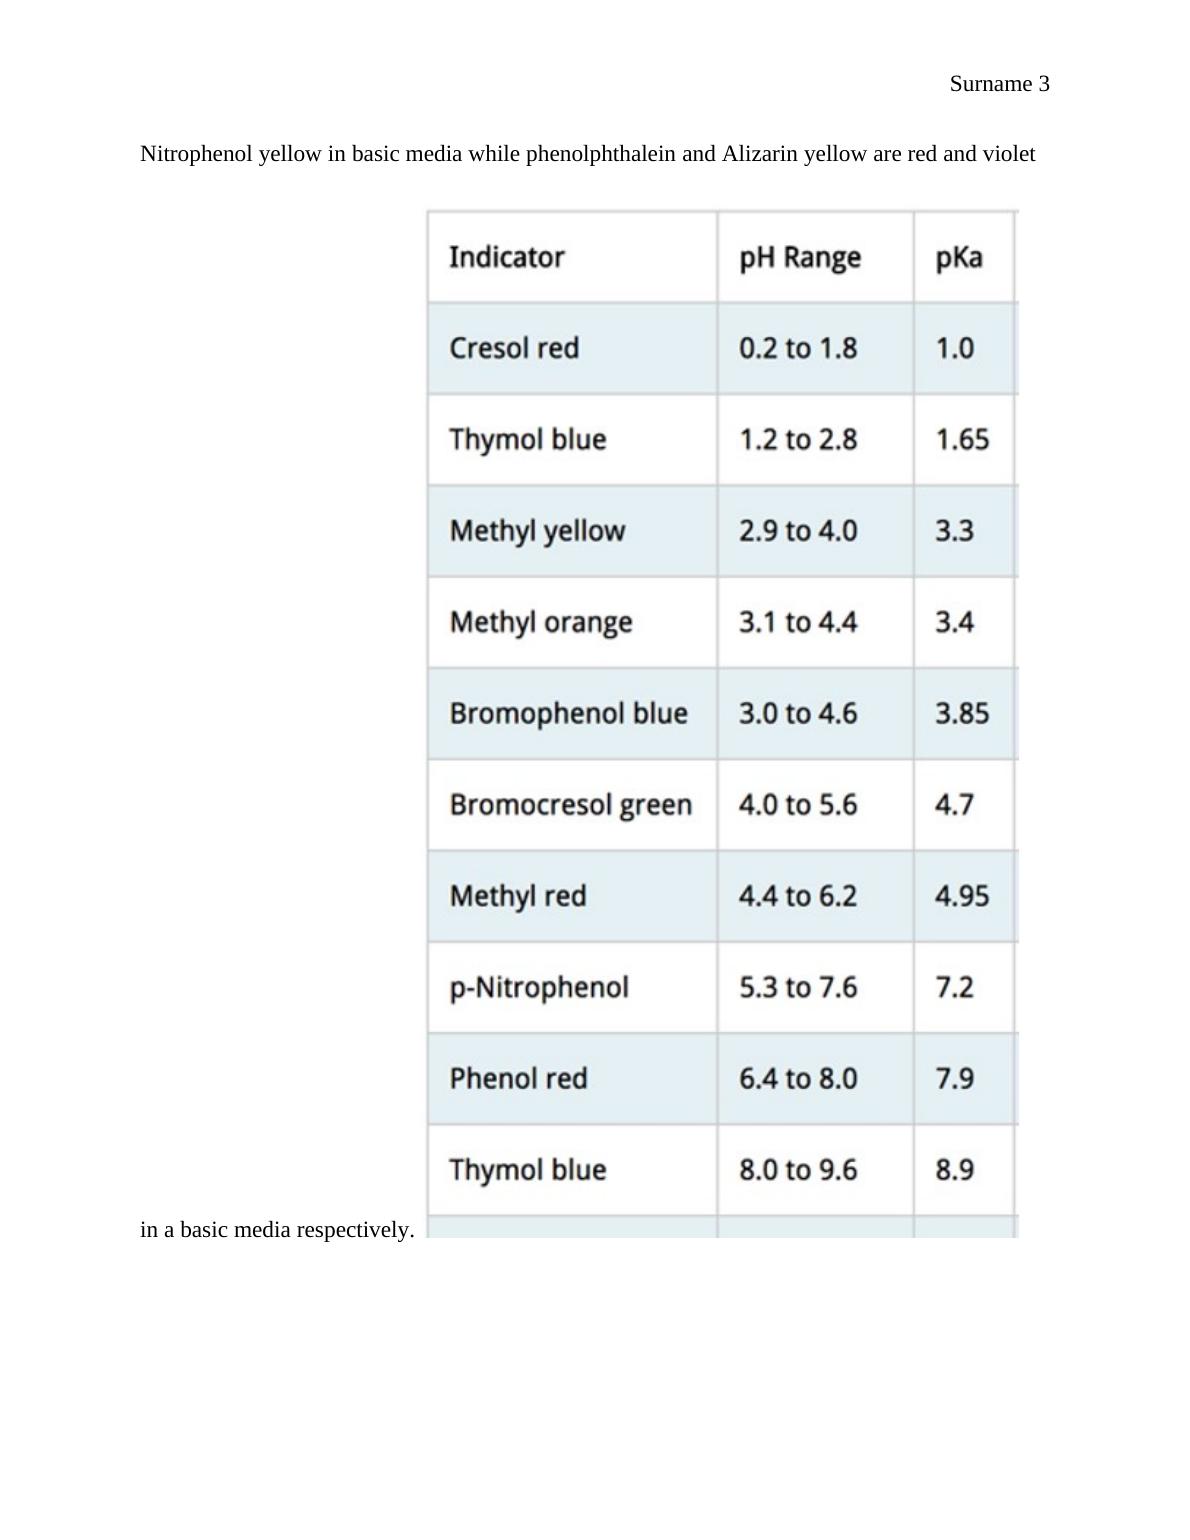
The table of the results drawn below indicates the pKa experimental values obtained for
each of the indicator used. Methyl red for example in a pH range of 4.4 to 6.2 gives the pKa
value of 4.95(Kirkwood, Jobie, et al.,p.2367-2375). Changing from red in an acidic solution to
yellow in basic media, indicated on the table below as (R-Y).Cresol red, Thymol blue and
Methyl yellow also behave the same way as the methyl red in acidic media turning from red to
yellow indicated as (R-Y) in the table below.
Bromophenol blue, Bromocresol green and Thymol blue indicators are all blues in basic
solutions indicated on the table as (Y-B). Methyl orange is orange in acidic solution, p-
HMR ↔H+ MR-
Procedure
The wavelength of maximum absorption was first determined for the unionized and
ionized forms of the indicator both of the two solutions A and B against 0.01HCl and0.01
sodium acetate respectively and recorded. A plot the absorbance as a function of the wavelength
showing various spectrum for the indicator under study was drawn (Zayed, Mohamed, and
Mahmoud, P. 1135-1149). 30cm3, 20cm3 and 10cm3 of solution A was pipetted into three
separate 50cm3 and each solution topped up with 0.01 HCl .Similar procedure was done to
solution B but topped up with 0.01 sodium acetate solution instead and the absorbance for each
solution measured.
Results and calculations.
The table of the results drawn below indicates the pKa experimental values obtained for
each of the indicator used. Methyl red for example in a pH range of 4.4 to 6.2 gives the pKa
value of 4.95(Kirkwood, Jobie, et al.,p.2367-2375). Changing from red in an acidic solution to
yellow in basic media, indicated on the table below as (R-Y).Cresol red, Thymol blue and
Methyl yellow also behave the same way as the methyl red in acidic media turning from red to
yellow indicated as (R-Y) in the table below.
Bromophenol blue, Bromocresol green and Thymol blue indicators are all blues in basic
solutions indicated on the table as (Y-B). Methyl orange is orange in acidic solution, p-
Surname 3
Nitrophenol yellow in basic media while phenolphthalein and Alizarin yellow are red and violet
in a basic media respectively.
Nitrophenol yellow in basic media while phenolphthalein and Alizarin yellow are red and violet
in a basic media respectively.
End of preview
Want to access all the pages? Upload your documents or become a member.
Related Documents
Acid-Base Titration Exerciselg...
|7
|1302
|220