Political Opinion Assessment Report: US Elections Analysis
VerifiedAdded on 2021/10/14
|19
|3469
|103
Report
AI Summary
This report presents a comprehensive analysis of political opinions and voting behavior in the United States, focusing on data collected before and after the 2016 presidential election. The assessment examines three key issues: party registration, voter participation in the 2012 election, and voting choices in the 2016 election. The report utilizes statistical data to determine party affiliations, voter turnout, and candidate preferences. The report also analyzes the influence of demographic variables such as age group, state region, sexual orientation, and location within FIPS states on political opinions. The findings reveal patterns in voter behavior across different demographics, highlighting the impact of age, geographical location, and sexual orientation on political affiliations and voting decisions. The report includes data on voters of Hillary Clinton and Donald Trump. The data analysis provides valuable insights into the dynamics of US elections and the factors that shape political preferences.
Surname: 1
Name of Student
Name of Professor
Course Name
Date
Political Opinion Assessment
Part 1
The Issues
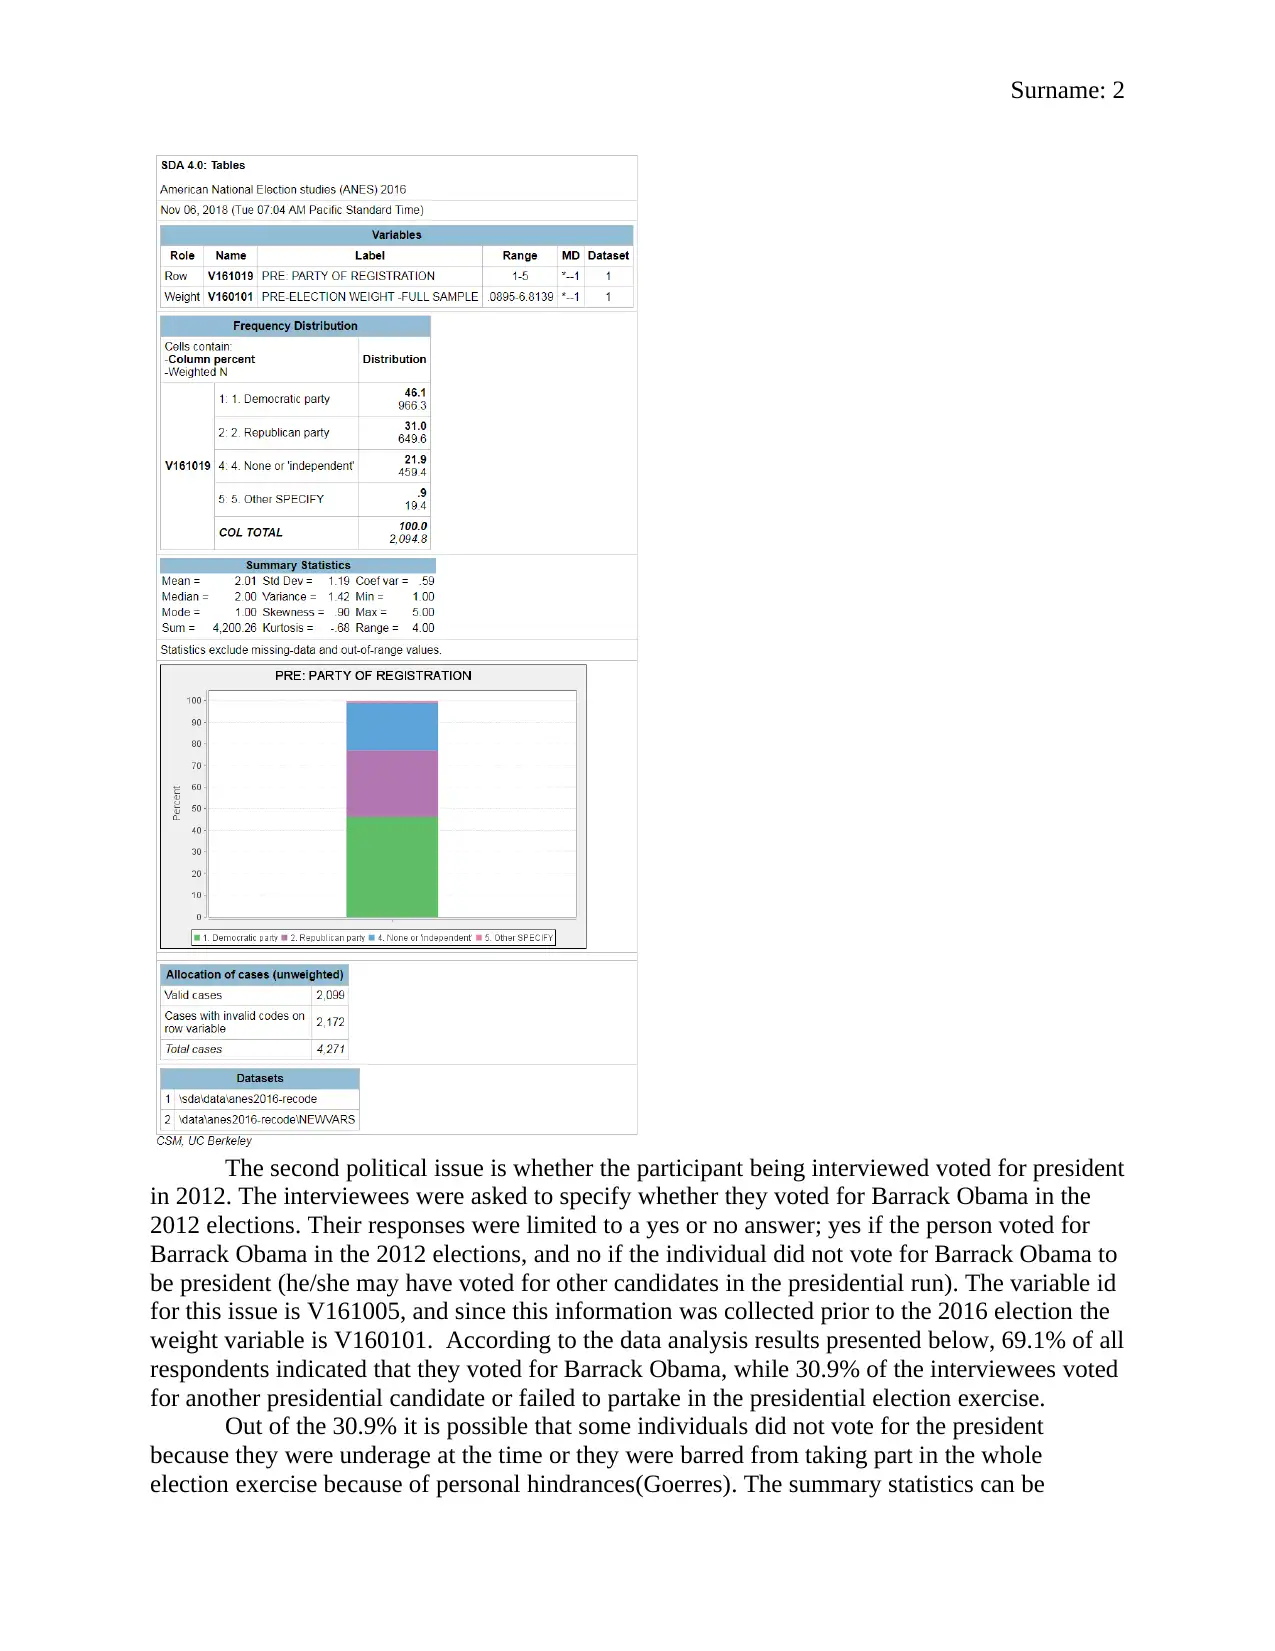
The first political opinion issue is the party of registration that Americans are affiliated
with. This relates to interviews that were done pre-election regardless of method employed in
information acquisition. The variable id is V161019 and the weight associated with pre-election
interview variables is V160101. The interviewee was presented with five response option when
asked about their party of registration. These five options are: Democratic Party, Republican
Party, none or independent, and other. According to the tabulation results 46.1% align with
Democratic Party, 31% are faithful to Republican Party, 21.9% has no affiliation or they are
independent, and 0.9% are registered with other parties. The majority of interviewees prior to the
2016 elections are democrats which indicate a good political backing for presidential candidates
in the Democratic Party(Ansolabehere and Hersh). The second largest affiliation group is that of
republican supporters.
It is however important to note that there is considerably larger difference of 15.1%
between the Democratic Party supporters and Republican Party supporters. This means that if an
election was to be held at the time of the interviews the Democratic Party's presidential candidate
would beat his Republican opponent by a margin of 15.1%. It is also vital to not that the number
of respondents who indicated they were not registered with any political party is considerably
high at 21%. This can be interpreted to mean that this niche of voters is still undecided on who
to vote for or they have mixed opinions with regard to both Republican and Democratic political
ideologies. Lastly, only a very small group of interviews indicated they had registered with other
parties other than Republican and Democratic parties.
Name of Student
Name of Professor
Course Name
Date
Political Opinion Assessment
Part 1
The Issues
The first political opinion issue is the party of registration that Americans are affiliated
with. This relates to interviews that were done pre-election regardless of method employed in
information acquisition. The variable id is V161019 and the weight associated with pre-election
interview variables is V160101. The interviewee was presented with five response option when
asked about their party of registration. These five options are: Democratic Party, Republican
Party, none or independent, and other. According to the tabulation results 46.1% align with
Democratic Party, 31% are faithful to Republican Party, 21.9% has no affiliation or they are
independent, and 0.9% are registered with other parties. The majority of interviewees prior to the
2016 elections are democrats which indicate a good political backing for presidential candidates
in the Democratic Party(Ansolabehere and Hersh). The second largest affiliation group is that of
republican supporters.
It is however important to note that there is considerably larger difference of 15.1%
between the Democratic Party supporters and Republican Party supporters. This means that if an
election was to be held at the time of the interviews the Democratic Party's presidential candidate
would beat his Republican opponent by a margin of 15.1%. It is also vital to not that the number
of respondents who indicated they were not registered with any political party is considerably
high at 21%. This can be interpreted to mean that this niche of voters is still undecided on who
to vote for or they have mixed opinions with regard to both Republican and Democratic political
ideologies. Lastly, only a very small group of interviews indicated they had registered with other
parties other than Republican and Democratic parties.
Paraphrase This Document
Need a fresh take? Get an instant paraphrase of this document with our AI Paraphraser
Surname: 2
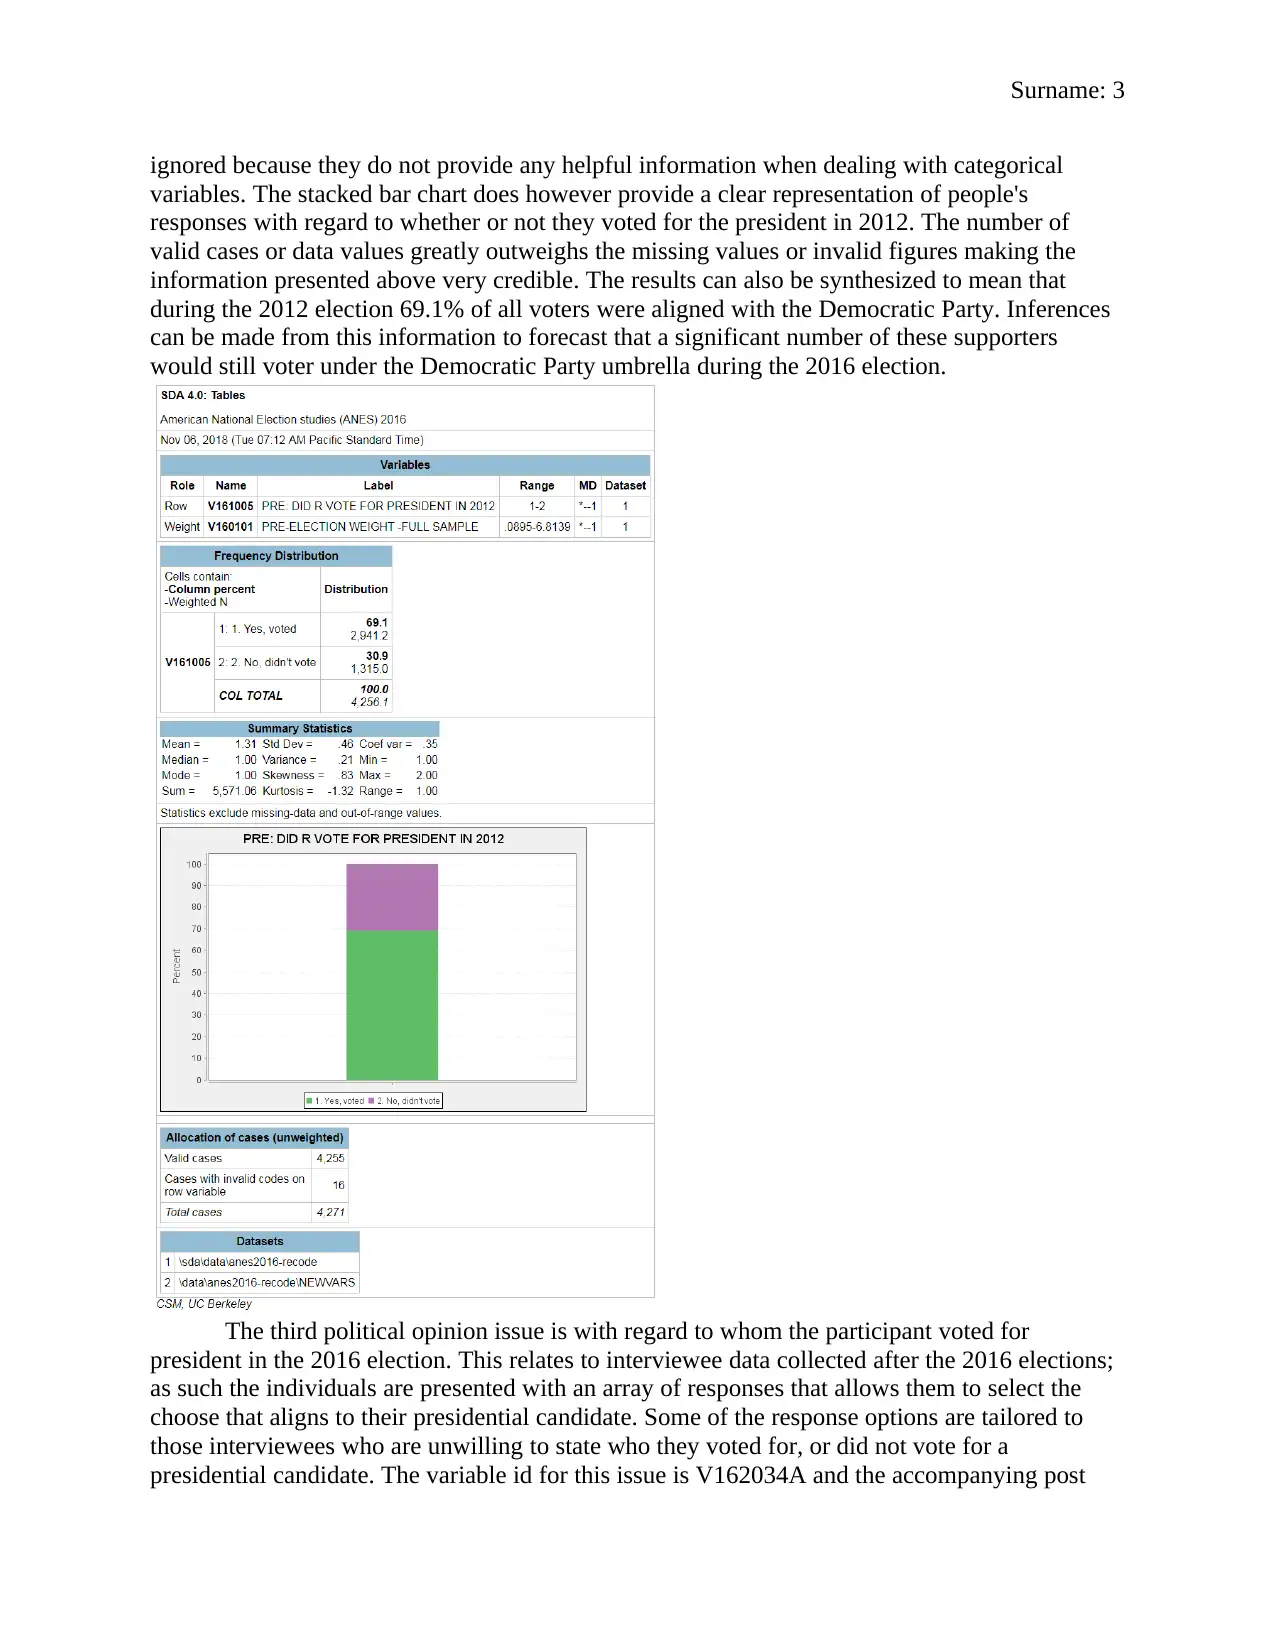
The second political issue is whether the participant being interviewed voted for president
in 2012. The interviewees were asked to specify whether they voted for Barrack Obama in the
2012 elections. Their responses were limited to a yes or no answer; yes if the person voted for
Barrack Obama in the 2012 elections, and no if the individual did not vote for Barrack Obama to
be president (he/she may have voted for other candidates in the presidential run). The variable id
for this issue is V161005, and since this information was collected prior to the 2016 election the
weight variable is V160101. According to the data analysis results presented below, 69.1% of all
respondents indicated that they voted for Barrack Obama, while 30.9% of the interviewees voted
for another presidential candidate or failed to partake in the presidential election exercise.
Out of the 30.9% it is possible that some individuals did not vote for the president
because they were underage at the time or they were barred from taking part in the whole
election exercise because of personal hindrances(Goerres). The summary statistics can be
Surname: 3
ignored because they do not provide any helpful information when dealing with categorical
variables. The stacked bar chart does however provide a clear representation of people's
responses with regard to whether or not they voted for the president in 2012. The number of
valid cases or data values greatly outweighs the missing values or invalid figures making the
information presented above very credible. The results can also be synthesized to mean that
during the 2012 election 69.1% of all voters were aligned with the Democratic Party. Inferences
can be made from this information to forecast that a significant number of these supporters
would still voter under the Democratic Party umbrella during the 2016 election.
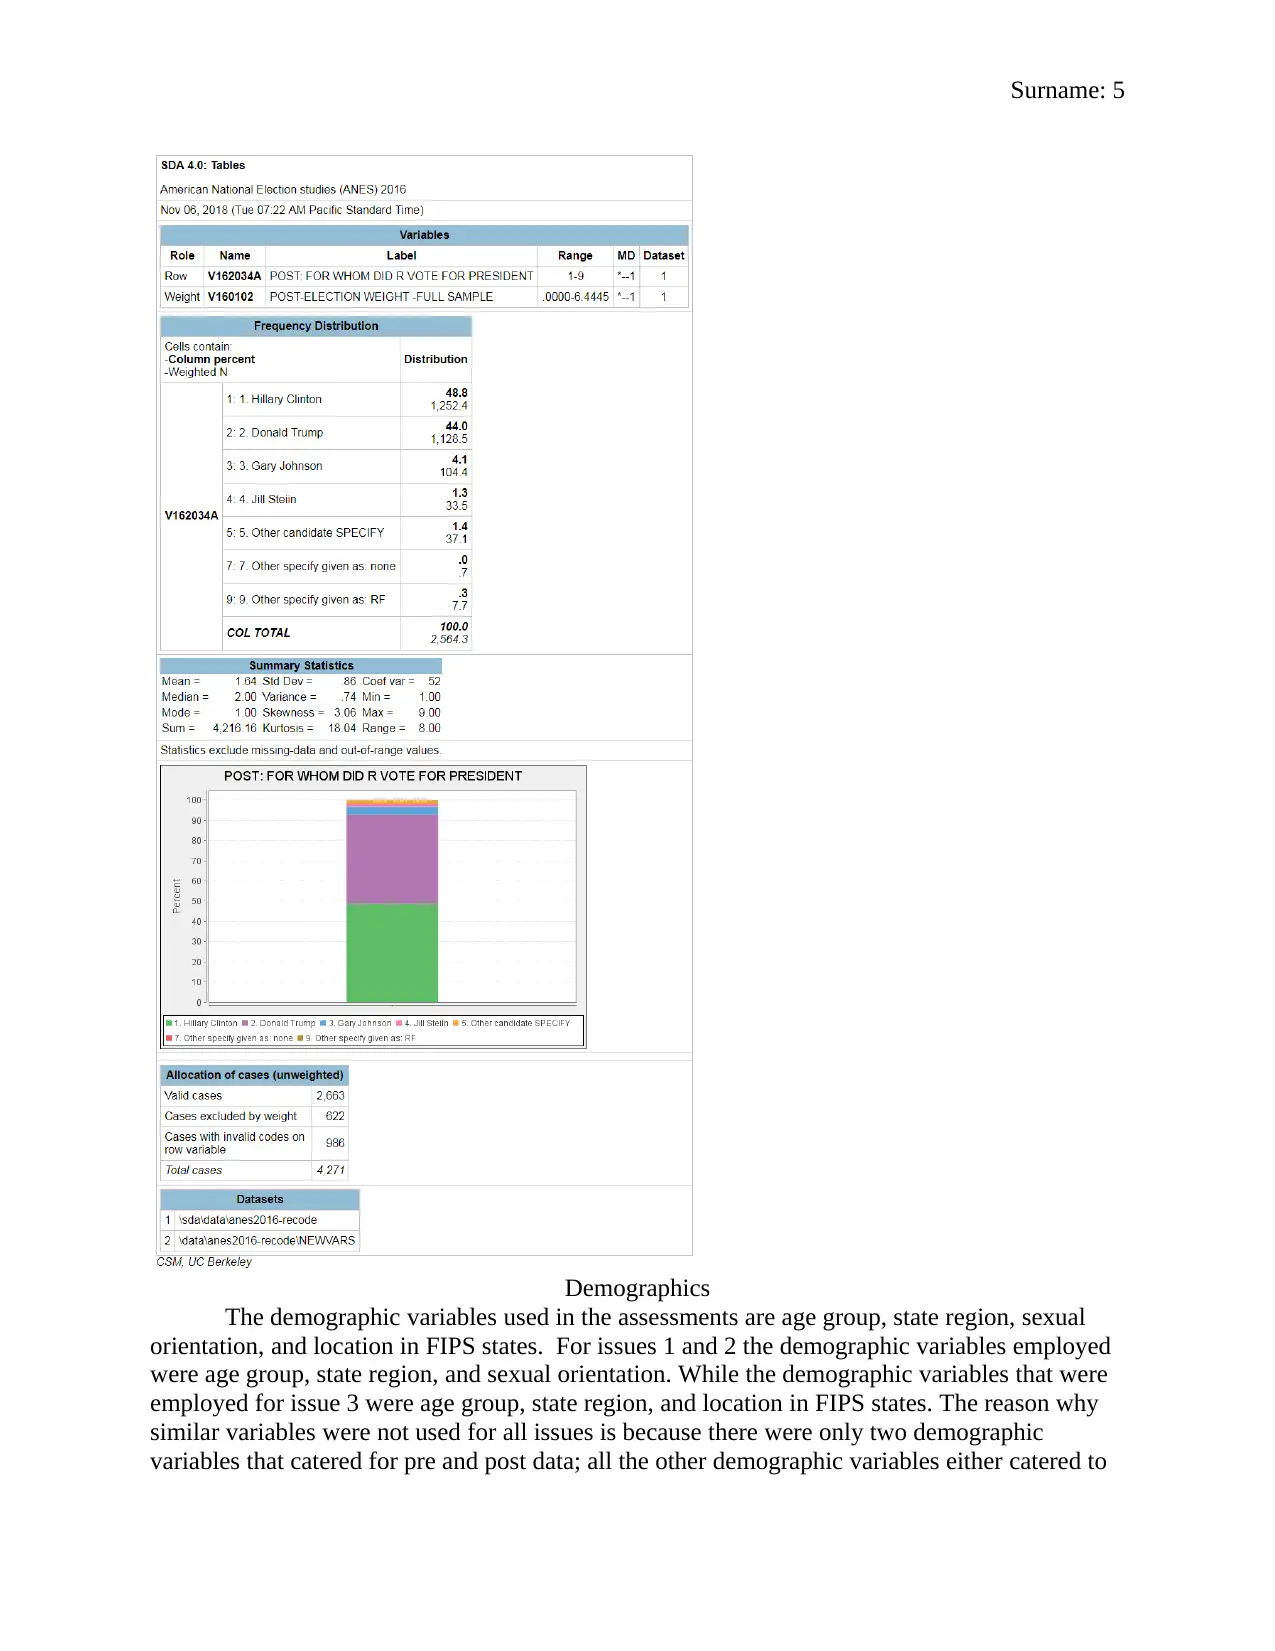
The third political opinion issue is with regard to whom the participant voted for
president in the 2016 election. This relates to interviewee data collected after the 2016 elections;
as such the individuals are presented with an array of responses that allows them to select the
choose that aligns to their presidential candidate. Some of the response options are tailored to
those interviewees who are unwilling to state who they voted for, or did not vote for a
presidential candidate. The variable id for this issue is V162034A and the accompanying post
ignored because they do not provide any helpful information when dealing with categorical
variables. The stacked bar chart does however provide a clear representation of people's
responses with regard to whether or not they voted for the president in 2012. The number of
valid cases or data values greatly outweighs the missing values or invalid figures making the
information presented above very credible. The results can also be synthesized to mean that
during the 2012 election 69.1% of all voters were aligned with the Democratic Party. Inferences
can be made from this information to forecast that a significant number of these supporters
would still voter under the Democratic Party umbrella during the 2016 election.
The third political opinion issue is with regard to whom the participant voted for
president in the 2016 election. This relates to interviewee data collected after the 2016 elections;
as such the individuals are presented with an array of responses that allows them to select the
choose that aligns to their presidential candidate. Some of the response options are tailored to
those interviewees who are unwilling to state who they voted for, or did not vote for a
presidential candidate. The variable id for this issue is V162034A and the accompanying post
⊘ This is a preview!⊘
Do you want full access?
Subscribe today to unlock all pages.
Trusted by 1+ million students worldwide
Surname: 4
election weight variable is V160102. The results indicate that a majority of respondents voted for
Hillary Clinton (48.8%); while, 44% of all interviewees voted for Donald Trump to be the next
president. The participants who voted for Gary Johnson were only 4.1% and those who opted for
Jill Steiin were 1.3%. 1.4% of the participants indicated they voted for other candidates who
were not specified in the questionnaire. 0.3% did not indicate who they voted for personal
reasons.
The response statistics do align with election results because the majority vote went to
Hillary Clinton but she however missed out on the Electoral College majority vote. None of the
participant interviewed after the 2016 election failed to vote for a presidential candidate; this
supported by the 0% on the number of people who failed to vote for any of the candidates.
Similar to the prior two issue assessments the summary statistics should be ignored because the
assessment variables are categorical. The column bar graph shows that the number of
participants who voted for Hillary and Trump were almost the same; since, there is no easy way
of telling the difference between the votes cast for each candidate just by looking at the chart.
The validity of the results is good and this is investigated by comparing the data used and
omitted i.e. the number of valid cases compared to cases that were excluded by weight and
invalid codes.
Paraphrase This Document
Need a fresh take? Get an instant paraphrase of this document with our AI Paraphraser
Surname: 5
Demographics
The demographic variables used in the assessments are age group, state region, sexual
orientation, and location in FIPS states. For issues 1 and 2 the demographic variables employed
were age group, state region, and sexual orientation. While the demographic variables that were
employed for issue 3 were age group, state region, and location in FIPS states. The reason why
similar variables were not used for all issues is because there were only two demographic
variables that catered for pre and post data; all the other demographic variables either catered to
Surname: 6
pre or post election data separately. We can therefore assess the distribution of the three issues
mentions earlier with regard to the demographic variables as follows:
Age Group
The behaviour of individuals with regard to political matters differs with age-groups. For
instance, the turnout during election events is normally higher amongst older generations. As
such, researchers believe that older people are more inclined to vote regardless of gender and
race. Variations in electoral process requirements and political stability do influence the voting
patterns within age groups(Richman, Chattha and Earnest). In spite of this the number of older
votes is always relatively higher than that of young individuals. Let's evaluate how age group as
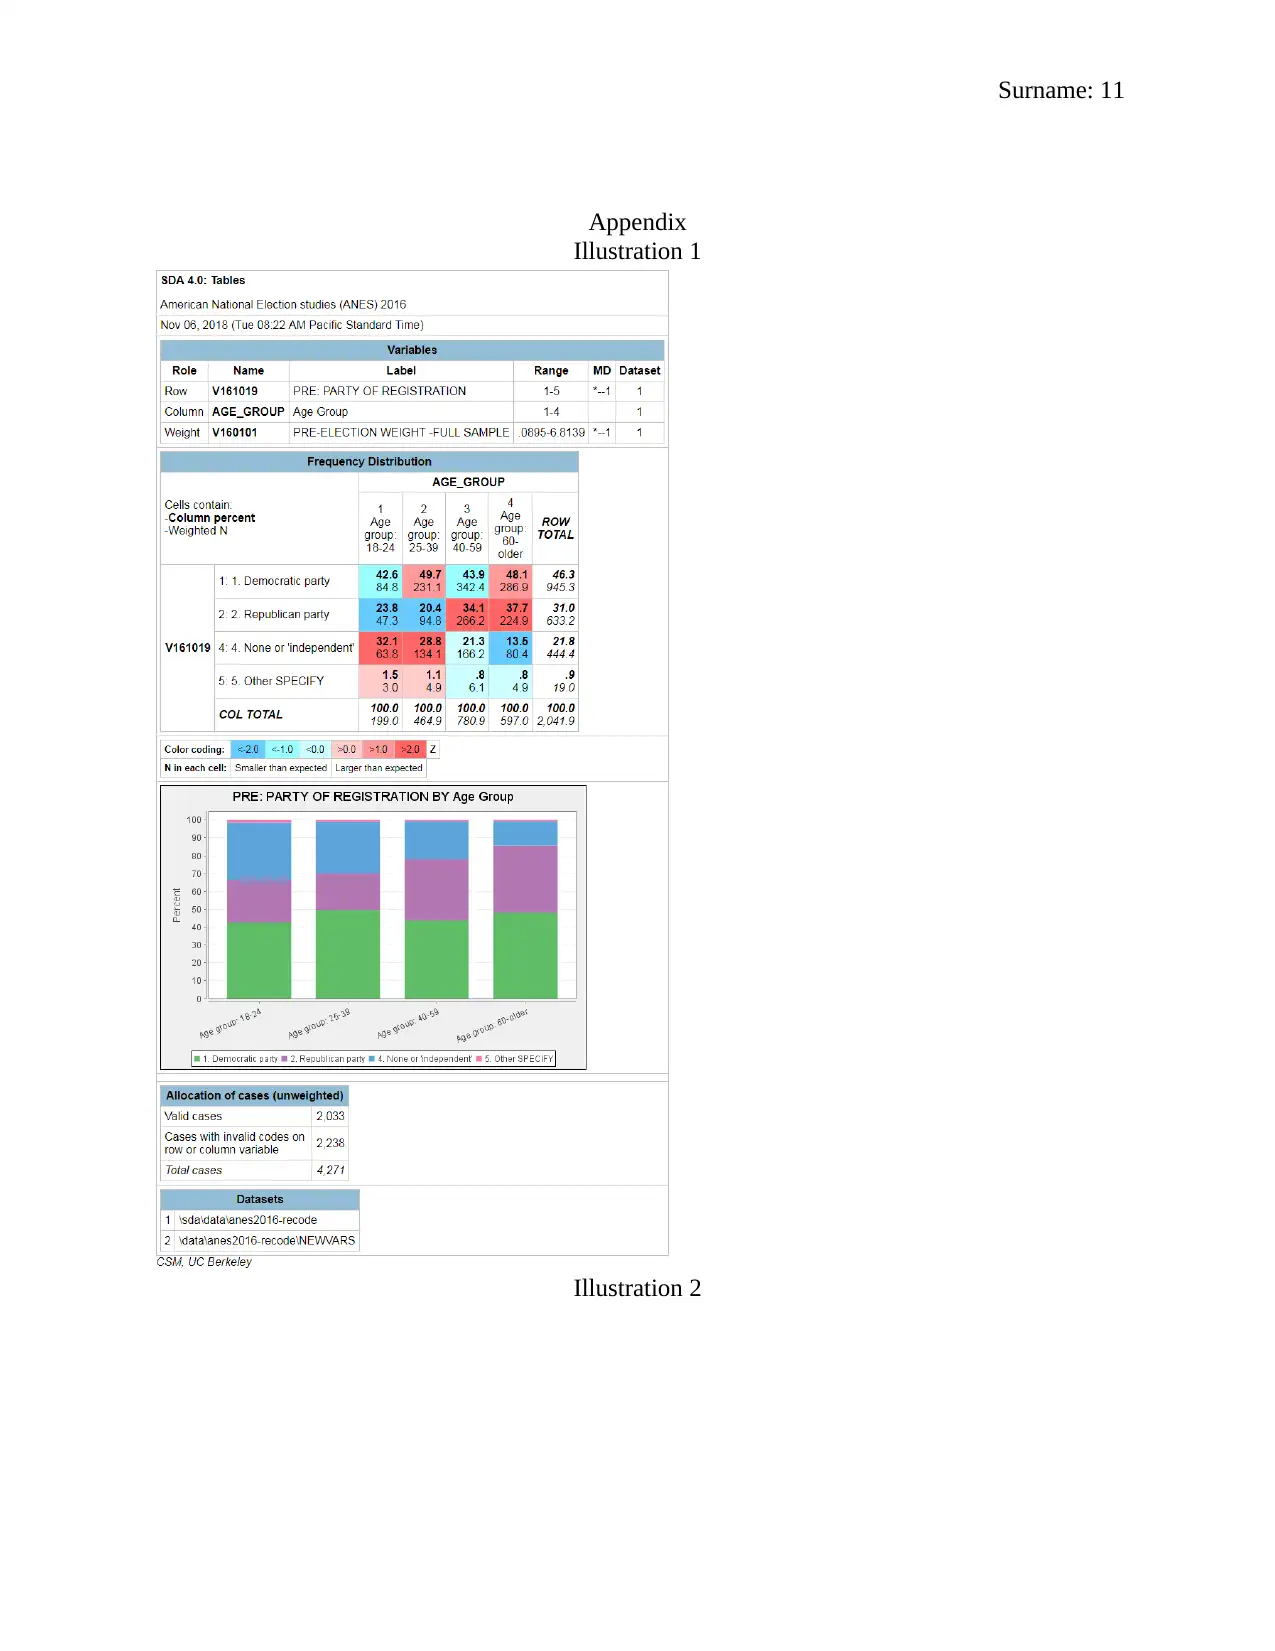
a control variable influences political issues 1, 2, and 3. Illustration 1 represents the party of
registration information for people in different age-groups. There are four age groups: 18-24; 25-
39; 40-59; 60-Older. For the frequency distribution table it is clear that Democrats are the
majority across all age groups. It is important to note that the young generation has a higher
preference for independence compared to being members of the Republican Party. While the
reverse is true for the older generation; there are more republicans than none party affiliated
individuals for age groups 40-59 and 60-Older. Illustration 2 indicates people who voted for
president in 2012 with regard to age groups.
From the frequency distribution table 75.7% of all individuals in the age group 18-24 did
not vote in the 2012 presidential elections. This could as a result of majority of them being
underage or not having an interest in political matters. For the other three age groups majority of
the participants voted. The level of participation in voting increases as the age of the participants
increases. As such, the highest level of participant in presidential voting with regard to age group
was amongst the individuals in the range of 60 or Older with 86.1%. Illustration 3 relates to who
the participants vote for president in 2016 elections with regard to age groups. According to the
results majority of the individuals in the age groups 18-24 and 25-39 voted for Hillary Clinton.
And the remaining 33.7% of the participants in these age groups voted for Donald Trump. An
almost equal number of participants in the age group 40-59 voted for Hillary Clinton and Donald
Trump. Majority of the interviewees in age-group 60-Older voted for Donald Trump however the
magnitude difference between those who vote for either Clinton or trump was relatively low at
5.6%. It is also important to note that a significant portion of respondents in the age group 25-39
voted for other candidates besides Hillary and Trump.
State region
It is well understood that state region has a significant influence on political affiliation.
This is because of societal pressure on which party they consider to be most beneficial to the
people of that region and the sense of pride that comes from have a presidential candidate from
their region(Gerber, Green and Larimer). As such, people feel more inclined to vote for a person
from their own State Region. Illustration 4 showcases the parties that interviewees registered
under, with regard to State regions. There are five state regions namely Northeast, Midwest,
South, West, and Pacific. From the tabulation results, majority of participants from the
Northeast, South, and Pacific are Democratic Party supporter; while those from the Midwest and
West regions are predominantly Republican Party supporters. Across all regions there are
healthy proportions of individuals who have no political party affiliations or consider themselves
independent. Illustration 5 demonstrates whether participants voted for president in 2012 or not
with homage to state region. The findings indicate that majority of all participants across all five
regions voted for president in 2012. The two regions with highest proportion of individuals who
voted for president are Northeast and Midwest. The two regions with the greatest number of
pre or post election data separately. We can therefore assess the distribution of the three issues
mentions earlier with regard to the demographic variables as follows:
Age Group
The behaviour of individuals with regard to political matters differs with age-groups. For
instance, the turnout during election events is normally higher amongst older generations. As
such, researchers believe that older people are more inclined to vote regardless of gender and
race. Variations in electoral process requirements and political stability do influence the voting
patterns within age groups(Richman, Chattha and Earnest). In spite of this the number of older
votes is always relatively higher than that of young individuals. Let's evaluate how age group as
a control variable influences political issues 1, 2, and 3. Illustration 1 represents the party of
registration information for people in different age-groups. There are four age groups: 18-24; 25-
39; 40-59; 60-Older. For the frequency distribution table it is clear that Democrats are the
majority across all age groups. It is important to note that the young generation has a higher
preference for independence compared to being members of the Republican Party. While the
reverse is true for the older generation; there are more republicans than none party affiliated
individuals for age groups 40-59 and 60-Older. Illustration 2 indicates people who voted for
president in 2012 with regard to age groups.
From the frequency distribution table 75.7% of all individuals in the age group 18-24 did
not vote in the 2012 presidential elections. This could as a result of majority of them being
underage or not having an interest in political matters. For the other three age groups majority of
the participants voted. The level of participation in voting increases as the age of the participants
increases. As such, the highest level of participant in presidential voting with regard to age group
was amongst the individuals in the range of 60 or Older with 86.1%. Illustration 3 relates to who
the participants vote for president in 2016 elections with regard to age groups. According to the
results majority of the individuals in the age groups 18-24 and 25-39 voted for Hillary Clinton.
And the remaining 33.7% of the participants in these age groups voted for Donald Trump. An
almost equal number of participants in the age group 40-59 voted for Hillary Clinton and Donald
Trump. Majority of the interviewees in age-group 60-Older voted for Donald Trump however the
magnitude difference between those who vote for either Clinton or trump was relatively low at
5.6%. It is also important to note that a significant portion of respondents in the age group 25-39
voted for other candidates besides Hillary and Trump.
State region
It is well understood that state region has a significant influence on political affiliation.
This is because of societal pressure on which party they consider to be most beneficial to the
people of that region and the sense of pride that comes from have a presidential candidate from
their region(Gerber, Green and Larimer). As such, people feel more inclined to vote for a person
from their own State Region. Illustration 4 showcases the parties that interviewees registered
under, with regard to State regions. There are five state regions namely Northeast, Midwest,
South, West, and Pacific. From the tabulation results, majority of participants from the
Northeast, South, and Pacific are Democratic Party supporter; while those from the Midwest and
West regions are predominantly Republican Party supporters. Across all regions there are
healthy proportions of individuals who have no political party affiliations or consider themselves
independent. Illustration 5 demonstrates whether participants voted for president in 2012 or not
with homage to state region. The findings indicate that majority of all participants across all five
regions voted for president in 2012. The two regions with highest proportion of individuals who
voted for president are Northeast and Midwest. The two regions with the greatest number of
⊘ This is a preview!⊘
Do you want full access?
Subscribe today to unlock all pages.
Trusted by 1+ million students worldwide
Surname: 7
participants who did not vote are South and West state regions. The stack bar graph provides a
clear representation of the voting decision of interviewees with regard to state regions.
Illustration 6 indicates whom participants voted for president in the 2016 election with focus on
state regions. Majority of the participants from Northeast and Pacific voted for Hillary. While, a
majority of participant from the Midwest, South and West voted for Donald Trump. Gary and Jill
got a considerable percentage of the votes cast in West and Pacific state regions respectively.
Northeast had the highest percentage of people who refused to reveal who they voted for in the
2016 presidential elections.
Sexual orientation
The participation of Straight and LGBT people in the election has been a topic of interest
for many people(Bellucci and Heath). According to voting records, more than 80% of LGBT
people participate in election; with only 45 to 50% of straight individuals taking part the
elections. Heterosexual individuals do constitute the majority of voters during election but their
voter turnout levels are significant low compared to those of LGBT members(Perez). Illustration
7 indicates the part registration information with regard to sexual orientation, Majority of
homosexual and bisexual individuals are democrats with a significant proportion of them having
no party affiliation Illustration8 indicate whether the participant voted for president in 2012.
Majority of all individuals across the three sexual orientation parameters voted for president in
the 2012 elections.
Location FIPS States
This variable only applies with regard to the person a participant voted for in 2016.
Looking at Illustration 9, it is evident there are states either Hillary or Donald dominated. For
example 92% of the votes cast in Washington DC went to Hillary Clinton and 100% of all votes
cast in Alaska went to Donald Trump. This means that these individuals had voter stronghold.
Donald seems to have more voter strongholds but the overall distribution indicates that he does
not have the overall support of the American people.
Part 2
Interview with a Hilary Clinton supporter
The great reason as to why the interviewee voted for Hillary Clinton was because of her
Christian values that transcend any of the party's modern conservative ideologies. Secondly, the
interviewee felt that Hillary was the better option simply because she was not in any shape or
form an extension of Donald Trump. Even thou Hillary Clinton has her own pitfalls; those of her
prime presidential rival Donald significantly outweighed her own in the eyes of the interviewee.
The interviewee has her reservations when it comes to Hillary especially with regard to abortion
and gay marriage. Hillary is a well know pro-choice and pro-gay marriage candidate and this did
not settle well with the interviewee considering she is a devoted Christian. As such, the
interviewee believes that marriage is a holy union that is only to be entered into between a man
and a woman. Secondly, the interviewee considers abortion and abomination before God and a
selfish act done to dispense away with parental responsibilities. With this in mind it seems that
the interview would have chosen to go with Donald Trump. However, due to the lack of respect
for non-Americans and women, the interviewee felt compelled to stick with Hillary.
In addition, as a middle-class income earner the interviewee felt that the tax changes
proposed by the Trump campaign leaders seemed to oppress the less fortunate and favour the
wealthy members of society. Moreover, Hillary is more qualified to be president compared to
Donald with regard to the two individual's personal experiences with politics and public affairs.
The interviewee feels that Clinton will be able to pick off where Obama left off and continue
Paraphrase This Document
Need a fresh take? Get an instant paraphrase of this document with our AI Paraphraser
Surname: 8
development and make amendments where necessary. The fact that Hillary has been in the
political scene ever since her husband Bill Clinton become president; indicates that she has an
informed idea of what it takes to be president. On the other hand, Trump proposes will greatly
undermine key development, healthcare, and international diplomacy incentives that were put in
place by the Obama administration. Lastly, the interviewee feels that Trump is a people pleaser
who enjoys idol worship and being cheered by American without internalizing the consequences
of his promises and actual work that needs to be put in for those ideas to become reality.
Interview with a Donald Trump Support
The interviewee feels that Donald trump is the driving force that United States of
America needs to realize economic growth and debt reduction. Moreover, the interviewee
believes that Donald Trump has the means, drive, and perseverance to reshape the country's
institutions, infrastructure, and economic situation. Hilary Clinton according to the interviewee is
capable individuals with years of achievement; but, the modern world demands a leader that is
dynamic and tested capable of making the necessary step to better the lives of all Americans.
There are some views shared by Donald Trump that the interviewee does not necessary agree
with. For instance, the interviewee agrees that the country needs to enforce border control and
mitigate immigration. He however does not agree with the way Donald Trump plans to go about.
The interviewee feels that with time the Trump government will device feasible solutions once
elected. Accordingly, the trump government will work towards the improvement of the earning
capability of low-class citizen through the development of numerous job platforms. To a fair
degree the interviewee indicated to a small extent he was voting for Trump simply because it was
what was expected of him by his family.
On the flipside of that coin, the fact that Hillary has been associated with major political
scandal hinders the interviewee from taking a liking to her ideas or development agendas.
Donald Trump's message of developing domestic industries by controlling international brands
in US markets is chief amongst the reasons the interviewee considers Trump to be the right
leader. Most people are optimistic that the country's economy will recover as soon as person with
business success and experience takes over administration. This opinion is also shared by the
interviewee, who describes the current debt crisis as a child of excess borrowing and poor
investment. The interviewee expressed that he is an observant Seventh Day Adventist; and as
such, he will not condone gay-marriage and abortion. As such, he choose to align himself with
Donald Trump on matters of same-sex marriages and termination of unwanted pregnancies.
Nevertheless, the interviewee confessed that voting for Donald Trump was championing for the
lesser "evil" indicating that he was neither fond of Hillary nor Trump.
Reasons Why Trump won the election
The main reason why Trump won the election was because he got the majority vote in the
Electoral College. In spite of the fact that Trump lost the popular vote to Hillary Clinton he got
the US presidency because he won the votes of the Electoral College(Abutu and Abubakar). In
fact, Donald won 306 of the 582 Electoral College votes this means according to the US
constitution the decision of the Electoral College trumps that of the popular vote; thus making
Donald Trump the president of the United States of America. The electoral votes and turnout in
the states of Wisconsin, Michigan, and Pennsylvania completely sealed Hillary's fate as 80% of
the support was offered to Donald Trump. Another reason that saw Donald Trump win was the
cross party voting of US citizens. According to reports released by ANES, More registered
Democrats voted for Trump compared to the number of registered Republicans who voted for
Surname: 9
Hillary. As the Democrat supporters shifted camp they allowed for Donald Trump to get more
votes than Hillary especially in states like Wisconsin(Abutu and Abubakar).
Hillary. As the Democrat supporters shifted camp they allowed for Donald Trump to get more
votes than Hillary especially in states like Wisconsin(Abutu and Abubakar).
⊘ This is a preview!⊘
Do you want full access?
Subscribe today to unlock all pages.
Trusted by 1+ million students worldwide
Surname: 10
References
Abutu, Odoh Patrick and Salisu Abubakar. "2016 United States of America’spresidential
Election: Reasons Why Donald Trump Won." IOSR Journal of Research & Method in Education
VII.2 (2017): 80-90.
Ansolabehere, Stephen and Eitan Hersh. "Gender, Race, Age and Voting: A Research Note."
Politics and Governance I.2 (2013): 1-6.
Bellucci, Paolo and Oliver Heath. "The Structure of Party-Organization Linkages and the
Electoral Strength of Cleavages in Italy, 1963–2008." Centre for the Study of Political Change
(2016): 1-53.
Gerber, Alan S., Donald P. Green and Christopher W. Larimer. "Social Pressure and Voter
Turnout: Evidence from a Large-Scale Field Experiment." American Political Science Review
CII.1 (2008).
Goerres, Achim. "Why are Older People More Likely to Vote? The Impact of Ageing on
Electoral Turnout in Europe." BJPIR 9 (2008): 90–121.
Perez, Vanessa M. "Political Participation of LGBT Americans." Project Vote: Research Memo
(2014): 1-12.
Richman, Jesse T., Gulshan A. Chattha and David C. Earnest. "Do non-citizens vote in U.S.
elections?" Electoral Studies (2014): 149-157.
Paraphrase This Document
Need a fresh take? Get an instant paraphrase of this document with our AI Paraphraser
Surname: 11
Appendix
Illustration 1
Illustration 2
Appendix
Illustration 1
Illustration 2

Surname: 12
Illustration 3
Illustration 3
⊘ This is a preview!⊘
Do you want full access?
Subscribe today to unlock all pages.
Trusted by 1+ million students worldwide
1 out of 19


Your All-in-One AI-Powered Toolkit for Academic Success.
+13062052269
info@desklib.com
Available 24*7 on WhatsApp / Email
![[object Object]](/_next/static/media/star-bottom.7253800d.svg)
Unlock your academic potential
Copyright © 2020–2026 A2Z Services. All Rights Reserved. Developed and managed by ZUCOL.