Assessment of Companies Listed on ASX with Sector Area and Financial Information
Added on 2022-11-01
18 Pages3489 Words444 Views
Surname: 1
FIN10002: Financial Statistics
Name
The Name of the Class (Course)
Professor (Tutor)
The Name of the School (University)
The City and State where it is located
Date
FIN10002: Financial Statistics
Name
The Name of the Class (Course)
Professor (Tutor)
The Name of the School (University)
The City and State where it is located
Date

Surname: 2
Executive Summary
The research was focused on assessing the companies listed on the ASX with their sector area
and financial information. It was established that most of the companies listed on the ASX
were from the material sector, although about 52.00% were either suspended or delisted. All
the continuous variables in the sample data were highly positively skewed. The analysis
indicated that the sample data used could not estimate the population parameter for the total
asset for all companies that are trading. However, the sample could
estimate the population parameter for the total revenue for the GICS
sector of material only. It was found that total revenue for financial (GICS) is not
more than the average total revenue for Health Care (GICS) and the average market
capitalization, for financial and materials, did not differ. Lastly, it was found that
there a significant relationship between net profit after tax and total assets.
Surname: 3
Introduction
In this study, the focus was on assessing the companies listed on the ASX with their sector
area and financial information. The main objective was to determine the distribution of the
data. Both descriptive statistics and plots will be used to illustrate how the variables were
distributed. For the nominal variables, pie chart and bar plots will be used. A histogram will
be used to show the distribution of the continuous variables (Lowry, 2014). The independent
sample t-test will be carried out to determine whether the mean difference between two
groups is different. Lastly, a regression model will be fitted to determine whether there exists
a significant relationship between net profit after tax and total assets.
To achieve this, the sample data of companies listed on the ASX (n = 50) was used. A simple
random process was used to select a random sample size 50 of customers from the 1536
companies in the Major Assignment Data Company Profits file. The sample data are located
in .
Analysis
Using this sample data, we carry out data analysis as follows:
Descriptive analysis
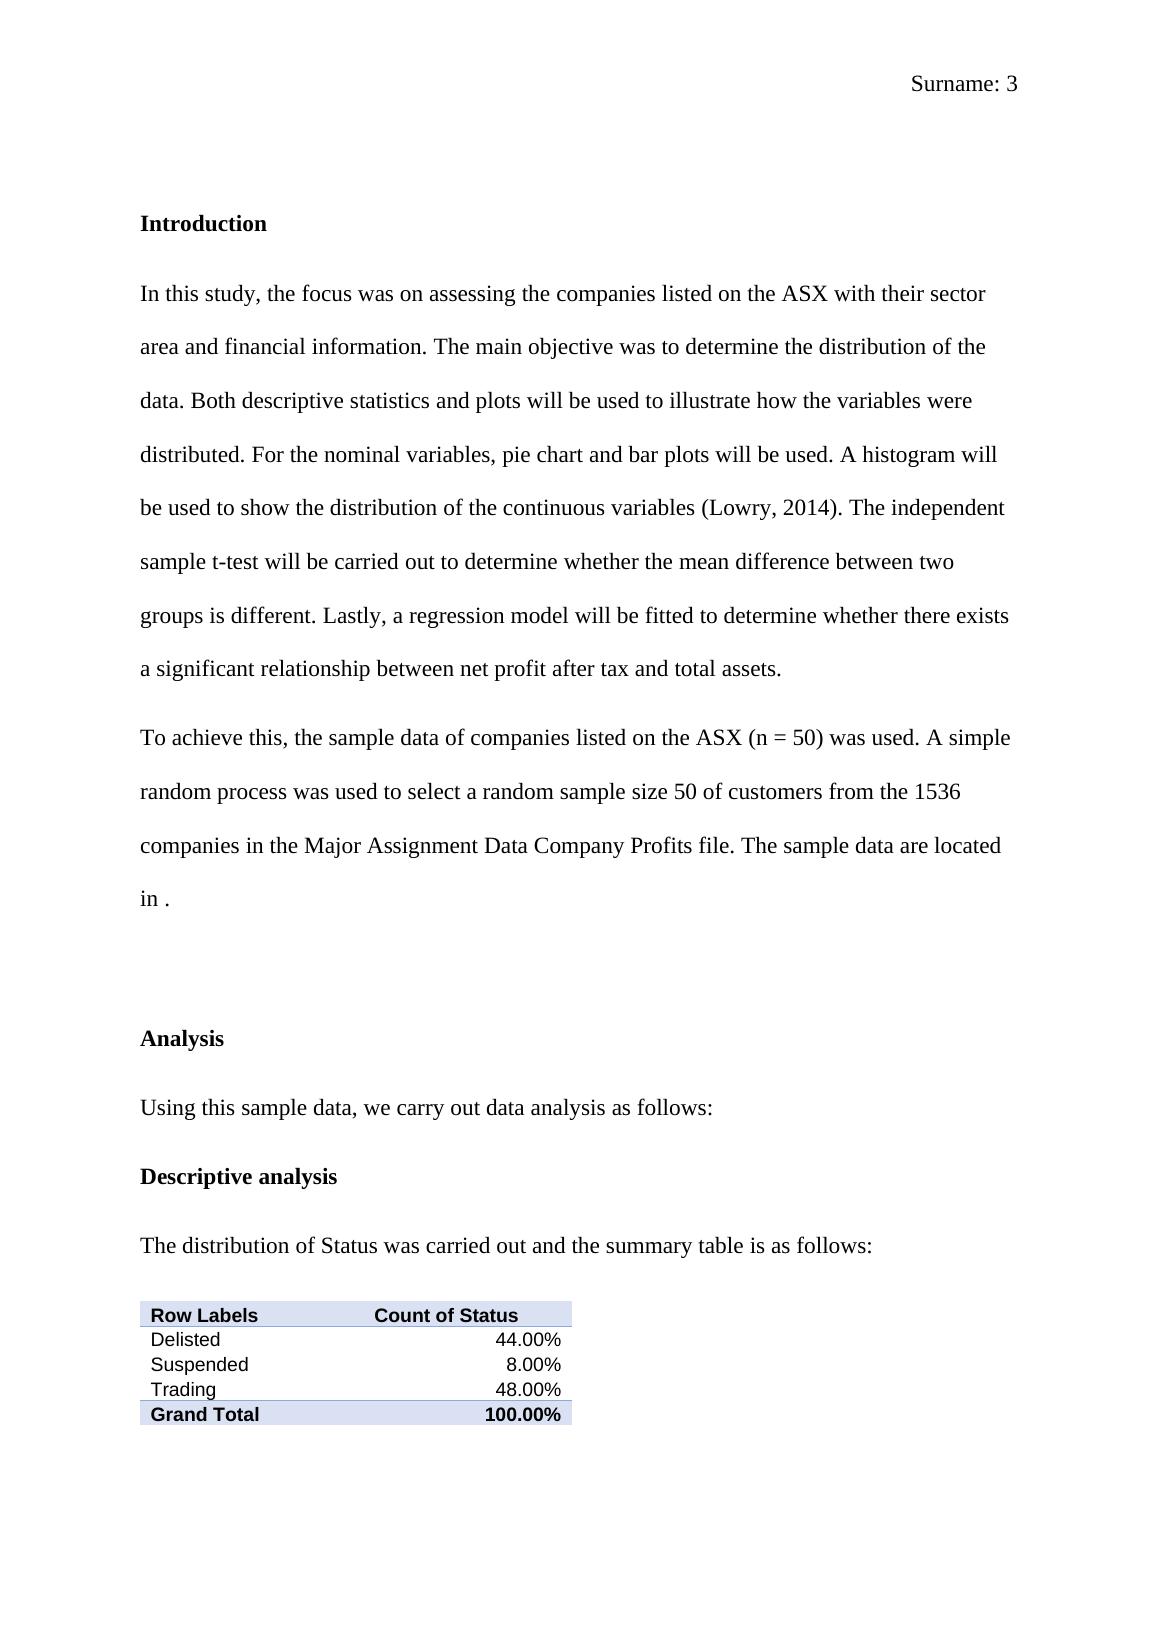
The distribution of Status was carried out and the summary table is as follows:
Row Labels Count of Status
Delisted 44.00%
Suspended 8.00%
Trading 48.00%
Grand Total 100.00%
Introduction
In this study, the focus was on assessing the companies listed on the ASX with their sector
area and financial information. The main objective was to determine the distribution of the
data. Both descriptive statistics and plots will be used to illustrate how the variables were
distributed. For the nominal variables, pie chart and bar plots will be used. A histogram will
be used to show the distribution of the continuous variables (Lowry, 2014). The independent
sample t-test will be carried out to determine whether the mean difference between two
groups is different. Lastly, a regression model will be fitted to determine whether there exists
a significant relationship between net profit after tax and total assets.
To achieve this, the sample data of companies listed on the ASX (n = 50) was used. A simple
random process was used to select a random sample size 50 of customers from the 1536
companies in the Major Assignment Data Company Profits file. The sample data are located
in .
Analysis
Using this sample data, we carry out data analysis as follows:
Descriptive analysis
The distribution of Status was carried out and the summary table is as follows:
Row Labels Count of Status
Delisted 44.00%
Suspended 8.00%
Trading 48.00%
Grand Total 100.00%
Surname: 4
Deliste
d
44.00
%
Suspe
nded
8.00%
Tradin
g
48.00
%
Status Distibution
Delisted
Suspended
Trading
The summary shows that 48.00% of the companies in the data are currently trading, 8.00%
are suspended and 44.00% are delisted (Ott & Longnecker, 2015).
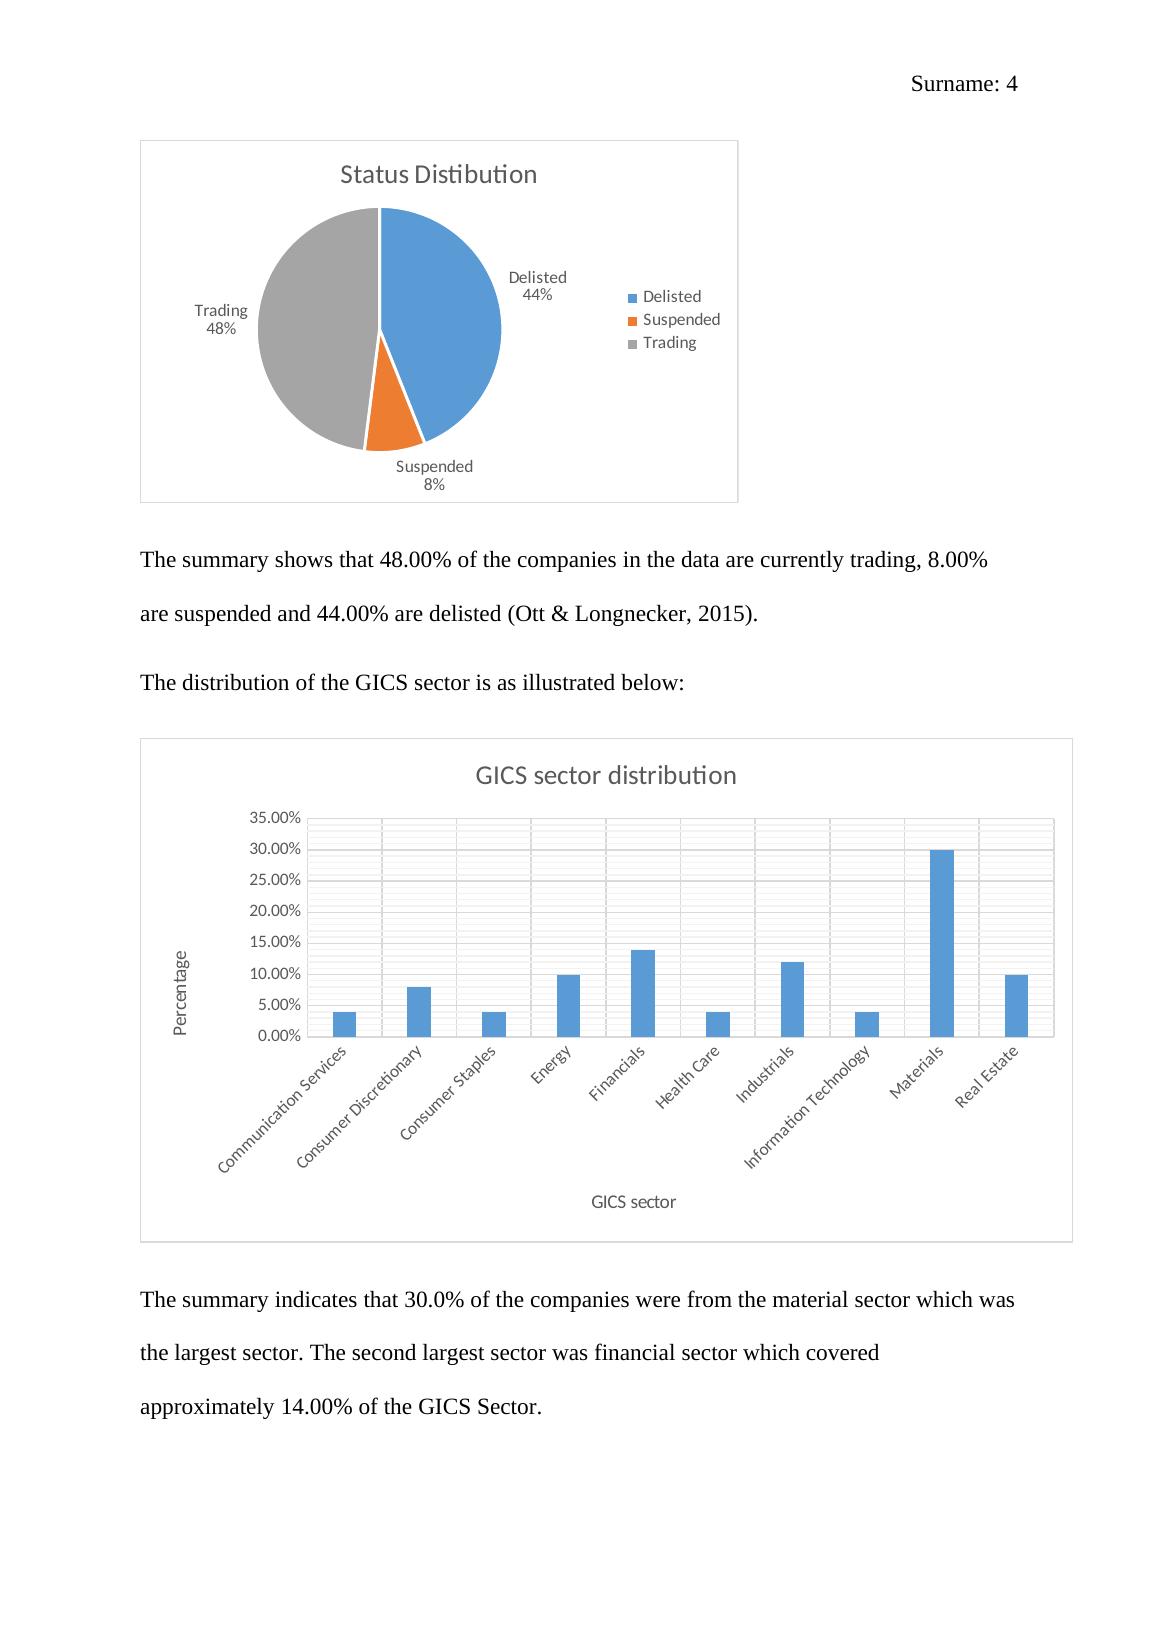
The distribution of the GICS sector is as illustrated below:
Communication Services
Consumer Discretionary
Consumer Staples
Energy
Financials
Health Care
Industrials
Information Technology
Materials
Real Estate
0.00%
5.00%
10.00%
15.00%
20.00%
25.00%
30.00%
35.00%
GICS sector distribution
GICS sector
Percentage
The summary indicates that 30.0% of the companies were from the material sector which was
the largest sector. The second largest sector was financial sector which covered
approximately 14.00% of the GICS Sector.
Deliste
d
44.00
%
Suspe
nded
8.00%
Tradin
g
48.00
%
Status Distibution
Delisted
Suspended
Trading
The summary shows that 48.00% of the companies in the data are currently trading, 8.00%
are suspended and 44.00% are delisted (Ott & Longnecker, 2015).
The distribution of the GICS sector is as illustrated below:
Communication Services
Consumer Discretionary
Consumer Staples
Energy
Financials
Health Care
Industrials
Information Technology
Materials
Real Estate
0.00%
5.00%
10.00%
15.00%
20.00%
25.00%
30.00%
35.00%
GICS sector distribution
GICS sector
Percentage
The summary indicates that 30.0% of the companies were from the material sector which was
the largest sector. The second largest sector was financial sector which covered
approximately 14.00% of the GICS Sector.
End of preview
Want to access all the pages? Upload your documents or become a member.
Related Documents
Case Study on ABC Learning Collapselg...
|16
|3209
|344
Working Capital Management and its Impact on Profitability: Evidence from ASX listed Construction Firmslg...
|18
|4777
|378
Board Diversity: Impact on Company Performance in Stock Market Returns and ROAlg...
|10
|1783
|477