Demand and Supply of French and Australian Wines
VerifiedAdded on 2022/10/17
|10
|1692
|385
AI Summary
This article discusses the impact of demand and supply on the market for French and Australian wines due to little harvest and poor grape harvest respectively. It also explains the law of demand and supply and the concept of elastic and inelastic demand.
Contribute Materials
Your contribution can guide someone’s learning journey. Share your
documents today.
Surname 1
Name
Professor
Institution
Course
Date
1) The market for the French wines is influenced by the forces of demand and supply.
The law of demand and supply explains the relationship between seller of a given
commodity and the buyer of the commodity .The relationship shows how the availability
Name
Professor
Institution
Course
Date
1) The market for the French wines is influenced by the forces of demand and supply.
The law of demand and supply explains the relationship between seller of a given
commodity and the buyer of the commodity .The relationship shows how the availability
Secure Best Marks with AI Grader
Need help grading? Try our AI Grader for instant feedback on your assignments.
Surname 2
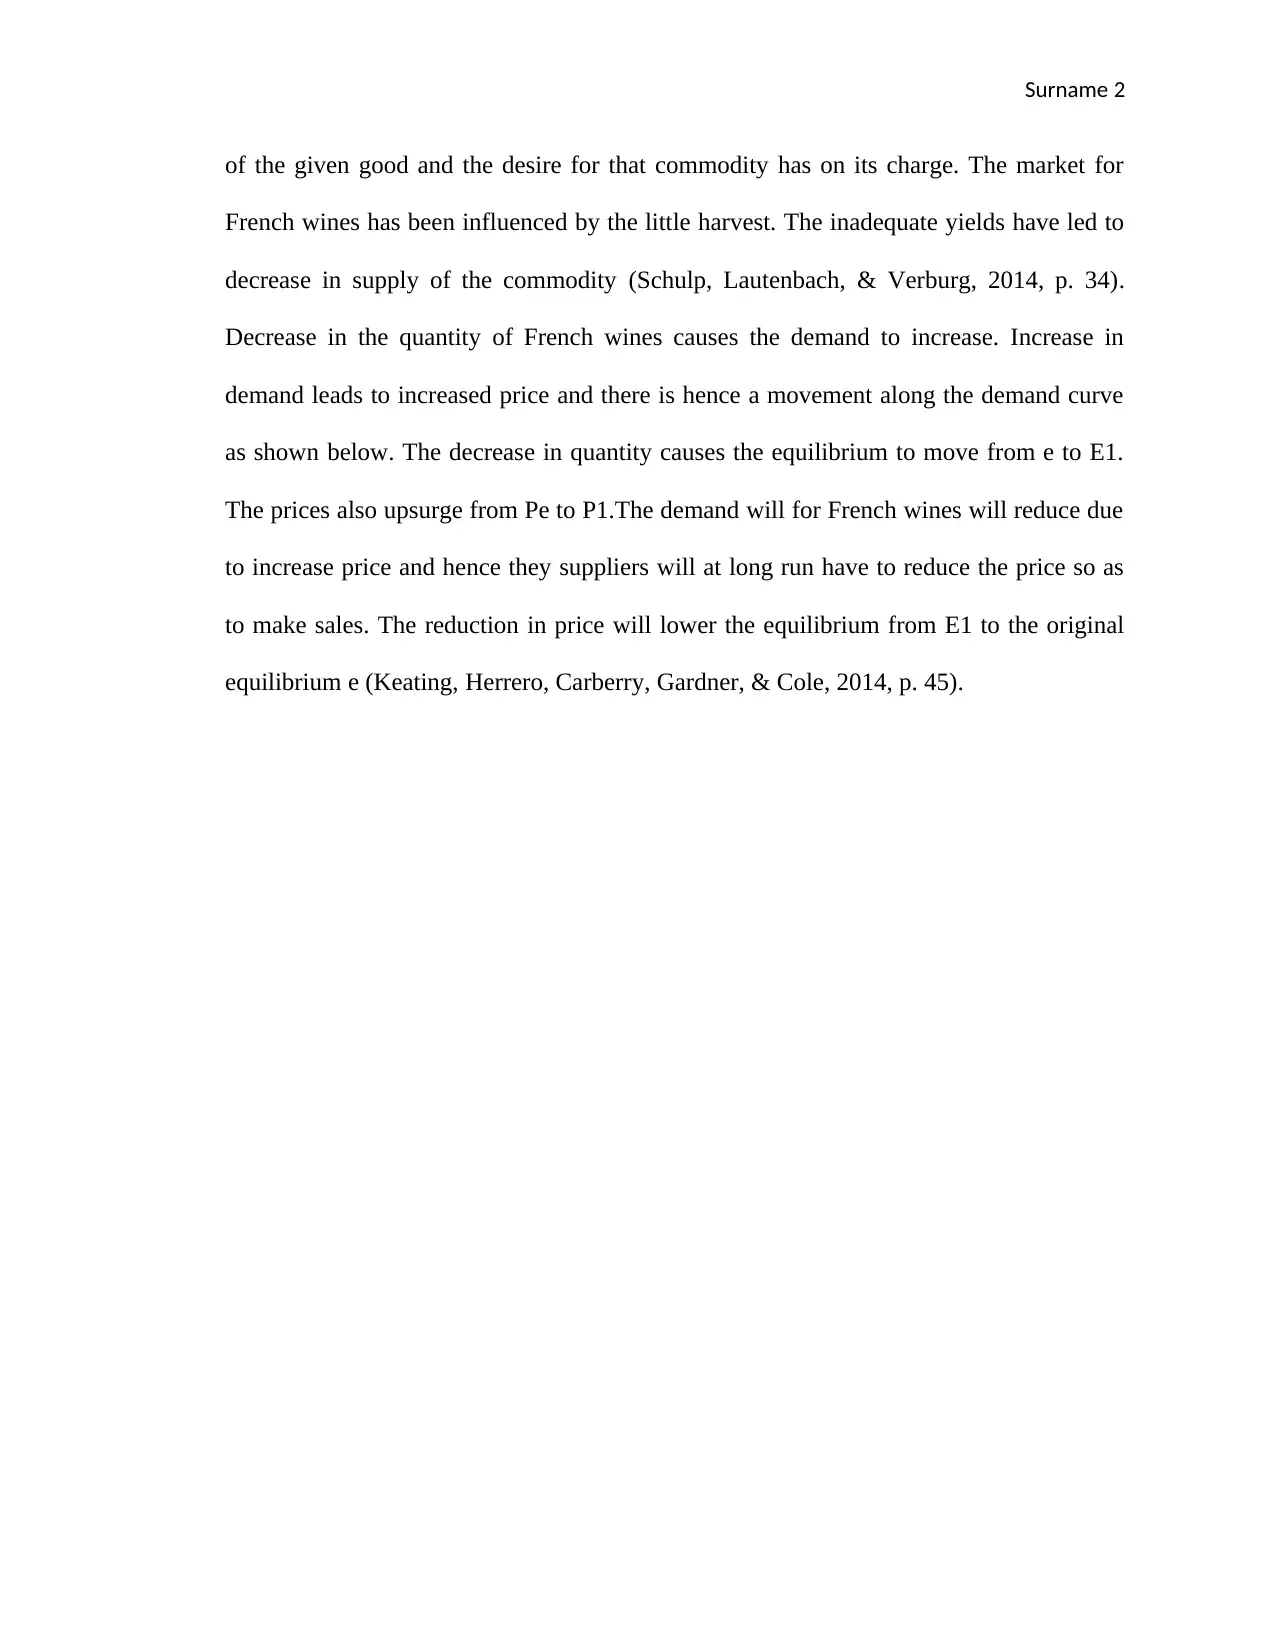
of the given good and the desire for that commodity has on its charge. The market for
French wines has been influenced by the little harvest. The inadequate yields have led to
decrease in supply of the commodity (Schulp, Lautenbach, & Verburg, 2014, p. 34).
Decrease in the quantity of French wines causes the demand to increase. Increase in
demand leads to increased price and there is hence a movement along the demand curve
as shown below. The decrease in quantity causes the equilibrium to move from e to E1.
The prices also upsurge from Pe to P1.The demand will for French wines will reduce due
to increase price and hence they suppliers will at long run have to reduce the price so as
to make sales. The reduction in price will lower the equilibrium from E1 to the original
equilibrium e (Keating, Herrero, Carberry, Gardner, & Cole, 2014, p. 45).
Surname 3
Price
Supply
Supply
Movement along
P1 E1
Pe equilibrium e
Demand
Quantity
Q1 Qe
b) The decrease in the quantity of a commodity supplied leads to a change in the
equilibrium price. A decrease in supply leads to excess demand at the initial price. Due to poor
harvest of the wine grapes, the price for the Australian wines has increased. The increase in the
price for Australian Wine caused the equilibrium to move from E to E1 as depicted in the above
diagram (Azevedo, et al., 2016, p. 56).
Surname 4
Question 2
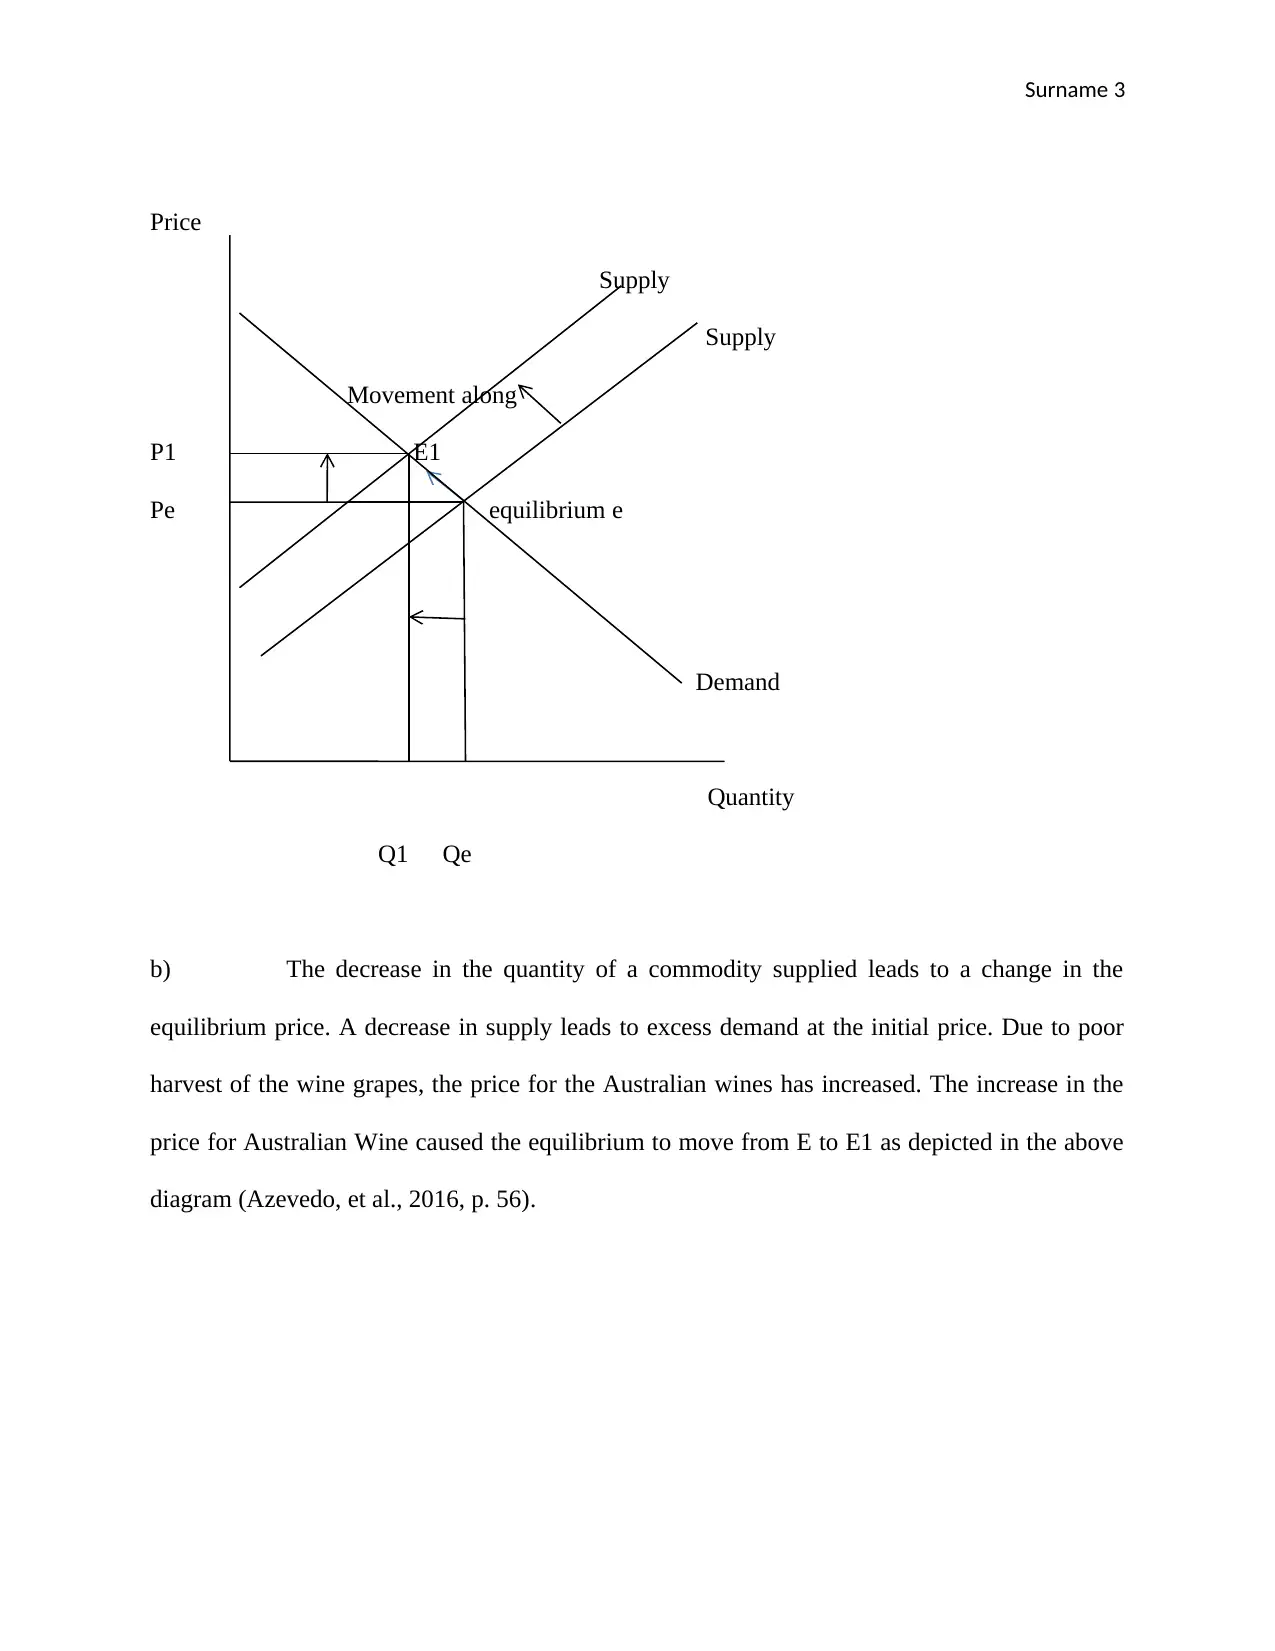
The law of supply states that the amount of a commodity that is supplied by the owners or
suppliers rise as the market prices increase and falls as the prices decrease. The law demand
states that the quantity of a commodity that is demanded declines when the price upsurges and
increases when the prices declines (Gligor, 2014, p. 67). The increase in sales for ipods with the
increase in prices therefore violates the law of demand and supply.
(Gligor, 2014, p. 56).
The diagram shown above can be used to explain the law of demand and supply.in the
diagram, the consumers are willing to purchase more if the prices fall. For every price set by the
market or by the suppliers, there is some quantity demanded which increases with decrease in
price and vice versa (Okyay, Karaesmen, & Özekici, 2014, p. 57).
Question 2
The law of supply states that the amount of a commodity that is supplied by the owners or
suppliers rise as the market prices increase and falls as the prices decrease. The law demand
states that the quantity of a commodity that is demanded declines when the price upsurges and
increases when the prices declines (Gligor, 2014, p. 67). The increase in sales for ipods with the
increase in prices therefore violates the law of demand and supply.
(Gligor, 2014, p. 56).
The diagram shown above can be used to explain the law of demand and supply.in the
diagram, the consumers are willing to purchase more if the prices fall. For every price set by the
market or by the suppliers, there is some quantity demanded which increases with decrease in
price and vice versa (Okyay, Karaesmen, & Özekici, 2014, p. 57).
Secure Best Marks with AI Grader
Need help grading? Try our AI Grader for instant feedback on your assignments.
Surname 5
Question 3
A simultaneous decrease in the preparedness and the proficiency of buyers to purchase a
given commodity at and current price is indicated by a shift to the left in the demand curve. The
enthusiasm of and aptitude of the vendors to sell their product at the present price in the market
is illustrated by a shift of the supply curve to the left (Gligor, 2014, p. 76). The amalgamation of
the entire shifts lead to decline in the equilibrium amount and the change in the equilibrium price
is in determinant.
On the demand side, supposing that the number of homeowners increase, the number of
tenants will decrease in the market for the new commercial apartments. The latter will activate
the number of purchasers demand determinant, reduction in demand and consequently lead to a
shift in demand curve to the left side (Okyay, Karaesmen, & Özekici, 2014, p. 78).
On the supply side, suppose that the sellers anticipate a possible increase in the prices of
commercial apartments in the market. The commercial apartment suppliers will stop supplying
the commercial apartments for some time and opt to wait for the future anticipated increase in
prices. Generally, the later will lead to the activation of the sellers expectations supply
determinant, decrease in supply and therefore the supply curve will shift upwards to the left
(Okyay, Karaesmen, & Özekici, 2014, p. 79). A decrease in the quantity demanded and quantity
supplied will lead to a decrease in the equilibrium quantity. The demand shift will cause a
decrease in the prices and the supply shift causes an increase in the price level.
Surname 6
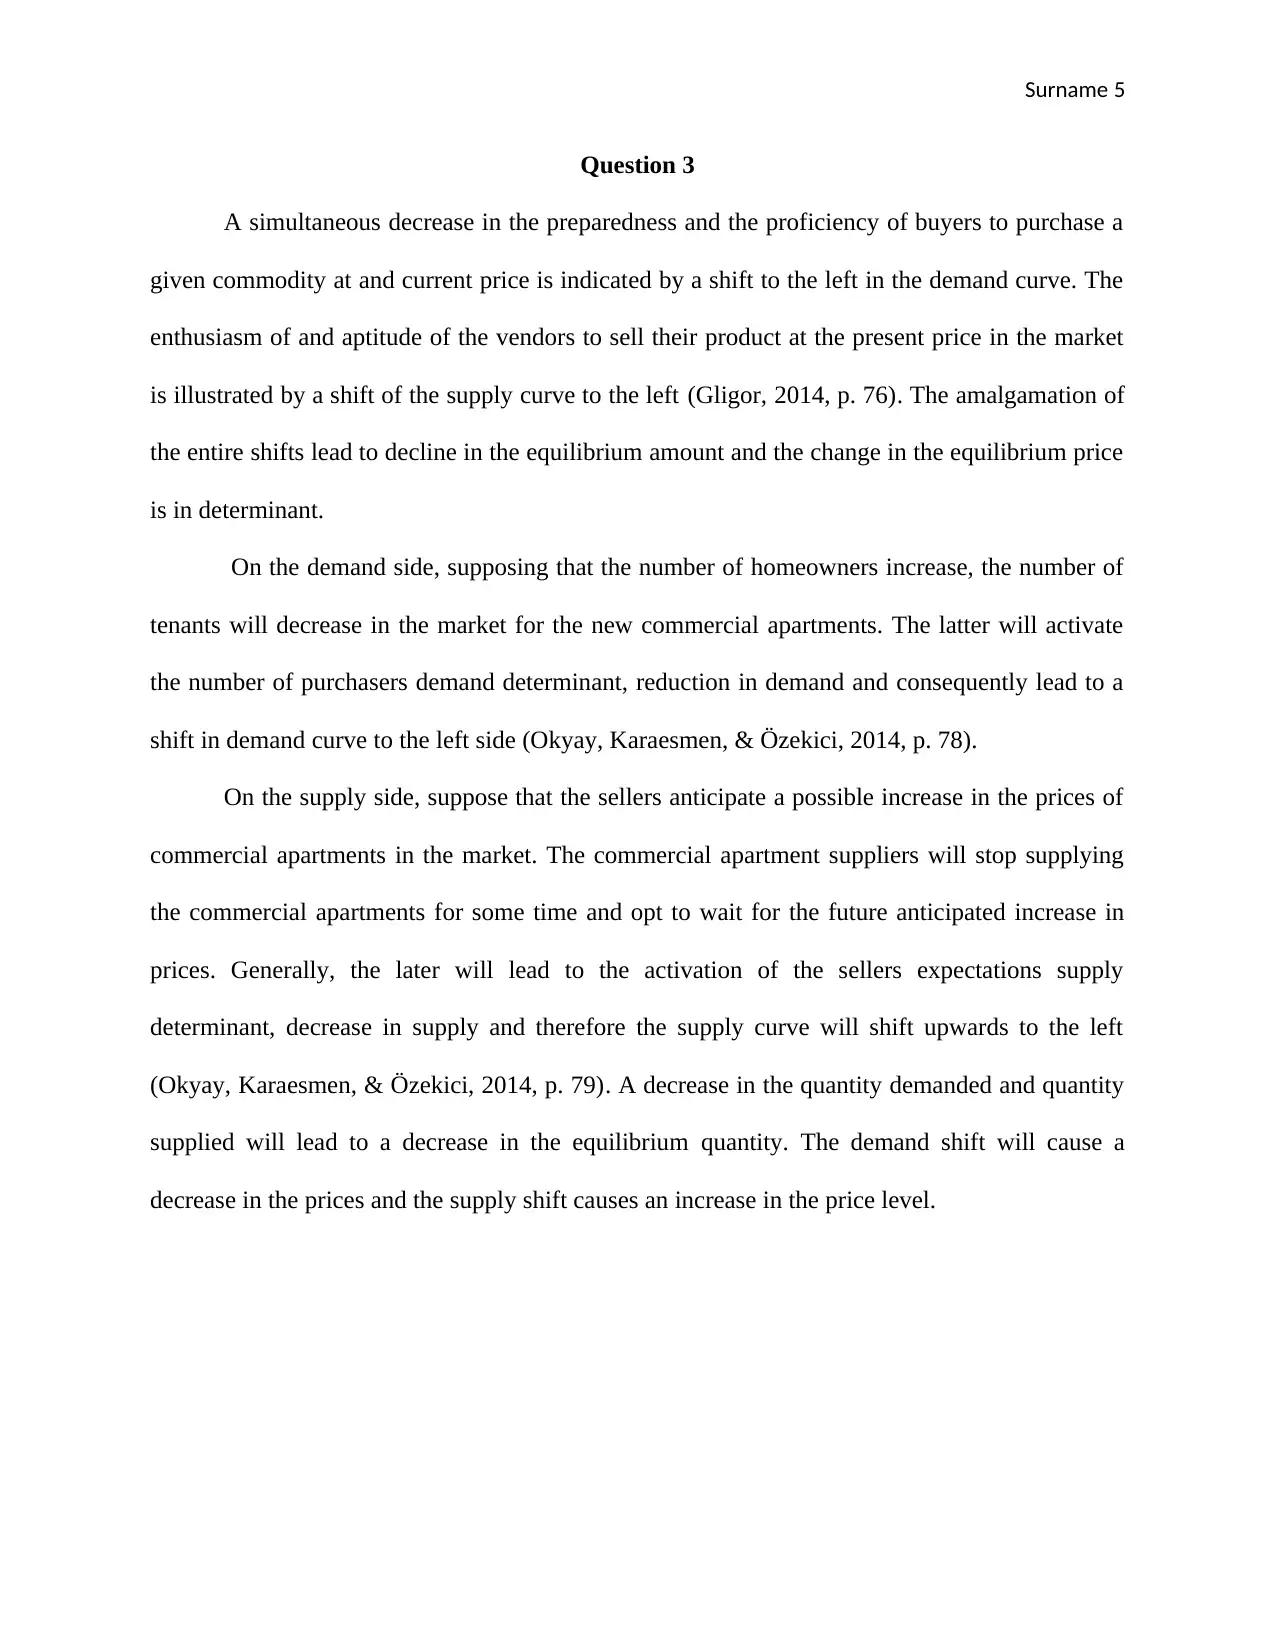
(Gligor, 2014, p. 112).
The above table shows the two curves and the initial equilibrium. The initial equilibrium is
Po for price and Qo for Quantity. The equilibrium is at point Qe. After the changes discussed
above, the new equilibrium becomes;
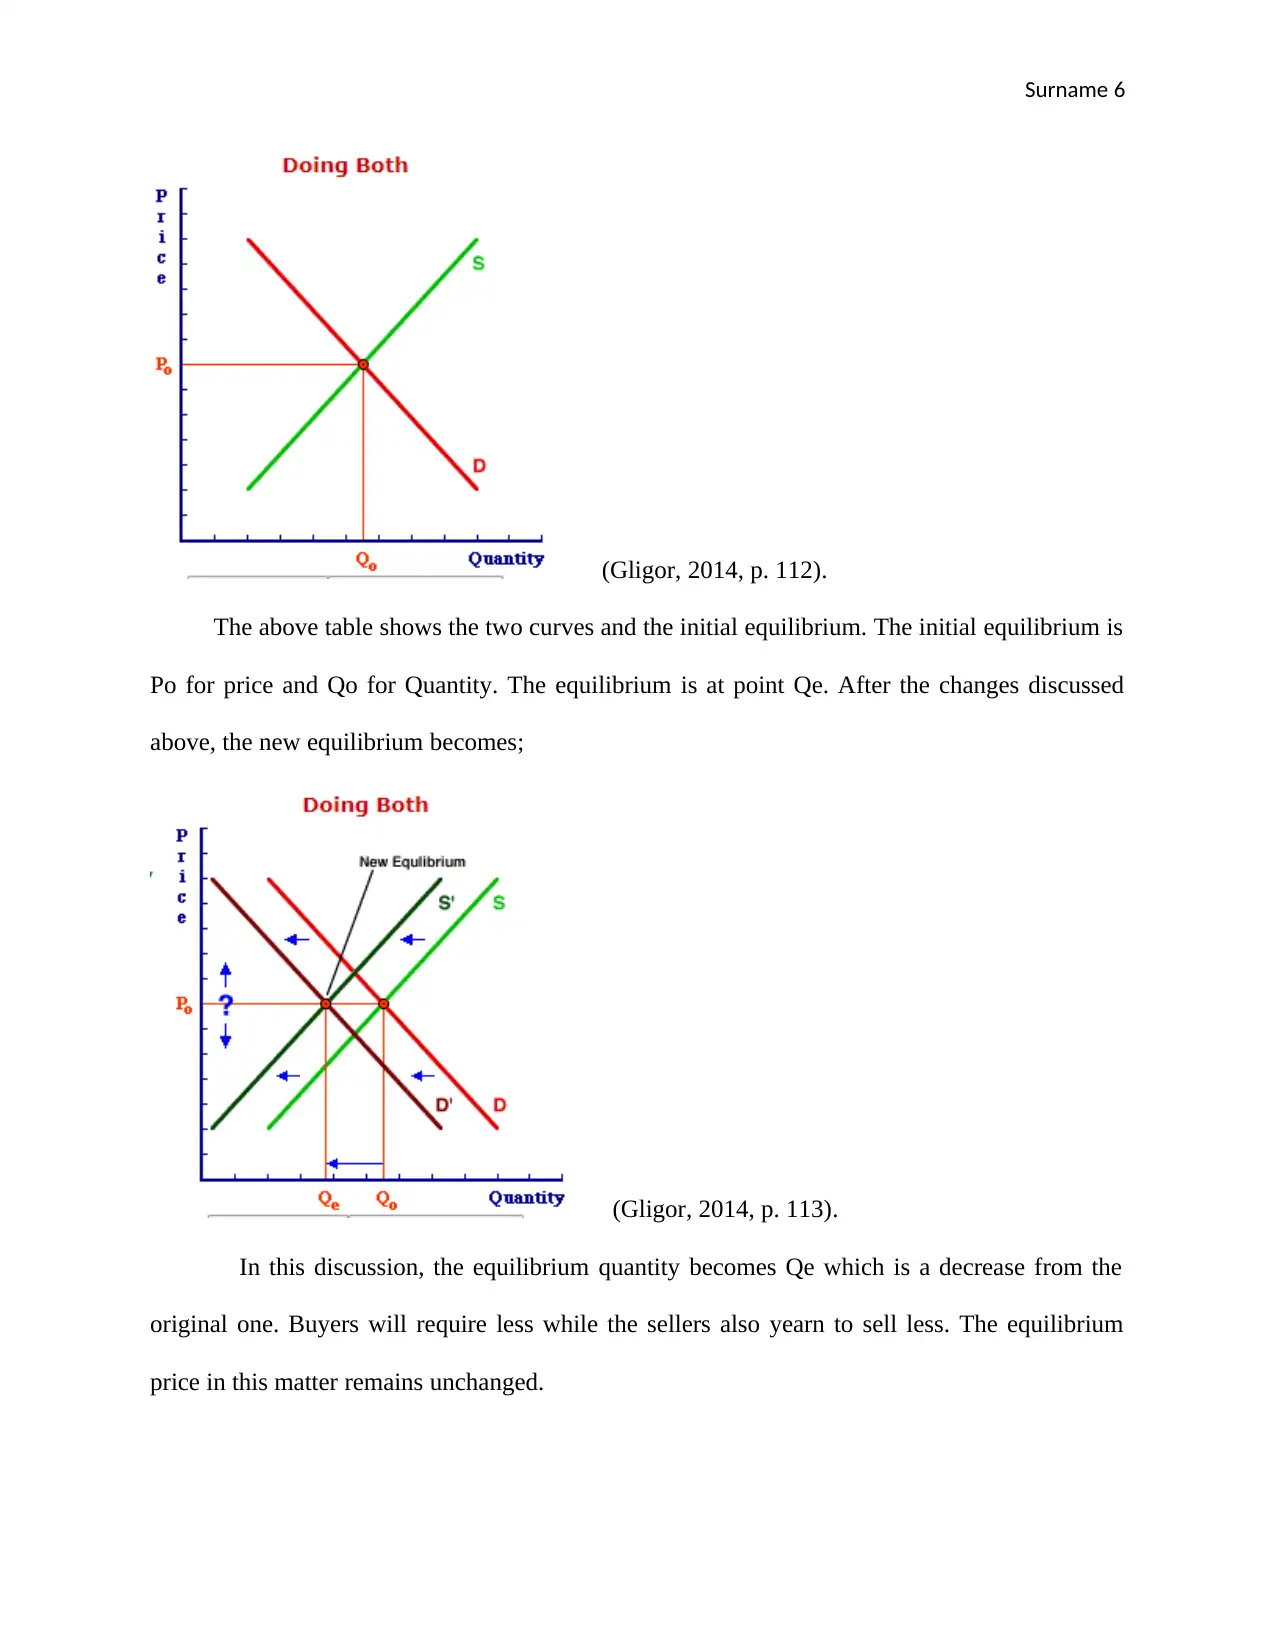
(Gligor, 2014, p. 113).
In this discussion, the equilibrium quantity becomes Qe which is a decrease from the
original one. Buyers will require less while the sellers also yearn to sell less. The equilibrium
price in this matter remains unchanged.
(Gligor, 2014, p. 112).
The above table shows the two curves and the initial equilibrium. The initial equilibrium is
Po for price and Qo for Quantity. The equilibrium is at point Qe. After the changes discussed
above, the new equilibrium becomes;
(Gligor, 2014, p. 113).
In this discussion, the equilibrium quantity becomes Qe which is a decrease from the
original one. Buyers will require less while the sellers also yearn to sell less. The equilibrium
price in this matter remains unchanged.
Surname 7
Question 4
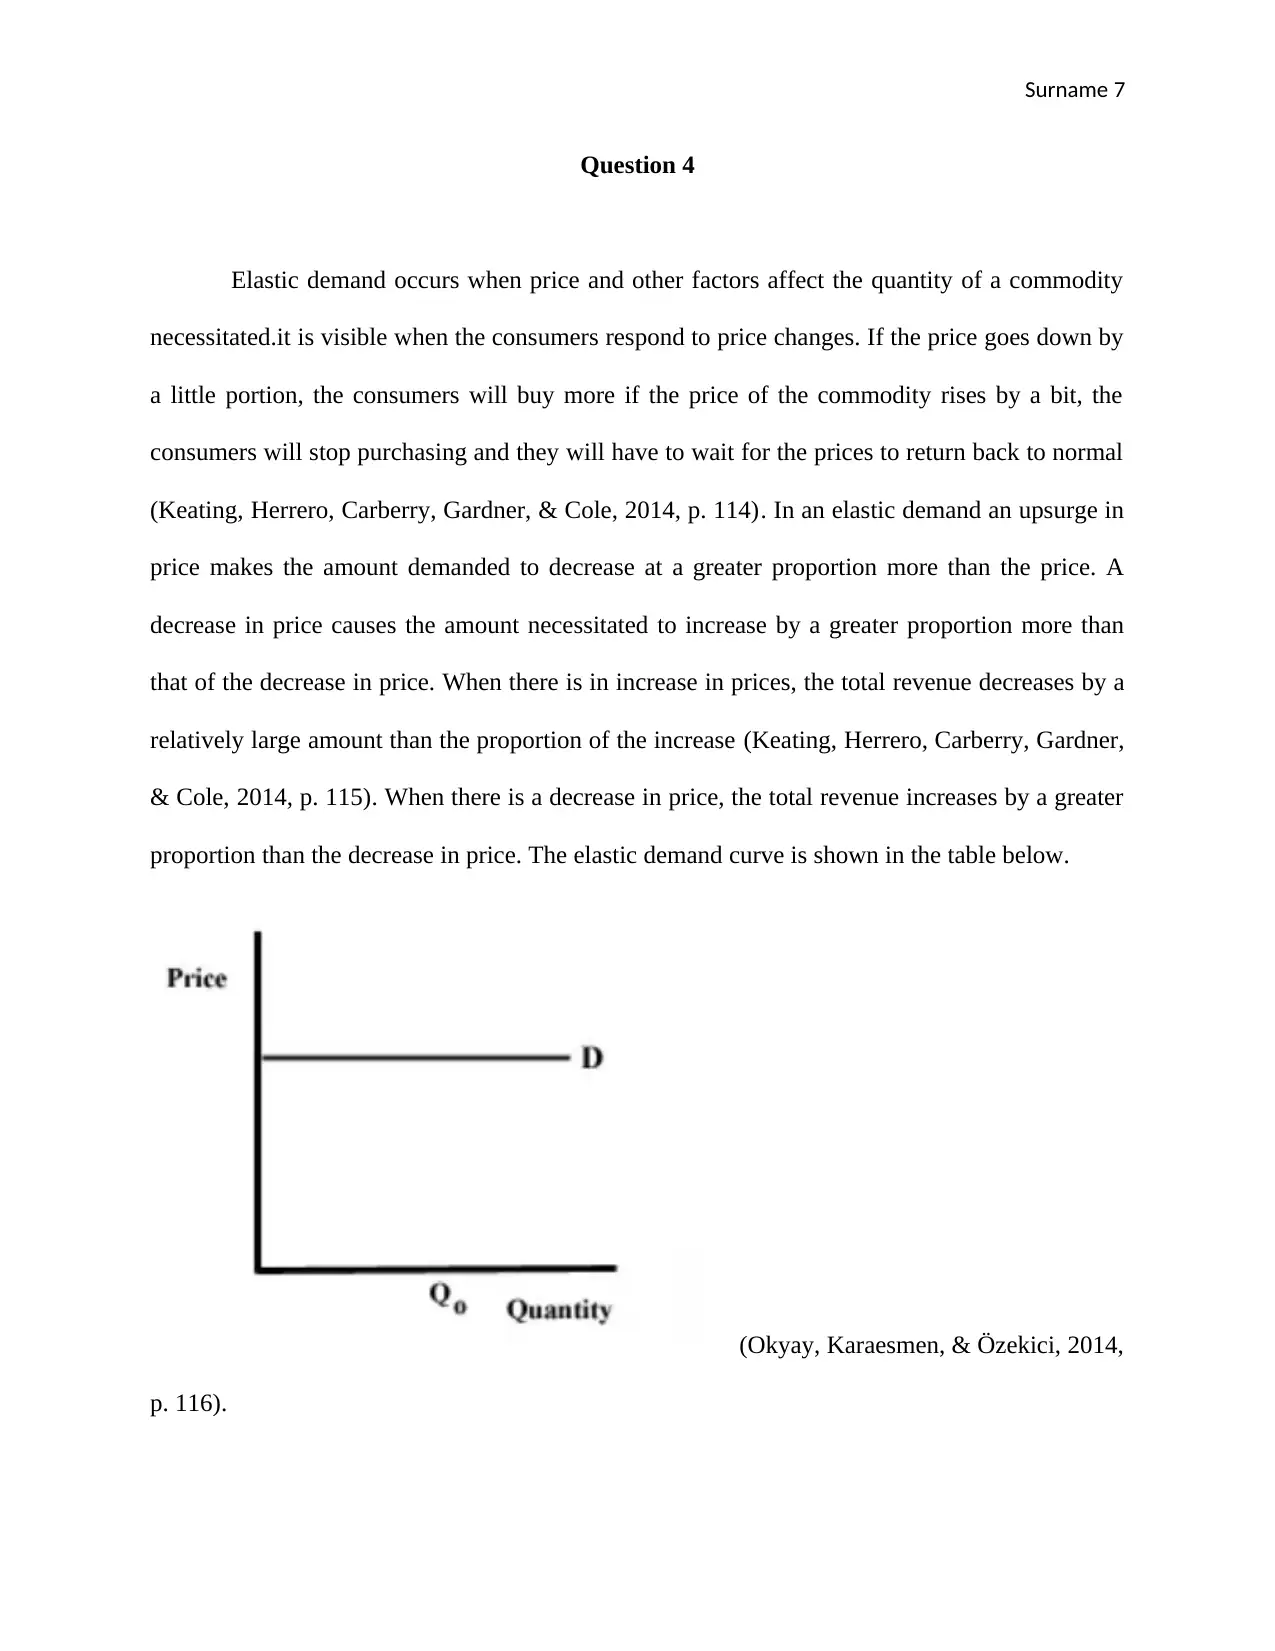
Elastic demand occurs when price and other factors affect the quantity of a commodity
necessitated.it is visible when the consumers respond to price changes. If the price goes down by
a little portion, the consumers will buy more if the price of the commodity rises by a bit, the
consumers will stop purchasing and they will have to wait for the prices to return back to normal
(Keating, Herrero, Carberry, Gardner, & Cole, 2014, p. 114). In an elastic demand an upsurge in
price makes the amount demanded to decrease at a greater proportion more than the price. A
decrease in price causes the amount necessitated to increase by a greater proportion more than
that of the decrease in price. When there is in increase in prices, the total revenue decreases by a
relatively large amount than the proportion of the increase (Keating, Herrero, Carberry, Gardner,
& Cole, 2014, p. 115). When there is a decrease in price, the total revenue increases by a greater
proportion than the decrease in price. The elastic demand curve is shown in the table below.
(Okyay, Karaesmen, & Özekici, 2014,
p. 116).
Question 4
Elastic demand occurs when price and other factors affect the quantity of a commodity
necessitated.it is visible when the consumers respond to price changes. If the price goes down by
a little portion, the consumers will buy more if the price of the commodity rises by a bit, the
consumers will stop purchasing and they will have to wait for the prices to return back to normal
(Keating, Herrero, Carberry, Gardner, & Cole, 2014, p. 114). In an elastic demand an upsurge in
price makes the amount demanded to decrease at a greater proportion more than the price. A
decrease in price causes the amount necessitated to increase by a greater proportion more than
that of the decrease in price. When there is in increase in prices, the total revenue decreases by a
relatively large amount than the proportion of the increase (Keating, Herrero, Carberry, Gardner,
& Cole, 2014, p. 115). When there is a decrease in price, the total revenue increases by a greater
proportion than the decrease in price. The elastic demand curve is shown in the table below.
(Okyay, Karaesmen, & Özekici, 2014,
p. 116).
Paraphrase This Document
Need a fresh take? Get an instant paraphrase of this document with our AI Paraphraser
Surname 8
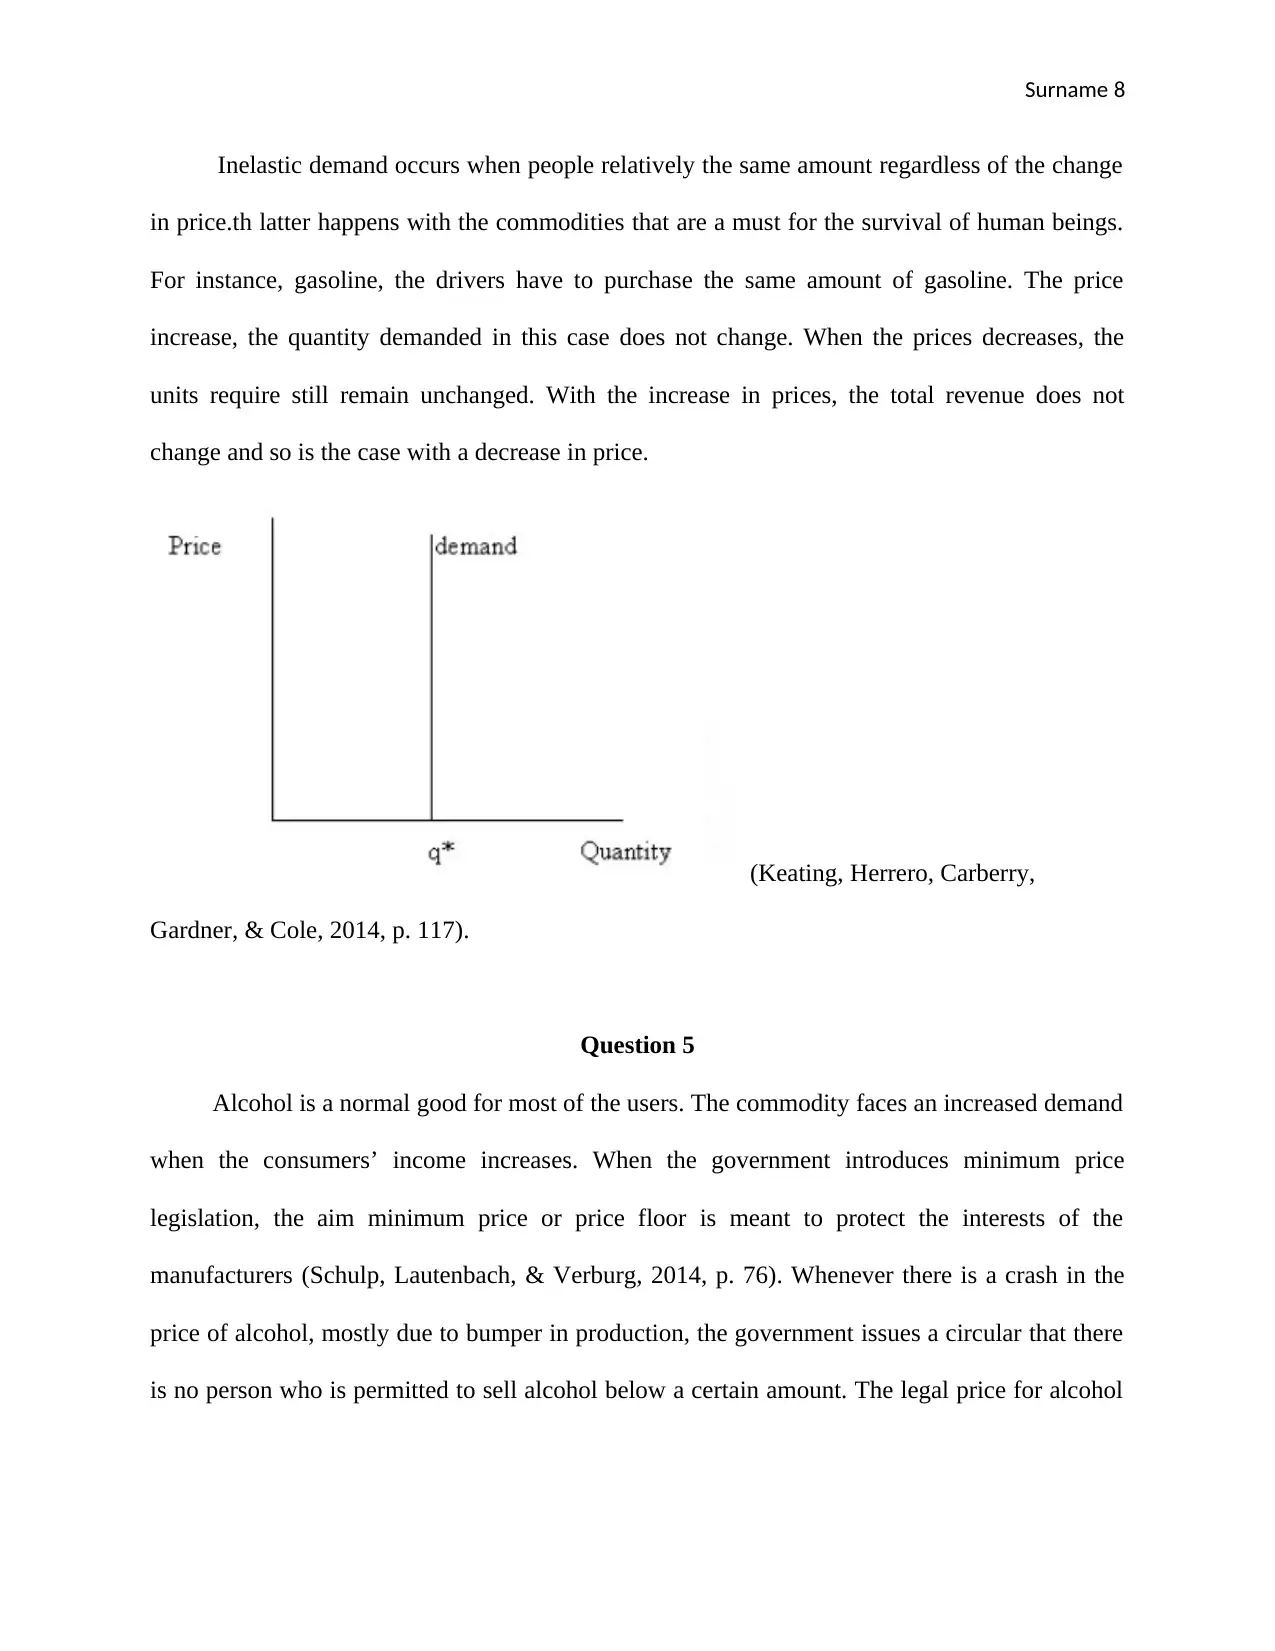
Inelastic demand occurs when people relatively the same amount regardless of the change
in price.th latter happens with the commodities that are a must for the survival of human beings.
For instance, gasoline, the drivers have to purchase the same amount of gasoline. The price
increase, the quantity demanded in this case does not change. When the prices decreases, the
units require still remain unchanged. With the increase in prices, the total revenue does not
change and so is the case with a decrease in price.
(Keating, Herrero, Carberry,
Gardner, & Cole, 2014, p. 117).
Question 5
Alcohol is a normal good for most of the users. The commodity faces an increased demand
when the consumers’ income increases. When the government introduces minimum price
legislation, the aim minimum price or price floor is meant to protect the interests of the
manufacturers (Schulp, Lautenbach, & Verburg, 2014, p. 76). Whenever there is a crash in the
price of alcohol, mostly due to bumper in production, the government issues a circular that there
is no person who is permitted to sell alcohol below a certain amount. The legal price for alcohol
Surname 9
is certainly set by the regime above the equilibrium price and this is dogged by the demand and
supply curve.
The effect of alcohol price is shown in the table below. OP is the equilibrium price which
is determined by the forces of demand and supply. If the prices crash below point OP, this will
lead to severe hardships for the producers.to assist flatter the manufacturers, the government
fixes a minimum price at OP below which no producer is supposed to make any sell (Okyay,
Karaesmen, & Özekici, 2014, p. 58). At this stipulated price, there occurs an excessive supply
measured by the distance AB .as a result of the excessive supply, high chances of black-market
are not evident.
Surname 10
References
Azevedo, C. L., Marczuk, K., Raveau, S., Soh, H., Adnan, M., & Basak, K., (2016).
Microsimulation of demand and supply of autonomous mobility on demand. Transportation
Research Record, 2564(1), 21-30.
Gligor, M. D. (2014). The role of demand management in achieving supply chain agility. Supply
Chain Management. An International Journal, 19(5/6), 577-591.
Keating, B. A., Herrero, M., Carberry, P. S., Gardner, J., & Cole, M. B. (2014). Food wedges:
framing the global food demand and supply challenge towards 2050. Global Food Security, 3(3-
4), 125-132.
Okyay, H. K., Karaesmen, F., & Özekici, S. (2014). Newsvendor models with dependent random
supply and demand. Optimization Letters, 8(3), 983-999.
Schulp, C. J., Lautenbach, S., & Verburg, P. H. (2014). Quantifying and mapping ecosystem
services: Demand and supply of pollination in the European Union. Ecological Indicators, 36(1),
131-141.
1 out of 10
Related Documents


Your All-in-One AI-Powered Toolkit for Academic Success.
+13062052269
info@desklib.com
Available 24*7 on WhatsApp / Email
![[object Object]](/_next/static/media/star-bottom.7253800d.svg)
Unlock your academic potential
© 2024 | Zucol Services PVT LTD | All rights reserved.