SUSS Student Survey Analysis Report - Human Capital Management

Verified

Added on  2022/09/15

|10
|2141
|17
Report
AI Summary
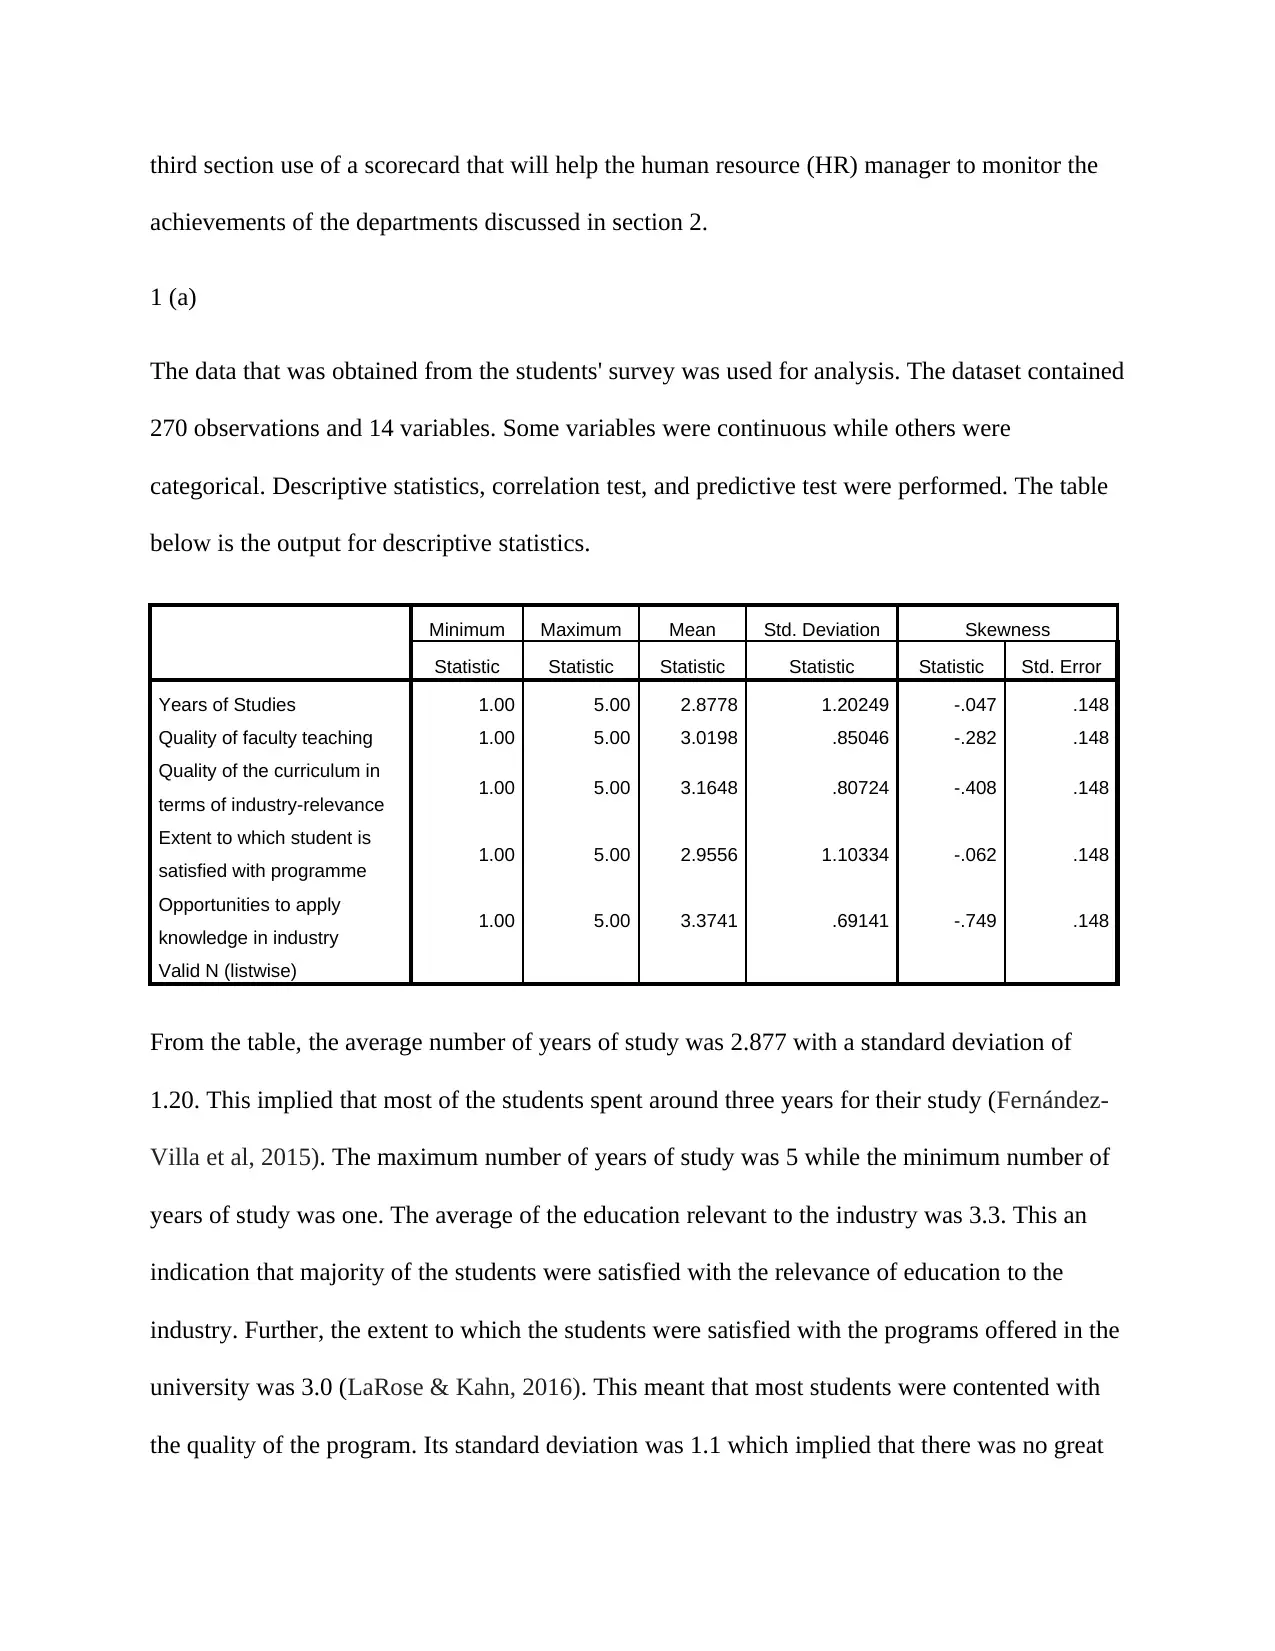
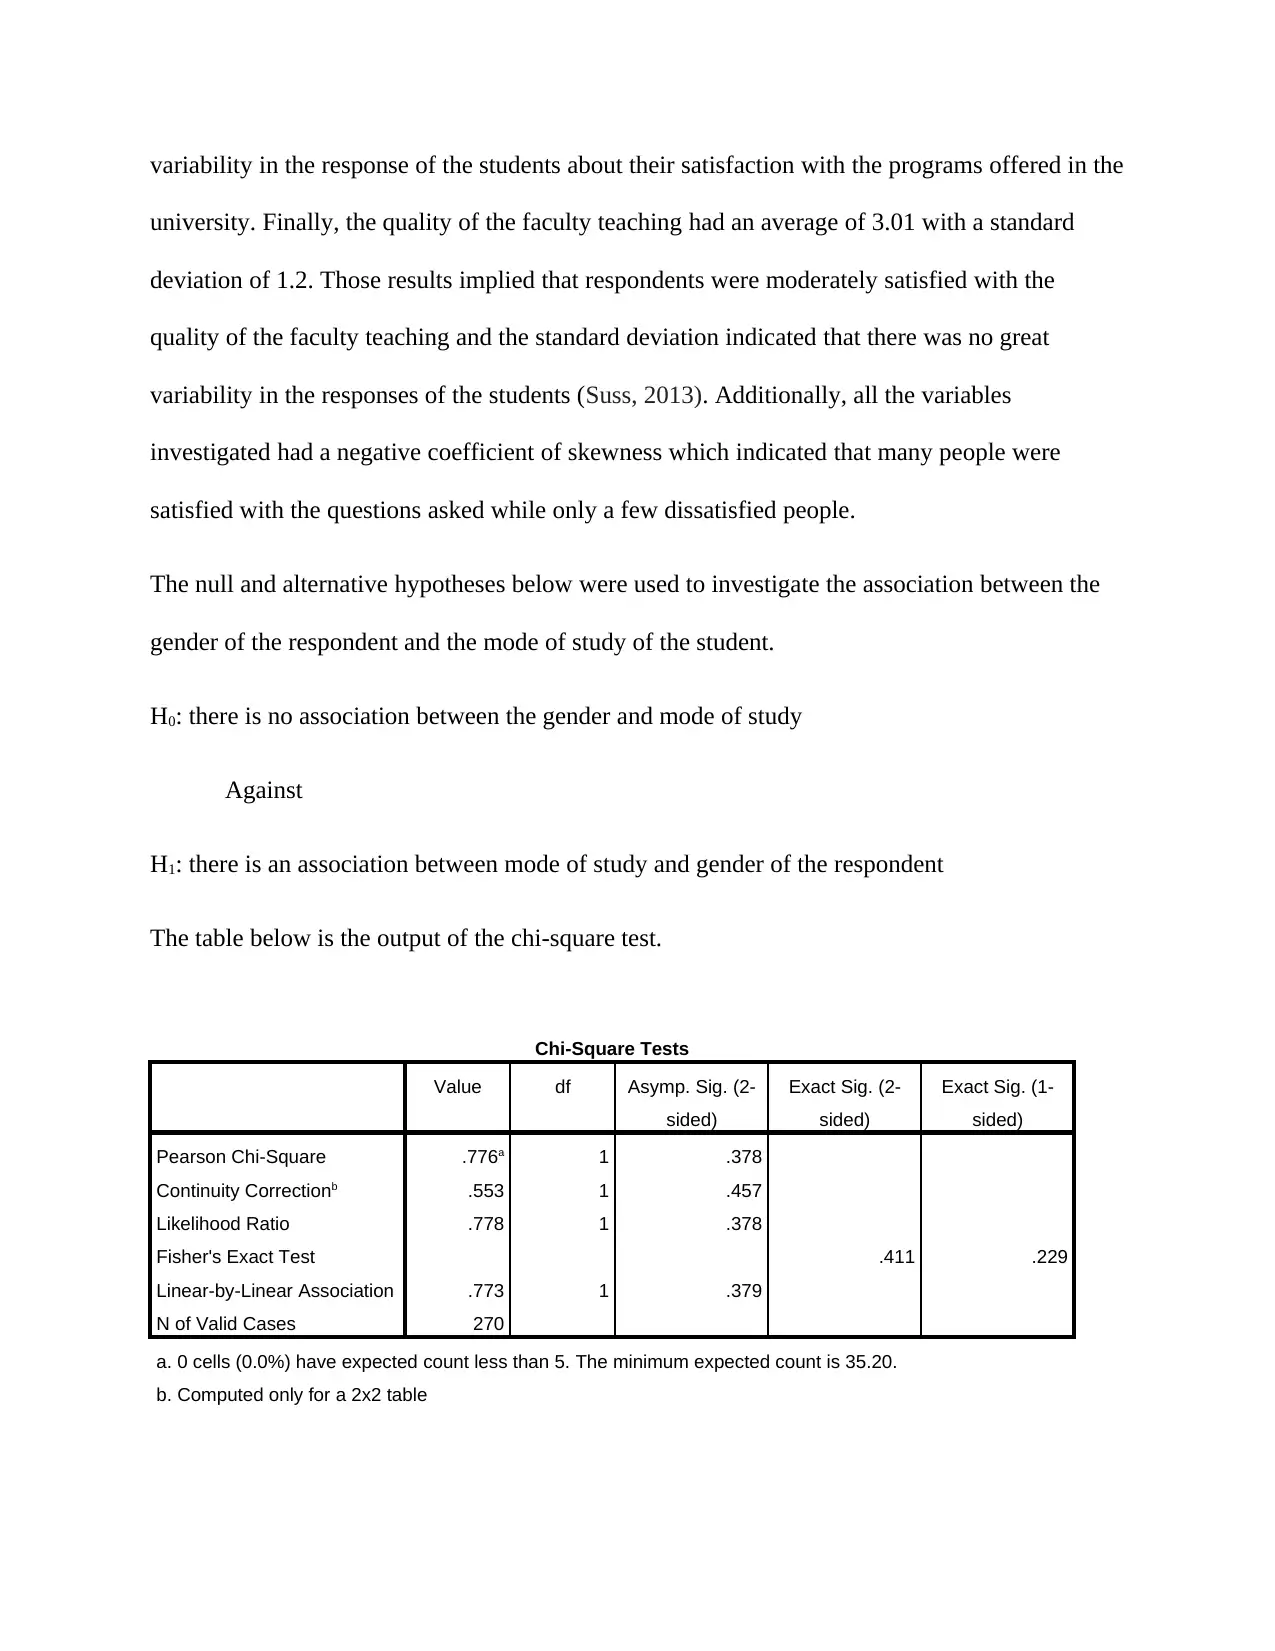
This report analyzes a student survey conducted at the Singapore University of Social Sciences (SUSS) to investigate factors influencing student satisfaction and university performance. The analysis includes descriptive statistics, correlation tests, and predictive modeling using SPSS. The study examines the relationship between student demographics (gender, mode of study, year of study) and their likelihood to recommend SUSS. The report also explores human capital management within SUSS, linking university resources to desired outcomes. A scorecard is developed to help the HR manager monitor the performance of various departments in achieving the university's mission and vision. The findings suggest that student satisfaction, curriculum relevance, and faculty quality play key roles in student recommendations and overall university success. The report provides recommendations for SUSS to improve student experience and competitiveness in the higher education landscape.
Document Page
SUSS Students survey
Student Name:
Professor:
Date:
tabler-icon-diamond-filled.svg

Paraphrase This Document

Need a fresh take? Get an instant paraphrase of this document with our AI Paraphraser
Document Page
Introduction
Learning institutions seeks to deliver quality services to learners. Learners want to have
memorable learning experiences and also feel the prestige of studying in a certain learning
institution (Brown & Carasso, 2013). Due to this need for satisfying leaners need, there has been
a massive rise of many learning institutions in the past two decades. As a result competition for
the learners, it's at the high level currently. To combat this problem of competition, the learning
institutions in particular universities strive to give the best learning experiences to the students
(Amirault, 2012). This is made possible through various advertisement mediums and
coordination of various departments in the universities.
To increase the number of students that are enrolled in a certain university there has been the
introduction of two modes of learning which includes full time and part-time learning methods.
This is made possible by both in-class and online learning (Pusser & Marginson, 2013).
Singapore University of Social Sciences (SUSS) is not an exception to these universities. SUSS
provides learning opportunities to even those who were are old. It encourages those in marriages
to learn by even providing subsidies to their fees. It tries to achieve students loyalty so that they
can become SUSS ambassadors and recommend SUSSS to other people (Joseph Mbembe.
2016). It provides social education and is one of the most autonomous universities in Singapore.
This paper involves investigating the various ways in which SUSS can get more students being
admitted to this university. It also involves investigating ways in which various departments in
the universities can collaborate towards the realization of the university mission and vision. The
paper is divided into three sections. The first section involves analyzing the data that was
collected during the survey to obtain the descriptive and predictive statistics. The second section
involves constructing of linkages between human capital and university outcomes. Finally, the
Document Page
third section use of a scorecard that will help the human resource (HR) manager to monitor the
achievements of the departments discussed in section 2.
1 (a)
The data that was obtained from the students' survey was used for analysis. The dataset contained
270 observations and 14 variables. Some variables were continuous while others were
categorical. Descriptive statistics, correlation test, and predictive test were performed. The table
below is the output for descriptive statistics.
Minimum Maximum Mean Std. Deviation Skewness
Statistic Statistic Statistic Statistic Statistic Std. Error
Years of Studies 1.00 5.00 2.8778 1.20249 -.047 .148
Quality of faculty teaching 1.00 5.00 3.0198 .85046 -.282 .148
Quality of the curriculum in
terms of industry-relevance 1.00 5.00 3.1648 .80724 -.408 .148
Extent to which student is
satisfied with programme 1.00 5.00 2.9556 1.10334 -.062 .148
Opportunities to apply
knowledge in industry 1.00 5.00 3.3741 .69141 -.749 .148
Valid N (listwise)
From the table, the average number of years of study was 2.877 with a standard deviation of
1.20. This implied that most of the students spent around three years for their study (Fernández-
Villa et al, 2015). The maximum number of years of study was 5 while the minimum number of
years of study was one. The average of the education relevant to the industry was 3.3. This an
indication that majority of the students were satisfied with the relevance of education to the
industry. Further, the extent to which the students were satisfied with the programs offered in the
university was 3.0 (LaRose & Kahn, 2016). This meant that most students were contented with
the quality of the program. Its standard deviation was 1.1 which implied that there was no great
Document Page
variability in the response of the students about their satisfaction with the programs offered in the
university. Finally, the quality of the faculty teaching had an average of 3.01 with a standard
deviation of 1.2. Those results implied that respondents were moderately satisfied with the
quality of the faculty teaching and the standard deviation indicated that there was no great
variability in the responses of the students (Suss, 2013). Additionally, all the variables
investigated had a negative coefficient of skewness which indicated that many people were
satisfied with the questions asked while only a few dissatisfied people.
The null and alternative hypotheses below were used to investigate the association between the
gender of the respondent and the mode of study of the student.
H0: there is no association between the gender and mode of study
Against
H1: there is an association between mode of study and gender of the respondent
The table below is the output of the chi-square test.
Chi-Square Tests
Value df Asymp. Sig. (2-
sided)
Exact Sig. (2-
sided)
Exact Sig. (1-
sided)
Pearson Chi-Square .776a 1 .378
Continuity Correctionb .553 1 .457
Likelihood Ratio .778 1 .378
Fisher's Exact Test .411 .229
Linear-by-Linear Association .773 1 .379
N of Valid Cases 270
a. 0 cells (0.0%) have expected count less than 5. The minimum expected count is 35.20.
b. Computed only for a 2x2 table
tabler-icon-diamond-filled.svg

Paraphrase This Document

Need a fresh take? Get an instant paraphrase of this document with our AI Paraphraser
Document Page
The test had a p-value of 0.378 which was greater than 0.05 level of significance. Therefore the
null hypothesis was rejected which lead to the conclusion that there was no association between
the gender of the student and the mode of study (Floros et al, 2014). Similarly, the test for
association between mode of study and the extent to which the student could recommend the
university to others had a p-value of 0.02 which less than 0.05 level of significance. Therefore,
there was an association between the mode of study and the extent to which the student could
recommend SUSS to others.
Finally, a logistic regression model was fitted to investigate various factors were associated with
students recommending SUSS to others. The output for the logistic regression is represented in
the table below.
B S.E. Sig.
Step 1a
Gender(1) .166 .394 .674
Prog_Type .788 .349 .024
Yr_Study -.312 .149 .037
Network_Opp -.435 .186 .019
Lrg_Resources .009 .197 .965
Qua_Curriculum 2.387 .327 .000
Constant -6.344 1.449 .000
From the table, the odds of female students recommending SUSS to others was higher than that
of male students by 0.394 units holding other predictors constant. Similarly, the odds
recommending SUSS to others decreased by -0.312 units per unit increase in the year of study
holding other predictors constant. The other explanatory variables were similarly explained. P-
values were used to investigate whether the explanatory variables were statistically significant in
determining whether a student could recommend SUSS to others. Gender and accessibility of
learning material were insignificant in explaining the response variables since they had p-values
Document Page
which were greater than 0.05 level of significance. On the other hand, the predictor variables that
had p-values less than 0.05 were statistically significant in determining whether students would
recommend SUSS to others.
1 (b)
Human capital management was investigated using Fitz-Enz’s human capital impacts the
university goals and the competitive strategies that can be applied (Alhamami, 2019). It's crucial
in determining how the university goals can be achieved using various departments in the
university. This is made possible by each department having its goal that contributes to the
overall university goals. The diagram below represents the linkages between the resources in the
university and the expected outcome of the university.
Document Page
Enterprise level
Enterprise goal
Equipping students with top notch skills
Competitive strategy
Hiring of high quality professionals
Functional business level
Critical business outputs
Critical business units and tasks
Human capital management
Product quality
Affordable and
accessible education to
all
Customer service
Involving students in
delivery of services
Corporate branding
Awarding students for
their outstanding
performance
Customer services
Transparence and
accountability in
service delivery
Marketing
Reviewing the
curriculum to meet the
changing needs of the
students
Products and services
Subsidizing tuition fees
tabler-icon-diamond-filled.svg

Paraphrase This Document

Need a fresh take? Get an instant paraphrase of this document with our AI Paraphraser
Document Page
1 (c)
To have an effective way of managing the linkage pathway in the section above, a scorecard was
developed (Younes et al, 2016). The table below represents the scorecard that was proposed to
the HR to achieve each of the above decision discussed in the human capital management level
table.
Dimension Objective Measures
University output Produce highly skilled
graduates from SUSS
improving the
accessibility of the
learning resources
to all students
The increased
connection between
university and graduates
To enable students from
SUSS to be more marketable in
the corporate world
welcoming
successful business
founders and
innovators to guide
the students
Enhancing the
faculty curriculum
is industry-
oriented rather
than exam oriented
HR efficiency in
hiring employees
Hire high quality and
passionate employees who will
enable students to fulfill their
dreams
Involving students
leaders in the
hiring process who
clearly understands
the students’ needs
Document Page
University
accessibility
Admission of a large
number of students in SUSS as
much as possible
Encouraging
students to
recommend SUSS
to others by giving
them discounts on
their fees
Offering lower
tuition fees to the
needy students by
giving them
subsidies
References
Alhamami, M. (2019). Language of Instruction Policy in Science Programs: Science University
Students’ Voices. Jurnal Pendidikan IPA Indonesia, 8(1), 110-118.
Amirault, R. J. (2012). Distance learning in the 21st century university: Key issues for leaders
and faculty. Quarterly Review of Distance Education, 13(4), 253.
Brown, R., & Carasso, H. (2013). Everything for sale? The marketisation of UK higher
education. Routledge.
Fernández-Villa, T., Ojeda, J. A., Gómez, A. A., CARRAL, J., CANCELA, M., Delgado-
Rodríguez, M., ... & Moncada, R. O. (2015). Problematic Internet Use in University
Students: associated factors and differences of gender. Adicciones, 27(4).
Document Page
Floros, G., Siomos, K., Stogiannidou, A., Giouzepas, I., & Garyfallos, G. (2014). The
relationship between personality, defense styles, internet addiction disorder, and
psychopathology in college students. Cyberpsychology, Behavior, and Social
Networking, 17(10), 672-676.
Joseph Mbembe, A. (2016). Decolonizing the university: New directions. Arts and Humanities
in Higher Education, 15(1), 29-45.
LaRose, C., & Kahn, M. (2016). Conducting a Comprehensive Survey of Publishing Activity at
Your Institution.
Pusser, B., & Marginson, S. (2013). University rankings in critical perspective. The Journal of
Higher Education, 84(4), 544-568.
Suss, G. (2013). The next revolution will be in education: A new marketing approach for
schools. Journal of International Education Research (JIER), 9(1), 47-54.
Younes, F., Halawi, G., Jabbour, H., El Osta, N., Karam, L., Hajj, A., & Khabbaz, L. R. (2016).
Internet addiction and relationships with insomnia, anxiety, depression, stress and self-
esteem in university students: A cross-sectional designed study. PloS one, 11(9),
e0161126.
chevron_up_icon
1 out of 10
circle_padding
hide_on_mobile
zoom_out_icon
[object Object]