LCA Exercises: Analyzing Environmental Impact & Sustainable Design
VerifiedAdded on 2023/06/04
|8
|1560
|347
Report
AI Summary
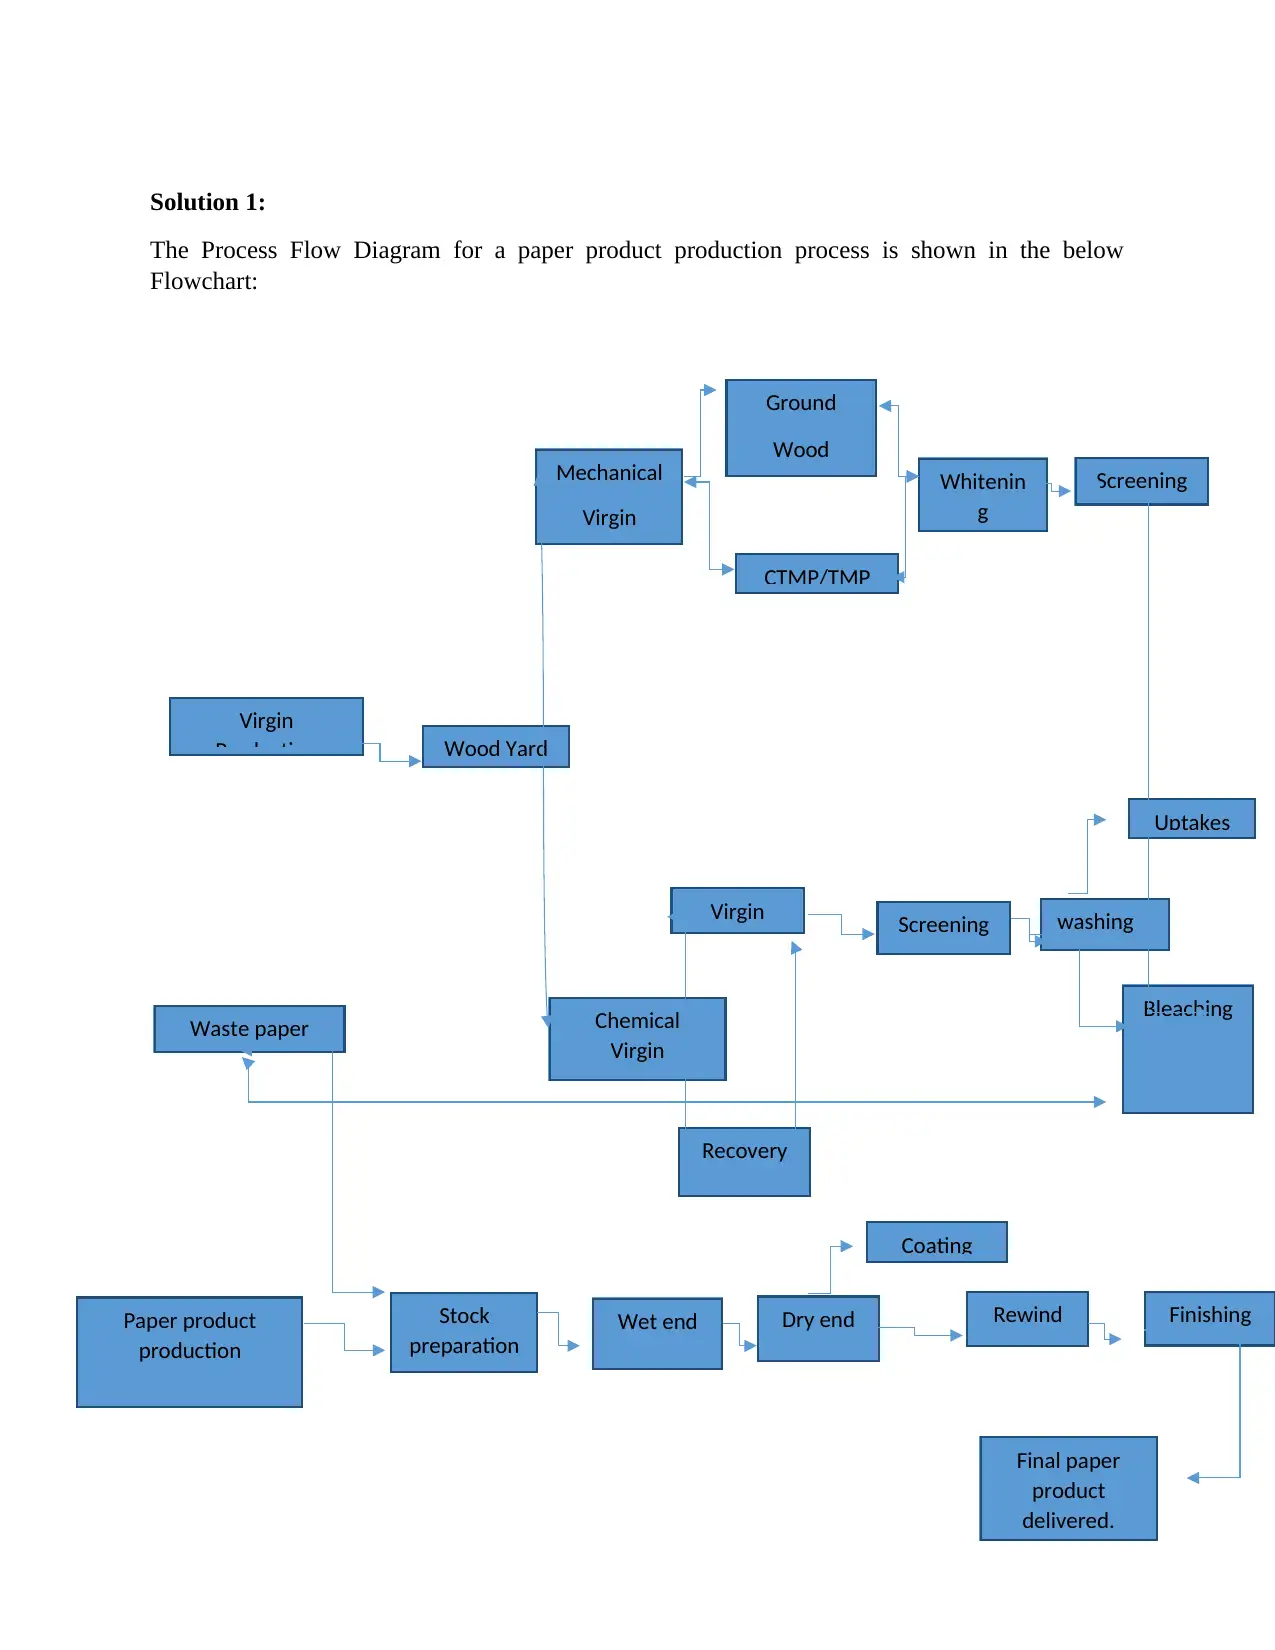
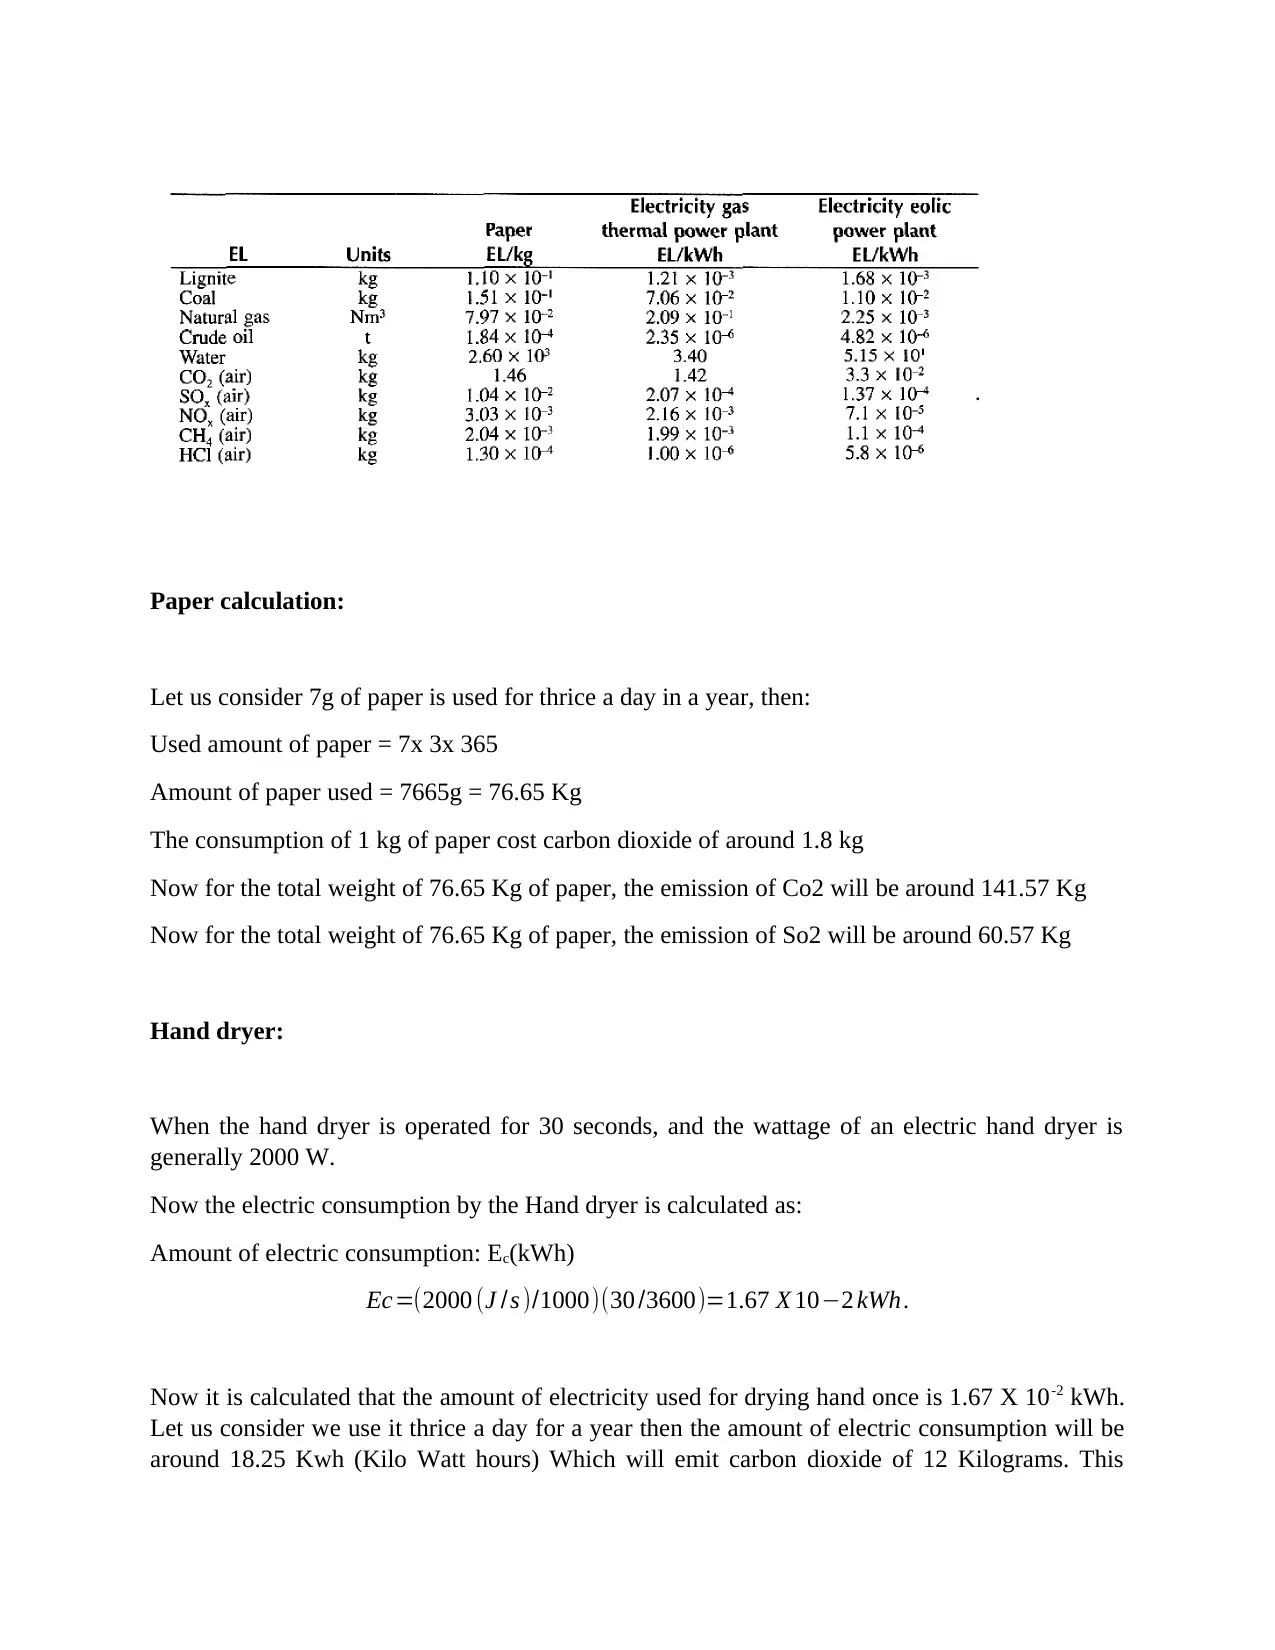
This report presents a Life Cycle Assessment (LCA) of paper products, focusing on sustainable development and design practices. It includes a process flow diagram for paper production, comparing virgin and recycled paper in terms of CO2 emissions and solid waste. The report analyzes the environmental impact of transporting recycled paper over long distances versus purchasing virgin paper locally. Furthermore, it compares the use of paper towels and electric hand dryers, evaluating CO2 and SO2 emissions. The analysis concludes that while recycled paper is better in terms of raw material usage, virgin paper may be preferable when considering transportation. The report emphasizes the importance of reducing deforestation and promoting paper recycling to minimize environmental impact. Desklib offers a range of study tools and resources, including solved assignments and past papers, to support students in their academic endeavors.

SUSTAINABILE DEVELOPEMENT AND DESIGN PRACTICE
Submitted
by
Student Name
Student ID
Submitted
by
Student Name
Student ID
Paraphrase This Document
Need a fresh take? Get an instant paraphrase of this document with our AI Paraphraser

Solution 1:
The Process Flow Diagram for a paper product production process is shown in the below
Flowchart:
Virgin
Production Wood Yard
Mechanical
Virgin
Chemical
Virgin
Ground
Wood
CTMP/TMP
Whitenin
g
Screening
Virgin
Recovery
Screening washing
Uptakes
Bleaching
Waste paper
Paper product
production
Stock
preparation
Wet end
Coating
Rewind Finishing
Final paper
product
delivered.
Dry end

The flow chart clearly explains the process that is involved in the manufacturing of paper. Any
product cycle has three stages such as Pre manufacturing phase, Live Manufacturing phase, and
Packing and delivery stages. The Pre manufacturing phase includes the process for background
study, design and analyzing the data such as customer feedbacks needs, etc. In the pre-
manufacturing stage all the planning that is required to make the raw material as the finished
product is done, this process of planning the manufacturing process is known as process
planning. Also, the cost estimation is done before the starting of the production itself, thus the
process planning and the cost estimation takes place in the pre-manufacturing stage. The second
stage is the manufacturing stage which consists of various fabrication processes to manufacture
the product (Bilir, L.K.s 2014).
The manufacturing phase utilizes various manpower and machines to make the raw material into
the finished product. The manufacturing process must to done with care in order to eliminate
wastage of resources and to obtain a good product. The post manufacturing stage is the stage
which consists of packing and delivering the product to the customers. It includes marketing and
sales the post-manufacturing stage also includes quality checking, customer support, etc. In this
particular model, the Collection of waste paper and virgin production from the wood makes up
the part of the pre-manufacturing process. Then all the fabrication processes such as Virginian,
whitening, drying, bleaching, washing, screening, etc. comes under manufacturing processes.
The final process is the post-manufacturing process which includes delivery of the product to the
customers. (Bilir, L.K. 2014).
Solution 2:
Virgin Paper:
Kg of Co2 =1.61
Recycled Waste Paper:
Kg of Co2 = 1.03
Difference = 0.57
The waste paper is better.
Virgin Paper:
Kg Solids: 1.73 x 10-1 = 0.173
Recycled Waste Paper:
Kg Solids: 7.06 x 10 -2 = 0.0706
⊘ This is a preview!⊘
Do you want full access?
Subscribe today to unlock all pages.

Trusted by 1+ million students worldwide

Difference
= 0.173 - 0.0706
= 0.1024
Waste Paper is better having 0.0706
Virgin Paper
Car
kgCo2 = 2.16 x 10 -1 = 0.216
Kg Solids = 7.50 x 10- 6=0.0000075
Recycle waster Paper
Truck
kgCo2 = 3.46 x 10-1 =0.346
Kg Solids = 7.19 x10 -2=0.0719
S.No Paper Kg of Co2 Kg solids Mode of transport Kg Co2 for Vehicle
1 Virgin 1.61 0.173 Car 0.216
2 Waste paper 1.03 0.0706 Truck 0.346
Now from the above table, it is clear that the waste paper needs a truck to be transported whereas
in the case of the virgin paper, the car is enough. Comparing to truck and car, Car co2 emission
is lower than that of the truck. We can purchase easily new paper from near stationary shop
better than travelling 1,000 km to recycle paper. But in the case of raw material side the waste
paper is better than that of the virgin paper.(Laurijssen, J., Marsidi, M., Westenbroek, A.,
Worrell, E. and Faaij, A. 2010).
Forests are the most important resource in our world but unfortunately, the deforestation rate is
increasing day by day. Almost more than fifty per cent of the trees that are harvested are being
turned into some forms of paper merchandise. (Isaksson, J., Pettersson, K., Mahmoudkhani, M.,
Åsblad, A. and Berntsson, T., 2012). The global paper and paper virgin product production are
increasing in a huge rate as much as 17 per cent than the previous year, so an action must be
Paraphrase This Document
Need a fresh take? Get an instant paraphrase of this document with our AI Paraphraser

taken in order to safeguard our trees and to aid afforestation. The recycling of paper products
should be encouraged so that the deforestation process will go low. Also producing paper
products from virgin woods not only affects the forests but also it emits greenhouse gases as a
result of manufacturing processes(Laurijssen, J., Marsidi, M., Westenbroek, A., Worrell, E. and
Faaij, A., 2010). (Isaksson, J., Pettersson, K., Mahmoudkhani, M., Åsblad, A. and Berntsson, T.
2012).
For each and every thousand kg of a recycled product that replaces virgin fibre shows the
reduced usage in the following terms:
Wood - 100%
Total energy consumption - 27%
Wastewater - 33%
Air particulate emissions - 28%
Solid waste - 54%
There is a complete abundance of the wood cutting when the virgin paper is replaced with the
waste papers, which leads to the reduction in total amount of energy consumption (Monte, M.C.,
Fuente, E., Blanco, A. and Negro, C., 2009). The water wastage is also greatly reduced which are
spent on the processing of the fabrication, in the manufacturing plant. The air particles emission
will also be reduced in a considerable manner around 28 percentage. Also, the solid waste is
reduced (Monte, M.C., Fuente, E., Blanco, A. and Negro, C. 2009).
From the above discussions, we can come to a conclusion that virgin papers are better in case of
considering transportation losses whereas waste papers are better in case of raw materials.
Solution 3:
To do:
Compare the usage of Paper towels and air dryer and environmental effect which affects the
environment greatly . Parameters such as CO2 and SO2 will take part.
Given:
The weight of the paper towel is 7g
Hand dryer capacity 2000W works for 30 seconds

Paper calculation:
Let us consider 7g of paper is used for thrice a day in a year, then:
Used amount of paper = 7x 3x 365
Amount of paper used = 7665g = 76.65 Kg
The consumption of 1 kg of paper cost carbon dioxide of around 1.8 kg
Now for the total weight of 76.65 Kg of paper, the emission of Co2 will be around 141.57 Kg
Now for the total weight of 76.65 Kg of paper, the emission of So2 will be around 60.57 Kg
Hand dryer:
When the hand dryer is operated for 30 seconds, and the wattage of an electric hand dryer is
generally 2000 W.
Now the electric consumption by the Hand dryer is calculated as:
Amount of electric consumption: Ec(kWh)
Ec=(2000 (J /s )/1000)(30 /3600)=1.67 X 10−2 kWh.
Now it is calculated that the amount of electricity used for drying hand once is 1.67 X 10⁻² kWh.
Let us consider we use it thrice a day for a year then the amount of electric consumption will be
around 18.25 Kwh (Kilo Watt hours) Which will emit carbon dioxide of 12 Kilograms. This
⊘ This is a preview!⊘
Do you want full access?
Subscribe today to unlock all pages.

Trusted by 1+ million students worldwide

calculation is for the electric eolic power plant and when it comes it the gas power plant the
amount will vary and it will be around 25Kwh. Thus the usage of hand dryers will emit around
12-14 Kilograms of Carbon dioxide a year and an amount of 20 Kg of SO2 will also be emitted.
From the above calculations, it is clear that the usage of paper towels costs more usage of CO2
and So2 emissions than that of the Electric hand dryer, so it is better to use the electric hand
dryer rather than using paper towels.
Paraphrase This Document
Need a fresh take? Get an instant paraphrase of this document with our AI Paraphraser

References:
Bilir, L.K., (2014) Patent laws, product life-cycle lengths, and multinational activity American
Economic Review, 104(7), pp.1979-2013.
Laurijssen, J., Marsili, M., Westenbroek, A., Worrell, E. and Faaij, A., (2010).Paper and biomass
for energy: The impact of paper recycling on energy and CO2 emissions. Resources,
Conservation and Recycling, 54(12), pp.1208-1218.
Isaksson, J., Pettersson, K., Mahmoudkhani, M., Asblad, A. and Berntsson, T., (2012)
Integration of biomass gasification with a Scandinavian mechanical pulp and paper mill–
Consequences for mass and energy balances and global CO2 emissions. Energy, 44(1), pp.420-
428.
Monte, M.C., Fuente, E., Blanco, A. and Negro, C., (2009) Waste management from pulp and
paper production in the European Union. Waste management, 29(1), pp.293-308.
1 out of 8
Your All-in-One AI-Powered Toolkit for Academic Success.
+13062052269
info@desklib.com
Available 24*7 on WhatsApp / Email
Unlock your academic potential
Copyright © 2020–2026 A2Z Services. All Rights Reserved. Developed and managed by ZUCOL.