Case Study: Forecasting SWU Football Game Attendance and Revenue

Verified

Added on  2023/06/04

|16
|1909
|294
Case Study
AI Summary
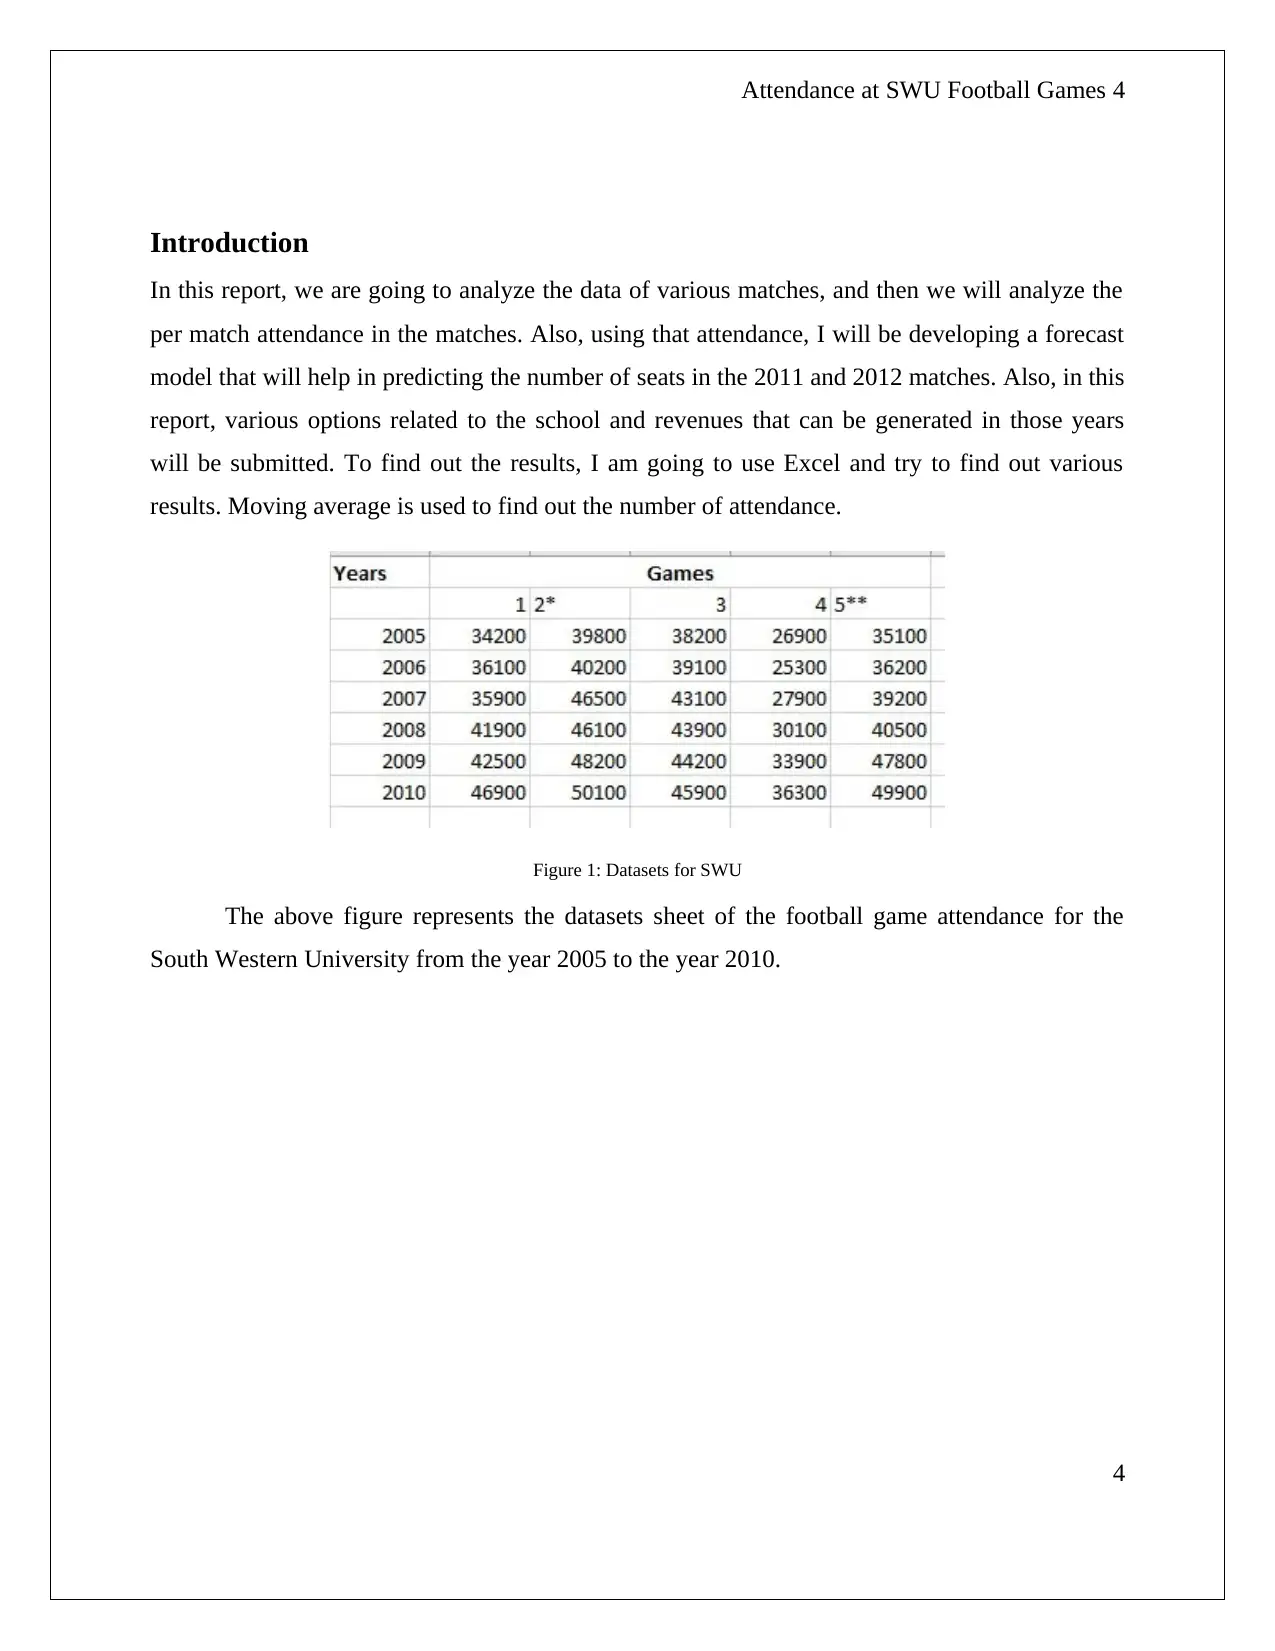
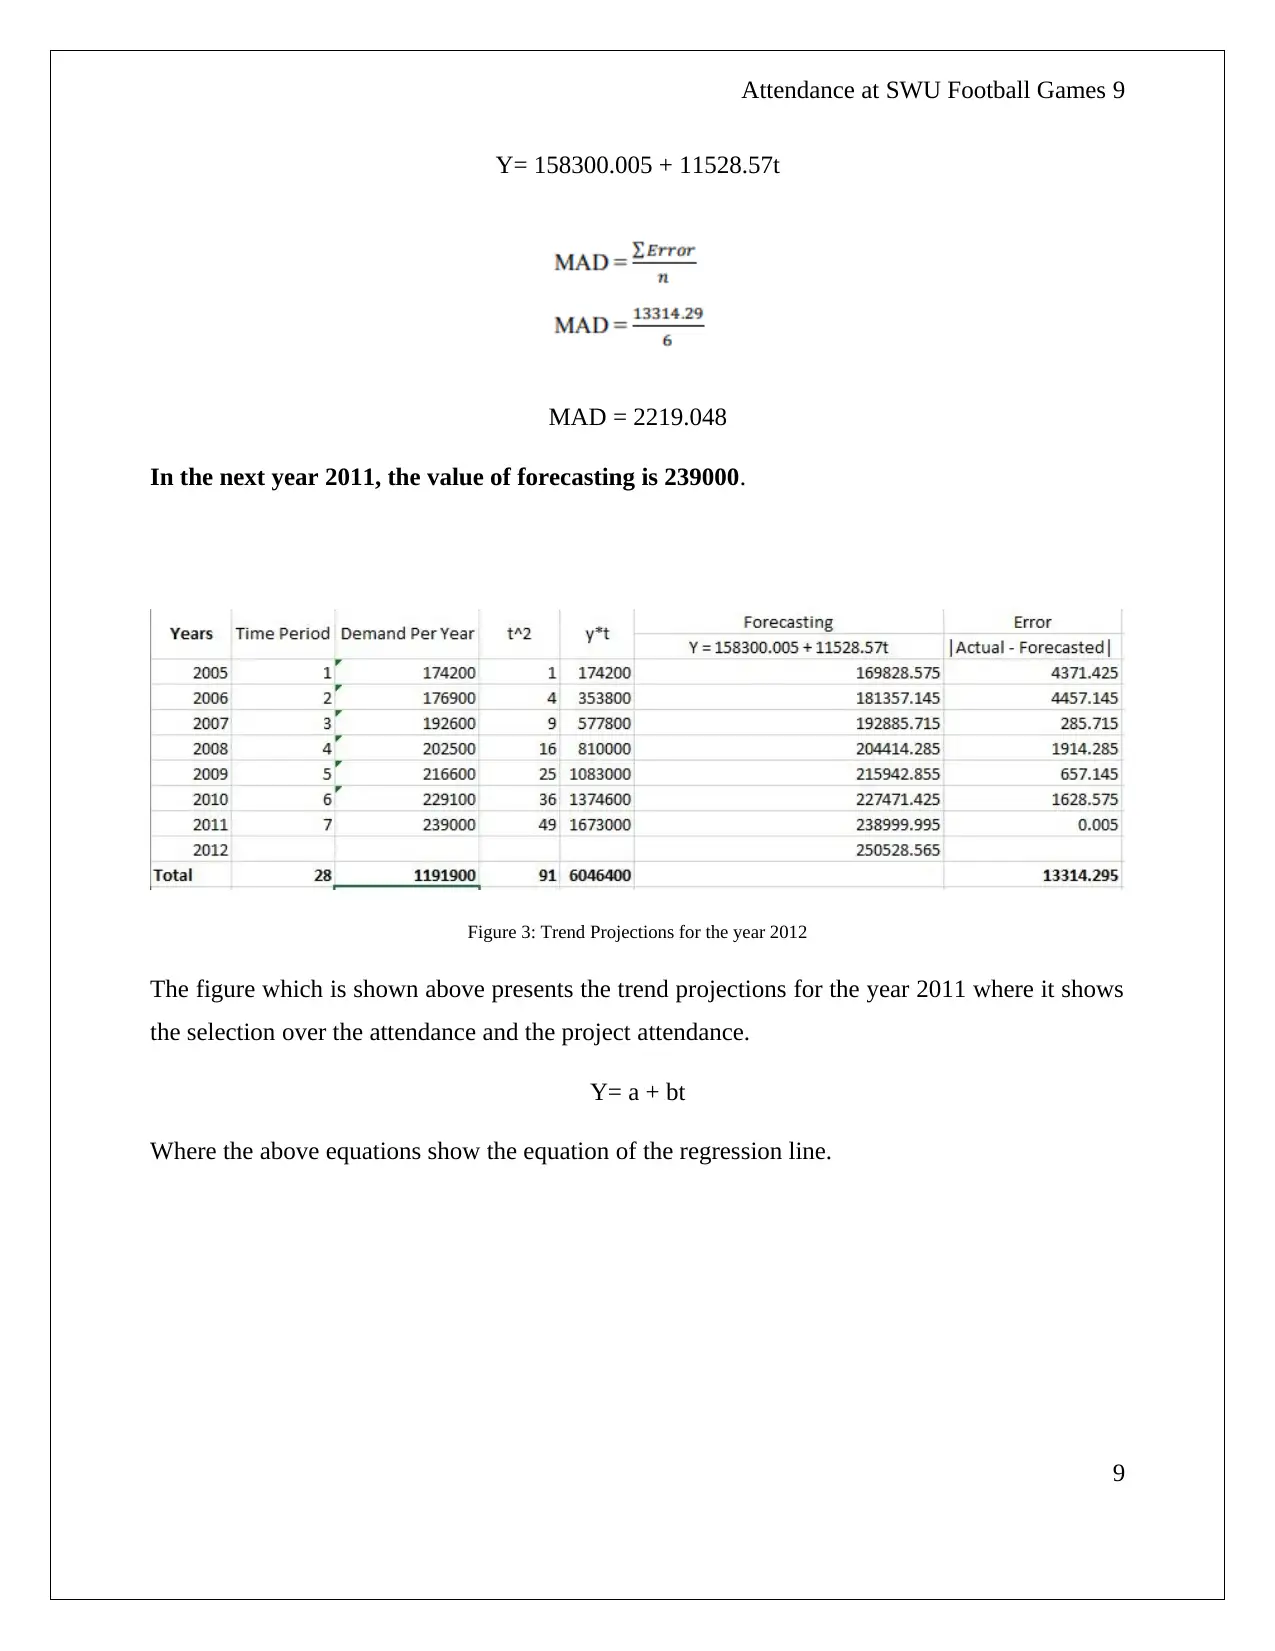
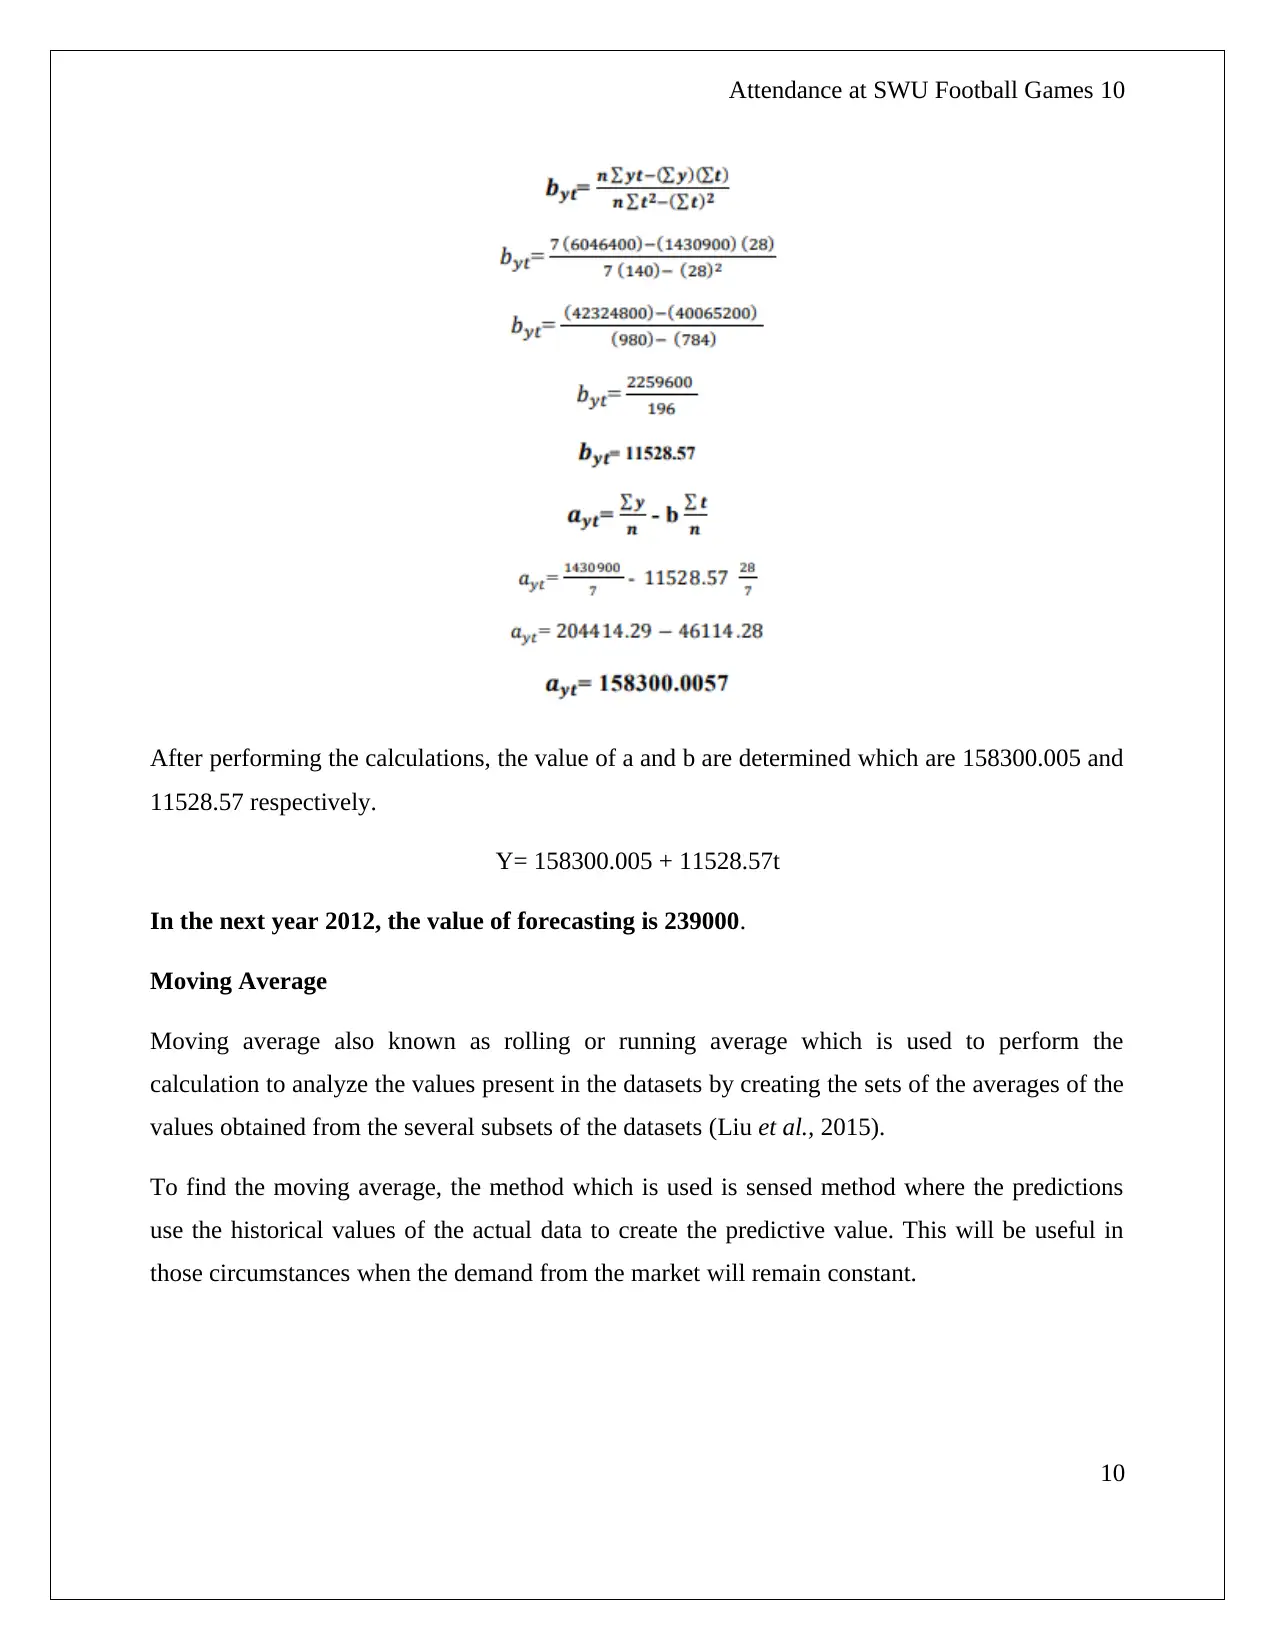
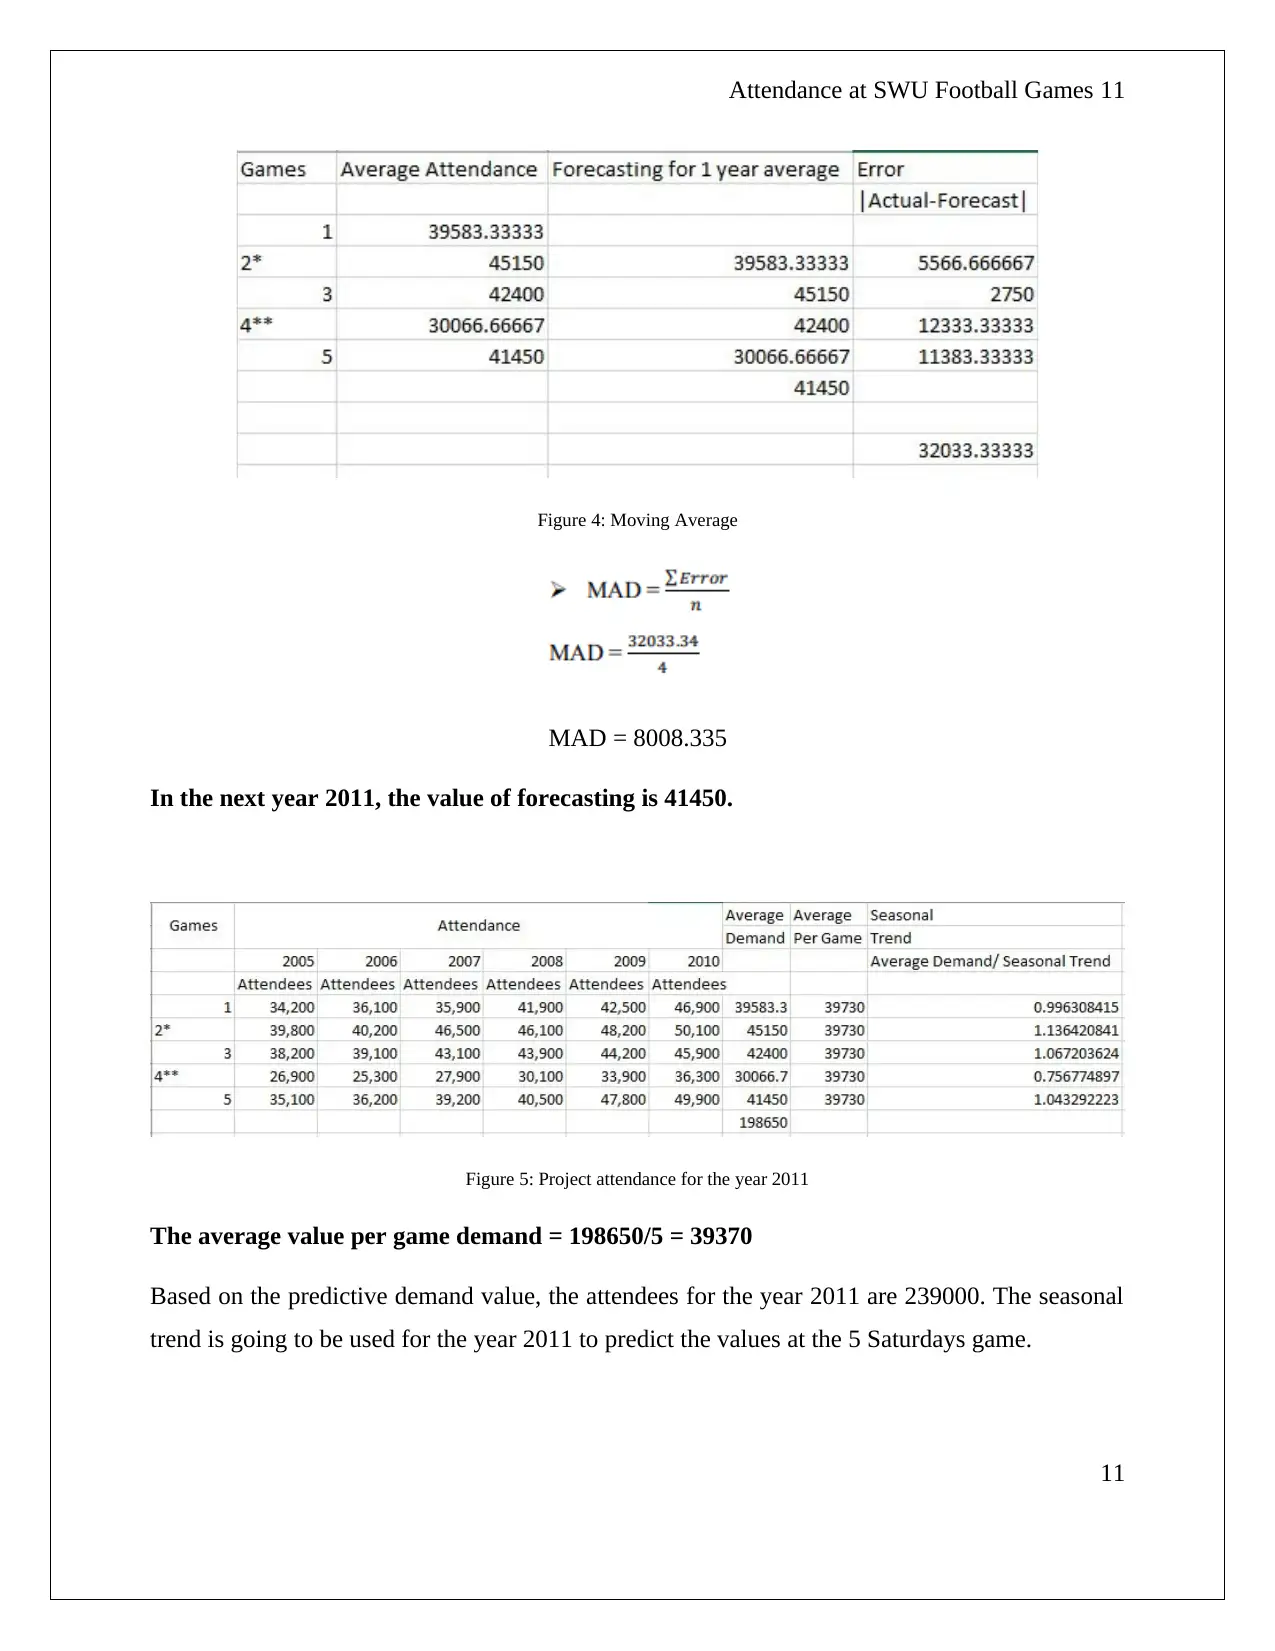
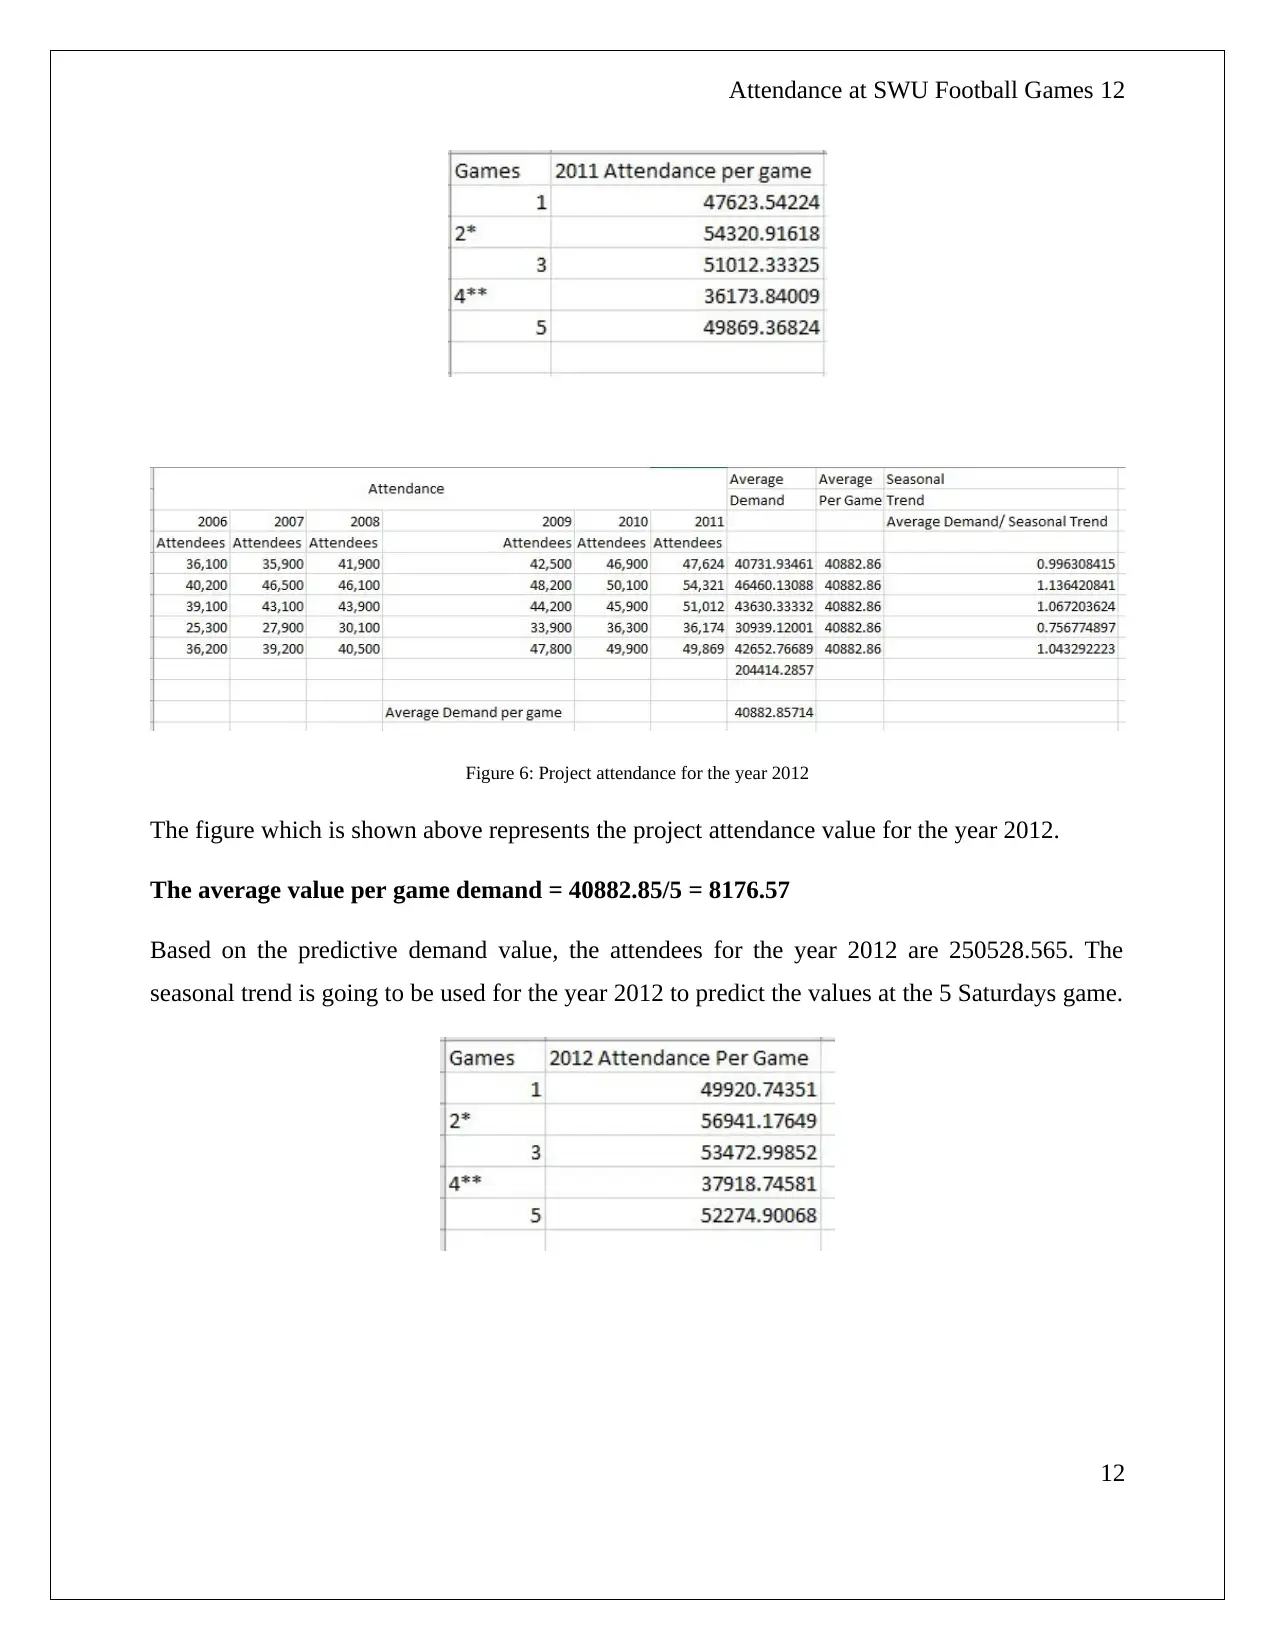
This case study analyzes the attendance data for Southwestern University (SWU) football games from 2005 to 2010. The report aims to develop a forecasting model to predict attendance for the years 2011 and 2012, using methods like moving average and trend projections. The analysis includes the calculation of expected revenues for these years, considering ticket price assumptions. Furthermore, the report discusses strategic options for the university, such as stadium expansion, based on the projected attendance and revenue figures. The study concludes with a summary of the findings, highlighting the potential for increased attendance and revenue, and the need for strategic planning to accommodate future growth. The report's findings indicate the potential for increased attendance and revenue, and the need for strategic planning to accommodate future growth.
Document Page
RUNNING HEAD: Attendance at SWU Football Games 1
Attendance at SWU Football
Games
tabler-icon-diamond-filled.svg

Paraphrase This Document

Need a fresh take? Get an instant paraphrase of this document with our AI Paraphraser
Document Page
Attendance at SWU Football Games 2
Table of Contents
Introduction......................................................................................................................................4
Assumptions....................................................................................................................................5
Question 1: Create the forecasting model and validate the selection over another methods and
project presence through 2012.........................................................................................................6
Question 2: Defines the expected revenues for the year 2011 and 2012.......................................13
Question 3: Discuss the school’s options......................................................................................14
Conclusion.....................................................................................................................................15
2
Document Page
Attendance at SWU Football Games 3
List of Figures
Figure 1: Datasets for SWU.............................................................................................................3
Figure 2: Trend projections for the year 2011.................................................................................3
Figure 3: Trend Projections for the year 2012.................................................................................5
Figure 4: Moving Average...............................................................................................................6
Figure 5: Project attendance for the year 2011................................................................................7
Figure 6: Project attendance for the year 2012................................................................................7
3
Document Page
Attendance at SWU Football Games 4
Introduction
In this report, we are going to analyze the data of various matches, and then we will analyze the
per match attendance in the matches. Also, using that attendance, I will be developing a forecast
model that will help in predicting the number of seats in the 2011 and 2012 matches. Also, in this
report, various options related to the school and revenues that can be generated in those years
will be submitted. To find out the results, I am going to use Excel and try to find out various
results. Moving average is used to find out the number of attendance.
Figure 1: Datasets for SWU
The above figure represents the datasets sheet of the football game attendance for the
South Western University from the year 2005 to the year 2010.
4
tabler-icon-diamond-filled.svg

Paraphrase This Document

Need a fresh take? Get an instant paraphrase of this document with our AI Paraphraser
Document Page
Attendance at SWU Football Games 5
Assumptions
There are some assumptions made regarding the datasets for the number of attendees for the
football games over which the analysis is performed, and these assumptions are:
The average price of the ticket in the year 2011 is assumed to be $20.
It is assumed that there is an increment of 5% in the price for the future work.
5
Document Page
Attendance at SWU Football Games 6
Question 1: Create the forecasting model and validate the selection over
another methods and project presence through 2012.
Forecasting can be defined as the procedure of predicting, projecting, or approximating any
upcoming action, affair, or happenings from past and present data and most frequently by
evaluating trends.
Types of Forecasting Methods
Qualitative Methods- It is a type of forecasting method are formed from perceptions,
viewpoints, instincts, sentiments or personal experiences and are subjective oriented and
does not rely on any accurate mathematical calculations.
Quantitative Methods- The quantitative methods have mathematical representations and
are objective oriented as they depend on mathematical data.
Quantitative Methods consist of two models
Time-Series Models- They focus on the past sample data and endeavors to calculate the
future from those data.
Associative Models- Associative Models or Casual Representations presume the relation
between variables getting forecasted and the variables contained by the environment and
try to conclude from those relations.
This Case Study has used the Simple Moving Average Method falling under the Time Series
Models within Quantitative Methods to forecast the period Southwestern University would take
to max out its stadium.
Simple Moving Average Method- A Simple Moving Average Method is the uncomplicated type
of average in forex analysis. The calculations are made by taking the mean of a given set of
values. Supposedly if a basic 20-day moving average is to be calculated then the closing prices
6
Document Page
Attendance at SWU Football Games 7
from the precedent 20 days are to be added up and then the result is to be divided by 20. It is
invasive in the technical stock market study.
Advantages of Simple Moving Average Method
It is the most clear-cut calculation, as the average price over a span of time.
It is advantageous for finding out support or resistance levels.
The SMA shows an actual average within a span of time that eases out any unexpected or
atypical price changes.
The SMA Method is frequently preferred by dealers or forecasters working on a longer span
of time, such as daily or weekly charts
It is developed as a statistical instrument in use for its use in concurrence with data placed
spanning a particular point of time
This method has proven to be compatible with price charts and other indicators.
(Source: "Simple Moving Average (SMA) Explained," 2018)
To trend the regression lines or the projections, the method which is used is the first method.
Based on the denotation of the trend projections, this technique is suitable to the trend-line for
the sequence of the historical data values, and then it plans the line from the average predictions
to the long-range predictions in the year 2012.
7
tabler-icon-diamond-filled.svg

Paraphrase This Document

Need a fresh take? Get an instant paraphrase of this document with our AI Paraphraser
Document Page
Attendance at SWU Football Games 8
Figure 2: Trend projections for the year 2011
The figure which is shown above presents the trend projections for the year 2011 where it shows
the selection over the attendance and the project attendance.
Y= a + bt
Where the above equations show the equation of the regression line.
After performing the calculations, the value of a and b are determined which are 158300.005 and
11528.57 respectively.
8
Document Page
Attendance at SWU Football Games 9
Y= 158300.005 + 11528.57t
MAD = 2219.048
In the next year 2011, the value of forecasting is 239000.
Figure 3: Trend Projections for the year 2012
The figure which is shown above presents the trend projections for the year 2011 where it shows
the selection over the attendance and the project attendance.
Y= a + bt
Where the above equations show the equation of the regression line.
9
Document Page
Attendance at SWU Football Games 10
After performing the calculations, the value of a and b are determined which are 158300.005 and
11528.57 respectively.
Y= 158300.005 + 11528.57t
In the next year 2012, the value of forecasting is 239000.
Moving Average
Moving average also known as rolling or running average which is used to perform the
calculation to analyze the values present in the datasets by creating the sets of the averages of the
values obtained from the several subsets of the datasets (Liu et al., 2015).
To find the moving average, the method which is used is sensed method where the predictions
use the historical values of the actual data to create the predictive value. This will be useful in
those circumstances when the demand from the market will remain constant.
10
tabler-icon-diamond-filled.svg

Paraphrase This Document

Need a fresh take? Get an instant paraphrase of this document with our AI Paraphraser
Document Page
Attendance at SWU Football Games 11
Figure 4: Moving Average
MAD = 8008.335
In the next year 2011, the value of forecasting is 41450.
Figure 5: Project attendance for the year 2011
The average value per game demand = 198650/5 = 39370
Based on the predictive demand value, the attendees for the year 2011 are 239000. The seasonal
trend is going to be used for the year 2011 to predict the values at the 5 Saturdays game.
11
Document Page
Attendance at SWU Football Games 12
Figure 6: Project attendance for the year 2012
The figure which is shown above represents the project attendance value for the year 2012.
The average value per game demand = 40882.85/5 = 8176.57
Based on the predictive demand value, the attendees for the year 2012 are 250528.565. The
seasonal trend is going to be used for the year 2012 to predict the values at the 5 Saturdays game.
12
chevron_up_icon
1 out of 16
circle_padding
hide_on_mobile
zoom_out_icon