Individual Report: Server Availability Monitoring and Metrics
VerifiedAdded on 2023/01/23
|9
|2316
|74
Report
AI Summary
This report provides a comprehensive overview of server availability monitoring, addressing key issues such as service and server monitoring, and the crucial metrics for evaluating hardware, application, and service availability. The report begins by comparing various server availability monitoring tools, including Nagios, Zabbix, Cacti, OpenNMS, Icinga, WhatsUp Gold, Spiceworks, Ganglia, and collectd, evaluating their disk usage, CPU monitoring, bandwidth monitoring, and overall availability. The discussion extends to evaluating server availability monitoring architecture, specifically focusing on the Tivoli architecture and its components. Furthermore, the report proposes solutions to avoid data vulnerability in server availability monitoring tools, emphasizing continuous monitoring and the importance of skilled employees. Finally, it examines the effects of failure prediction on server availability monitoring, highlighting the potential consequences of data loss and poor server functionality. The report concludes with a summary of the findings and underscores the importance of safeguarding monitoring tools to ensure data security.
Running head: SYSTEM MANAGEMENT 1
System management
Name:
Institution:
System management
Name:
Institution:
Paraphrase This Document
Need a fresh take? Get an instant paraphrase of this document with our AI Paraphraser
SYSTEM MANAGEMENT
2
System management
Introduction
One of the core issues which many companies face in day to day operation is the monitoring
availability of services and server. In addition, there are problems which the company also faces
which includes what metrics the availability of hardware, application, and services should be
considered. Also, it is very crucial to understand the resources which services and the server will
require in an order running it smoothly and thus the company’s operations will run smoothly. In
our discussion, we shall mainly focus on comparing various server availability monitoring tools,
evaluating server availability monitoring architecture, propose a solution to avoid data
vulnerability in the server availability monitoring tools and effects of failure prediction on server
availability monitoring.
Comparison of various server availability monitoring tools
Nagios is one of the leading tools for monitoring, its disks usages are more than 2GB. In
addition, this tools has the capacity of monitoring all component in the system such as OS,
system metrics, applications, websites, and network protocol, its bandwidth monitoring is high.
Moreover, Nagios usually run on 4 core monitoring engines which give the high performance to
the system using fewer resources. As stated by Renita [5] The overall availability of the Nagios
is improved since it can allow over million users to use and also it can allow access to multi-
users.
Zabbix is a monitoring tool which is highly designed to monitors everything in the system which
includes the availability of the server, database, network equipment to network application and
the system performances. It disk usages is approximately 1.9GB and bandwidth monitoring is
SYSTEM MANAGEMENT
3
high. This tool is readily available since it is used by many companies in the worlds such as
Orange and DELL. In addition, Zabbix is also term as server agent architecture which the user
can install the agent on the server for the Zabbix server to monitor it.
Cacti is a monitoring tool which is open source, which is usually installed on Windows OS or
Linux. It has disk usage of around 1.5 GB and has high bandwidth monitoring. This tool is
connected to RRDTool will allow users to generate graphs for network data. It closely works
with SNMP and it gives out network statistics in the form of charts that user can easily
understand thus it is readily available.
OpenNMS is another tool for monitoring server and networks and this tools data can be collected
using metrics which includes XML HTTP, JDBC, XML, and JSON. This tools can be used to
discover the two layers network of topology thus CPU monitoring is high. In addition, this tool
supports grafana and it is building in event-driven architecture. The monitoring process of
OpenNMS is very simple since its report can be view in the dashboard and charts. It is disk
usage is approximately 1.7GB and bandwidth monitoring is moderate.
Icinga is monitoring a tool that allows the user to monitor all the available systems in the
network, which can alert the user if there is an alarm to secure database in the system. In terms of
CPU monitoring, these tools are faster, scalable and easily configured. For instance, Kim says [7]
Its disk usage is around 1.4GB and bandwidth monitoring is slightly high. Generally, this tool is
readily available and thus it requires high CPU monitoring as elaborated in [6].
WhatsUp Gold is up and down monitoring tool, which can be used in alerting the system, and be
configured to submit alerts via email or SMS when the server experience a problem. In addition
to WhatsUp Gold monitoring devices, it can also monitor processes and services. Its disk usage
⊘ This is a preview!⊘
Do you want full access?
Subscribe today to unlock all pages.

Trusted by 1+ million students worldwide
SYSTEM MANAGEMENT
4
is 1.5GB and Bandwidth monitoring is high, also it requires less CPU monitoring and this tool is
available for every user as for example [2].
Spice works are monitoring tools which offer help support ticketing and IT network
management. The spice works network monitors all the activities in the server and allows for
tracking so as to identify the upcoming problem. Its disk usage is 1.3GB and low CPU
monitoring and bandwidth monitoring. The availability to the user is frequent since the
administrator can rectify the system when he received alerts.
Ganglia is a monitoring tool which is scalable and can perform high-performance computing. It
has several components for monitoring, for instance, it has Gmond which is a small service
where the information about node is collected and then installed in every server. The Disk usage
in Ganglia is very low and it can accommodate a disk usage approximately 1.0GB. In addition,
its bandwidth monitoring is low since its monitoring services in minimal. Lastly, it is available at
all time for any user as stated by Hernandez [1].
Collected is a monitoring tool that collects data for the system that runs on it and then stored
information in the server. The statistics from the collected information is used to predict future
system load and also for performance analysis. The Disk usage for this tool is approximately
1.2GB and its monitoring bandwidth capability is slightly after as compared to Ganglia. This tool
also requires high CPU monitoring and also high process monitoring for it to be available to its
users.
Discussion and evaluation of server availability monitoring architecture
In our discussion, we shall discuss Tivoli architecture. This architecture is used in monitoring
various products and also it provides the information which assists in preparation and
deployment to the component products. Tivoli monitoring products and other various products
Paraphrase This Document
Need a fresh take? Get an instant paraphrase of this document with our AI Paraphraser
SYSTEM MANAGEMENT
5
that share the common Tivoli management services, always participate in the architecture of
server-client agent. Data from various monitoring agencies such as databases, applications, and
subsystems will be collected and then it is sent to the server in Tivoli enterprise monitoring as
elaborated in [3]. The send data will be accessible from the monitoring server by dashboard users
and Tivoli enterprise portal clients. And before deploying the Tivoli monitoring product to any
environment it is very crucial for each individual to understand the various component of Tivoli
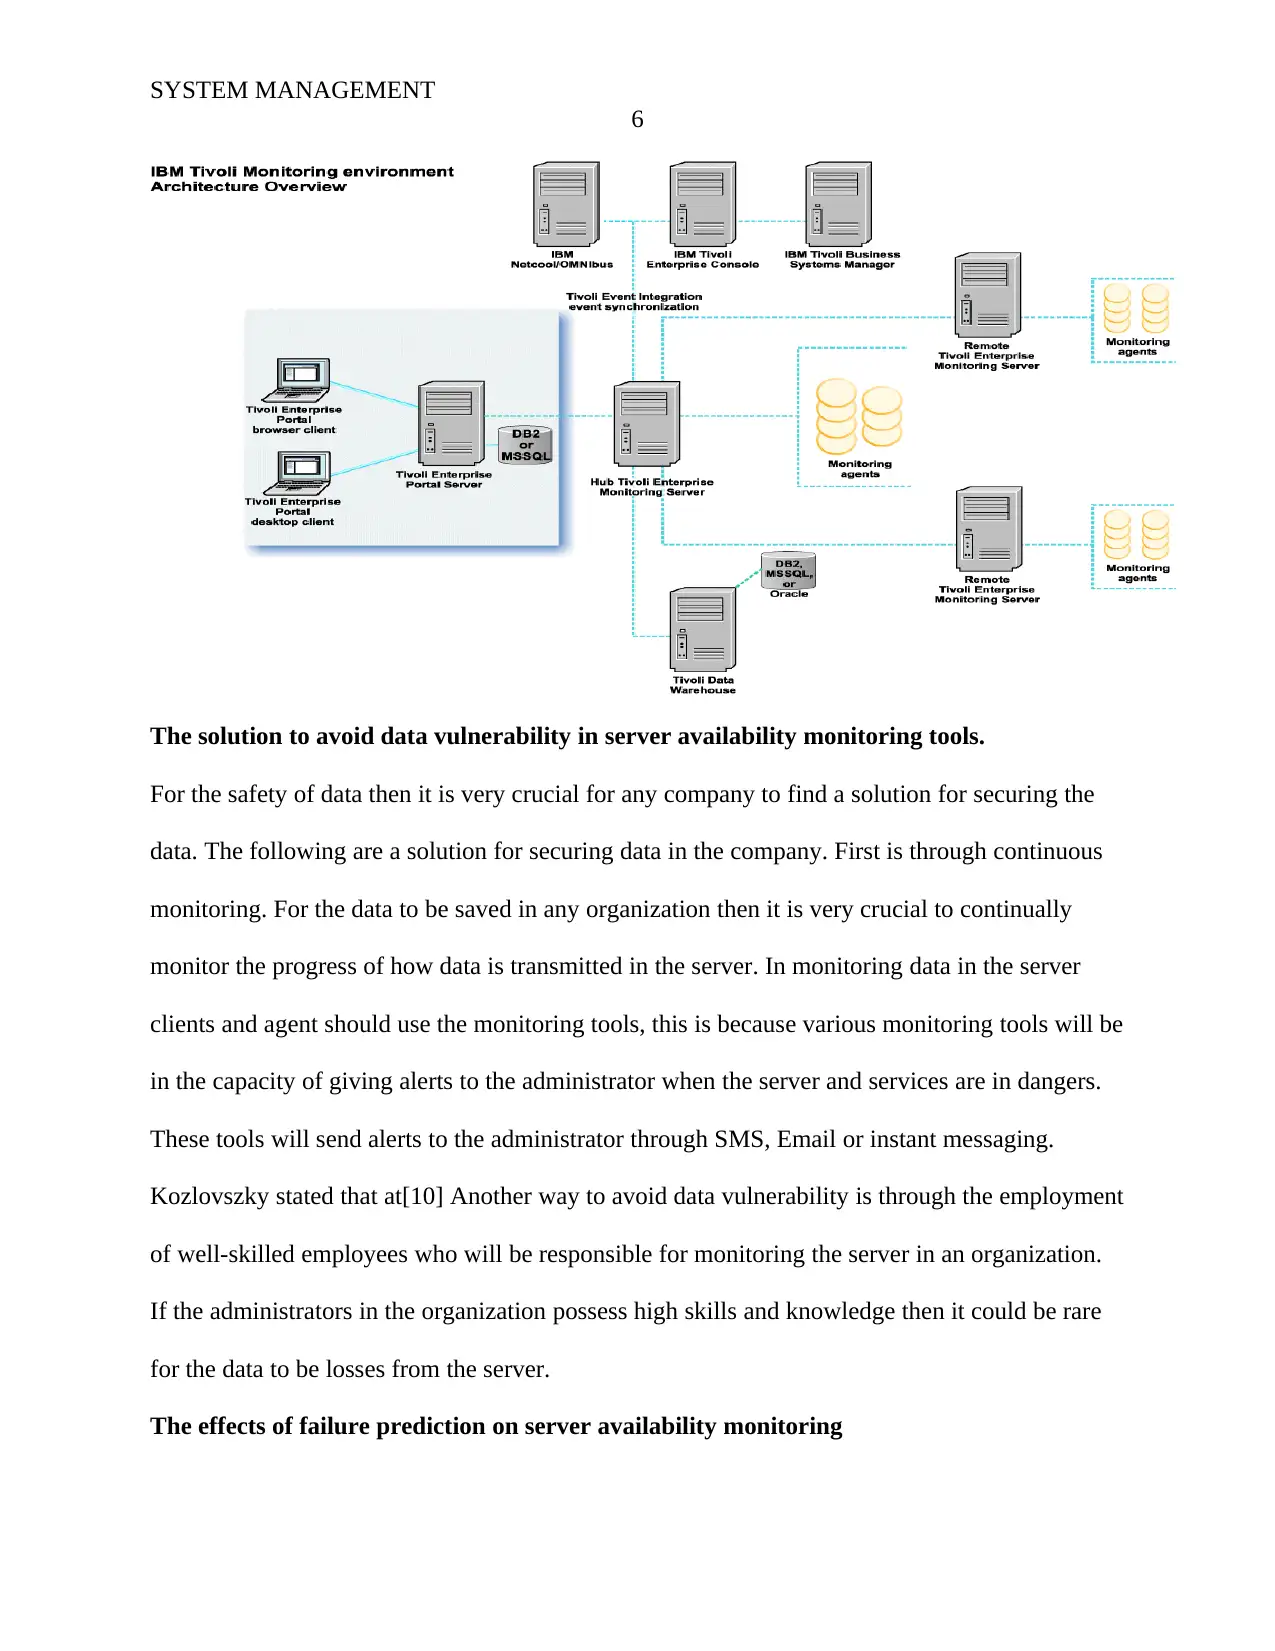
monitoring product. Which includes the following; first is more than one Tivoli enterprise
monitoring servers, this component acts as the control points for any alerts from agents and also
it manages the collection of the agent's status. As said by Nickolov [9].Second is more than one
Tivoli enterprise portal clients, with a user interface from java for monitoring purposes. In
addition, it offers desktop and browser operation. The third component consists of an Eclipse
which assists the server in monitoring all the agents that have been installed in the Eclipse.
Lastly is that it consists of more than one instances of Tacmd command line interface. This
interface is used in monitoring the server environment and also to automate various
administrative functions. The CLI commands will is used to send the request to Hub monitoring
when there is a problem in server, Nickolov stated in [8]
Below is the Tivoli server availability monitoring architecture [11]
SYSTEM MANAGEMENT
6
The solution to avoid data vulnerability in server availability monitoring tools.
For the safety of data then it is very crucial for any company to find a solution for securing the
data. The following are a solution for securing data in the company. First is through continuous
monitoring. For the data to be saved in any organization then it is very crucial to continually
monitor the progress of how data is transmitted in the server. In monitoring data in the server
clients and agent should use the monitoring tools, this is because various monitoring tools will be
in the capacity of giving alerts to the administrator when the server and services are in dangers.
These tools will send alerts to the administrator through SMS, Email or instant messaging.
Kozlovszky stated that at[10] Another way to avoid data vulnerability is through the employment
of well-skilled employees who will be responsible for monitoring the server in an organization.
If the administrators in the organization possess high skills and knowledge then it could be rare
for the data to be losses from the server.
The effects of failure prediction on server availability monitoring
⊘ This is a preview!⊘
Do you want full access?
Subscribe today to unlock all pages.

Trusted by 1+ million students worldwide
SYSTEM MANAGEMENT
7
If there is a lack of failure prediction on the server availability monitoring then, the server in the
system will not be able to function as required. For example state by Zhang[4] The effects of
failure prediction includes, the important data will get lost and as a results the process of the
company will not function well since the intruders will enter into the server and starts interfering
with the content of the data and also they may distorted data in the server. As a result, the server
will not be in a capacity of sending alerts to the administrator via SMS, instant messaging and
Email when the issues occur in the server. In addition, failure prediction on server availability
will lead to poor monitoring of server, the server monitoring tools will not function well thus the
server will be in high risks of performing its functions.
Conclusion
In our discussion, we discuss various needs for monitoring IT infrastructure and we proceed on
highlighting some tools which can be used in the monitoring of services and server. We discuss
tools such as Whatup Gold, Nagios, Ganglia, collectd, Spiceworks, OpenNMS, Icinga, cacti and
Zabbix. We also extend our discussion on discussing each monitoring tools in terms of Disk
usage, CPU monitoring, process monitoring, resource measuring, overall, and bandwidth
monitoring. Moreover, we discuss server availability architecture and mainly we focused on the
components of Tivoli architecture and its function to server. Also, we discuss various ways to
avoid data vulnerability in the server monitoring tools here we discuss solutions such as
continuous monitoring of server and training of administrators so that they gain knowledge
which will be used for monitoring. Lastly, we discuss the effects of failure prediction on server
monitoring availability. If the monitoring of server and services is greatly focused on every
organization then the company’s data will be at the safer side thus it is important to safeguards
monitoring tool
Paraphrase This Document
Need a fresh take? Get an instant paraphrase of this document with our AI Paraphraser
SYSTEM MANAGEMENT
8
References
[1] Hernantes, J., Gallardo, G., & Serrano, N. (2015). IT infrastructure-monitoring tools.
IEEE Software, 32(4), 88-93.
[2] Alhamazani, K., Ranjan, R., Mitra, K., Rabhi, F., Jayaraman, P. P., Khan, S. U., ... &
Bhatnagar, V. (2015). An overview of the commercial cloud monitoring tools: research
dimensions, design issues, and state-of-the-art. Computing, 97(4), 357-377.
[3] Nevarez, B. (2016). SQL Server Storage. In High-Performance SQL Server (pp. 181-196).
Apress, Berkeley, CA.
[4] Zhang, T., & Lee, R. B. (2015, June). CloudMonatt: an architecture for security health
monitoring and attestation of virtual machines in cloud computing. In ACM SIGARCH Computer
Architecture News (Vol. 43, No. 3, pp. 362-374). ACM.
[5] Renita, J., & Elizabeth, N. E. (2017, March). Network's server monitoring and analysis
using Nagios. In 2017 International Conference on Wireless Communications, Signal
Processing and Networking (WiSPNET) (pp. 1904-1909). IEEE.
[6] Chandran, M., & Walvekar, J. (2018). Monitoring in a Virtualized Environment. GSTF
Journal on Computing (JoC), 1(1).
[7] Kim, S. K., Ma, S. Y., & Moon, J. (2016). A novel secure architecture of the virtualized
server system. The Journal of Supercomputing, 72(1), 24-37.
[8] Nickolov, P., Schibler, R., & Armijo, B. (2019). U.S. Patent Application No. 16/197,273.
[9] Nickolov, P., Schibler, R., & Armijo, B. (2017). U.S. Patent Application No. 15/219,789.
[10] Kozlovszky, M. (2016). Cloud security monitoring and vulnerability management. In
Critical Infrastructure Protection Research (pp. 123-139). Springer, Cham.

SYSTEM MANAGEMENT
9
[11] Altoyan, N., & Perry, D. E. (2017, September). Towards a well-formed software
architecture analysis. In Proceedings of the 11th European Conference on Software
Architecture: Companion Proceedings (pp. 173-179). ACM.
9
[11] Altoyan, N., & Perry, D. E. (2017, September). Towards a well-formed software
architecture analysis. In Proceedings of the 11th European Conference on Software
Architecture: Companion Proceedings (pp. 173-179). ACM.
⊘ This is a preview!⊘
Do you want full access?
Subscribe today to unlock all pages.

Trusted by 1+ million students worldwide
1 out of 9
Related Documents
Your All-in-One AI-Powered Toolkit for Academic Success.
+13062052269
info@desklib.com
Available 24*7 on WhatsApp / Email
![[object Object]](/_next/static/media/star-bottom.7253800d.svg)
Unlock your academic potential
Copyright © 2020–2026 A2Z Services. All Rights Reserved. Developed and managed by ZUCOL.


